Zip Codes with the Highest Percentage of Population Employed in Accommodation & Food Services in Stillwater, OK
RELATED REPORTS & OPTIONS
Accommodation & Food Services
Stillwater
Compare Zip Codes
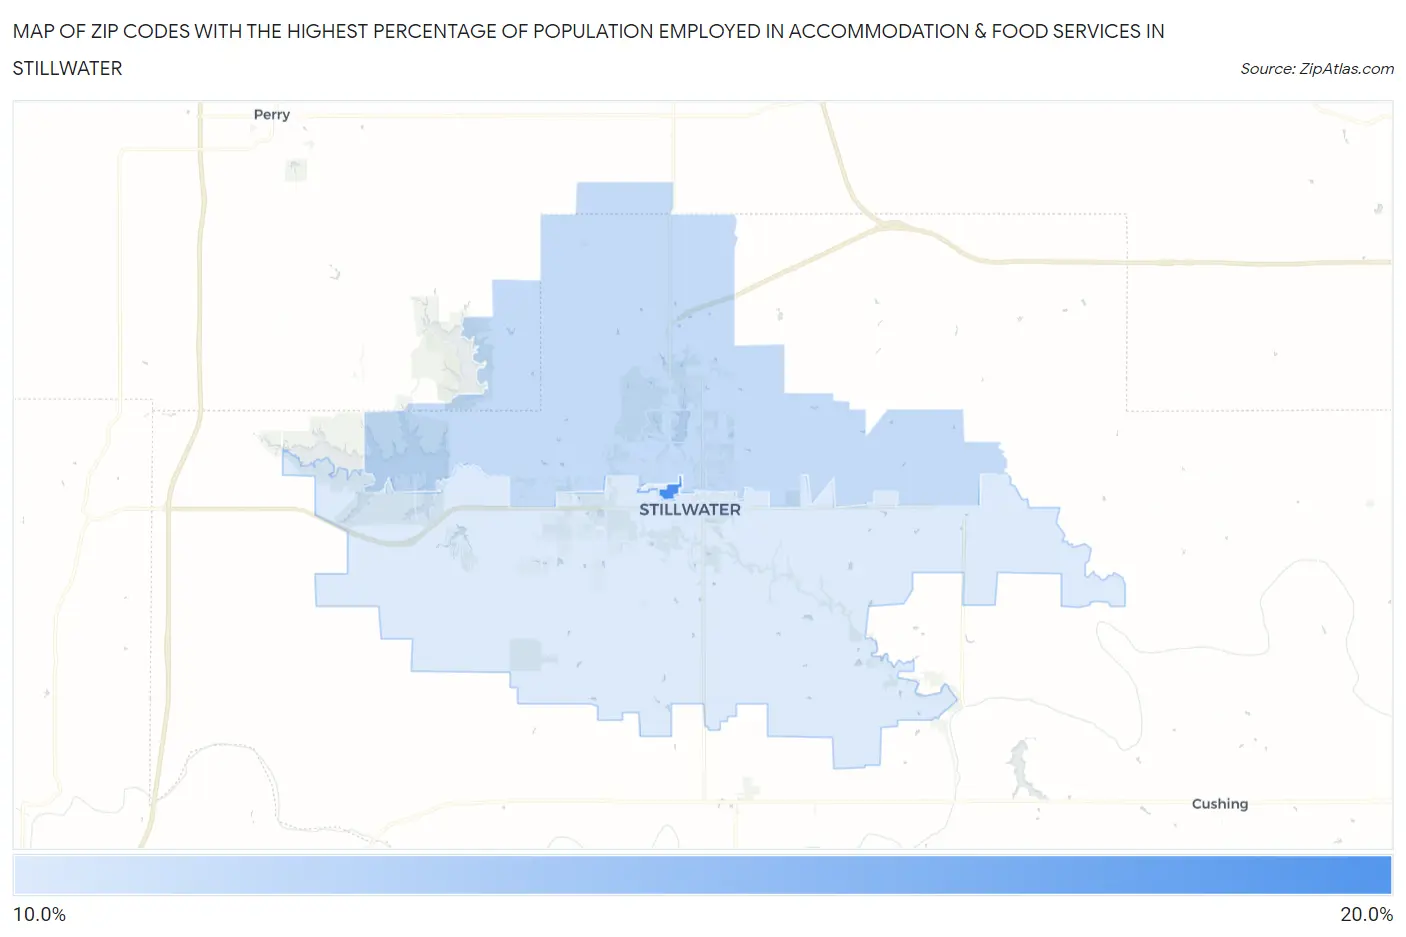
Map of Zip Codes with the Highest Percentage of Population Employed in Accommodation & Food Services in Stillwater
11.9%
17.3%
Zip Codes with the Highest Percentage of Population Employed in Accommodation & Food Services in Stillwater, OK
| Zip Code | % Employed | vs State | vs National | |
| 1. | 74077 | 17.3% | 7.0%(+10.3)#14 | 6.9%(+10.4)#1,221 |
| 2. | 74075 | 12.8% | 7.0%(+5.78)#32 | 6.9%(+5.89)#2,448 |
| 3. | 74074 | 11.9% | 7.0%(+4.90)#37 | 6.9%(+5.01)#2,911 |
1
Common Questions
What are the Top 3 Zip Codes with the Highest Percentage of Population Employed in Accommodation & Food Services in Stillwater, OK?
Top 3 Zip Codes with the Highest Percentage of Population Employed in Accommodation & Food Services in Stillwater, OK are:
What zip code has the Highest Percentage of Population Employed in Accommodation & Food Services in Stillwater, OK?
74077 has the Highest Percentage of Population Employed in Accommodation & Food Services in Stillwater, OK with 17.3%.
What is the Percentage of Population Employed in Accommodation & Food Services in Stillwater, OK?
Percentage of Population Employed in Accommodation & Food Services in Stillwater is 12.4%.
What is the Percentage of Population Employed in Accommodation & Food Services in Oklahoma?
Percentage of Population Employed in Accommodation & Food Services in Oklahoma is 7.0%.
What is the Percentage of Population Employed in Accommodation & Food Services in the United States?
Percentage of Population Employed in Accommodation & Food Services in the United States is 6.9%.