Zip Codes with the Highest Percentage of Population Employed in Accommodation & Food Services in Ponca City, OK
RELATED REPORTS & OPTIONS
Accommodation & Food Services
Ponca City
Compare Zip Codes
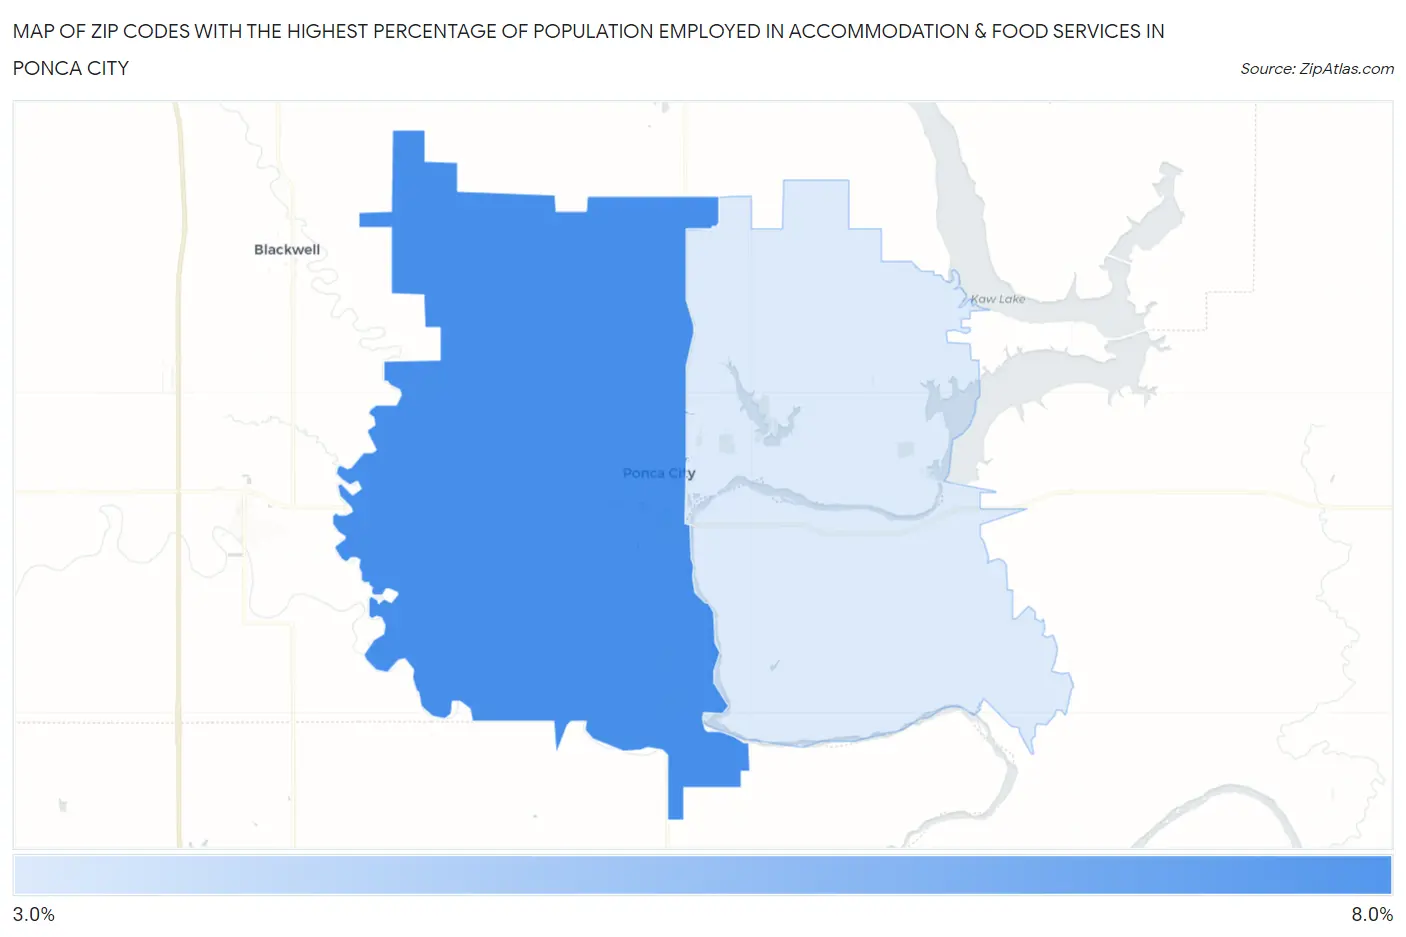
Map of Zip Codes with the Highest Percentage of Population Employed in Accommodation & Food Services in Ponca City
3.6%
6.9%
Zip Codes with the Highest Percentage of Population Employed in Accommodation & Food Services in Ponca City, OK
| Zip Code | % Employed | vs State | vs National | |
| 1. | 74601 | 6.9% | 7.0%(-0.053)#196 | 6.9%(+0.055)#10,509 |
| 2. | 74604 | 3.6% | 7.0%(-3.35)#408 | 6.9%(-3.24)#21,311 |
1
Common Questions
What are the Top Zip Codes with the Highest Percentage of Population Employed in Accommodation & Food Services in Ponca City, OK?
Top Zip Codes with the Highest Percentage of Population Employed in Accommodation & Food Services in Ponca City, OK are:
What zip code has the Highest Percentage of Population Employed in Accommodation & Food Services in Ponca City, OK?
74601 has the Highest Percentage of Population Employed in Accommodation & Food Services in Ponca City, OK with 6.9%.
What is the Percentage of Population Employed in Accommodation & Food Services in Ponca City, OK?
Percentage of Population Employed in Accommodation & Food Services in Ponca City is 6.2%.
What is the Percentage of Population Employed in Accommodation & Food Services in Oklahoma?
Percentage of Population Employed in Accommodation & Food Services in Oklahoma is 7.0%.
What is the Percentage of Population Employed in Accommodation & Food Services in the United States?
Percentage of Population Employed in Accommodation & Food Services in the United States is 6.9%.