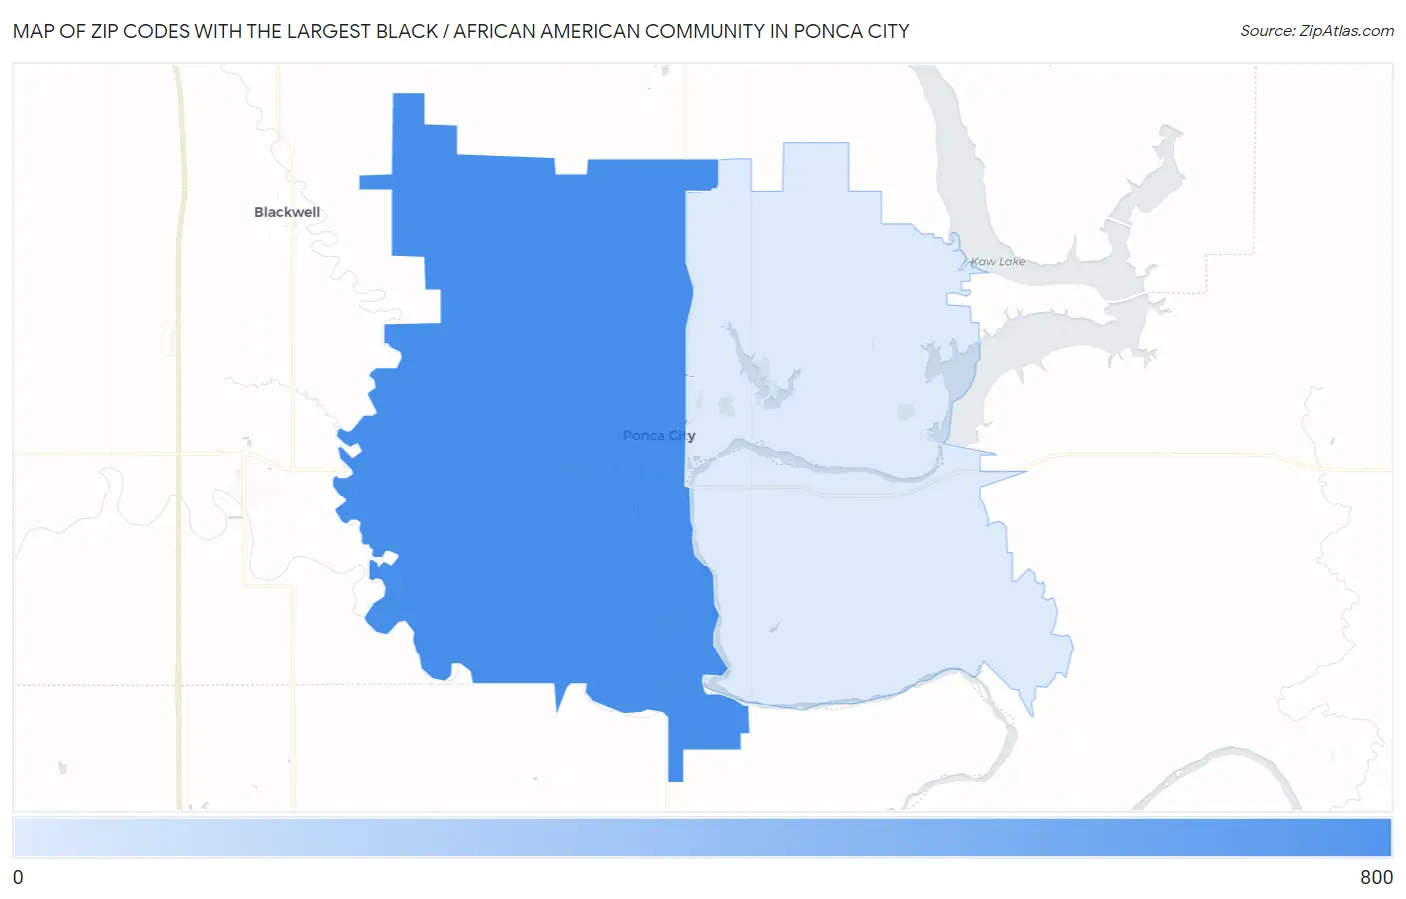
Zip Codes with the Largest Black / African American Community in Ponca City, OK
RELATED REPORTS & OPTIONS
Black / African American
Ponca City
Compare Zip Codes
Map of Zip Codes with the Largest Black / African American Community in Ponca City
90
704
Zip Codes with the Largest Black / African American Community in Ponca City, OK
| Zip Code | Black / African American | vs State | vs National | |
| 1. | 74601 | 704 | 284,453(0.25%)#92 | 41,288,572(0.00%)#7,953 |
| 2. | 74604 | 90 | 284,453(0.03%)#201 | 41,288,572(0.00%)#13,957 |
1
Common Questions
What are the Top Zip Codes with the Largest Black / African American Community in Ponca City, OK?
Top Zip Codes with the Largest Black / African American Community in Ponca City, OK are:
What zip code has the Largest Black / African American Community in Ponca City, OK?
74601 has the Largest Black / African American Community in Ponca City, OK with 704.
What is the Total Black / African American Population in Ponca City, OK?
Total Black / African American Population in Ponca City is 784.
What is the Total Black / African American Population in Oklahoma?
Total Black / African American Population in Oklahoma is 284,453.
What is the Total Black / African American Population in the United States?
Total Black / African American Population in the United States is 41,288,572.