Zip Codes with the Most Immigrants from South Eastern Asia in Ponca City, OK
RELATED REPORTS & OPTIONS
South Eastern Asia
Ponca City
Compare Zip Codes
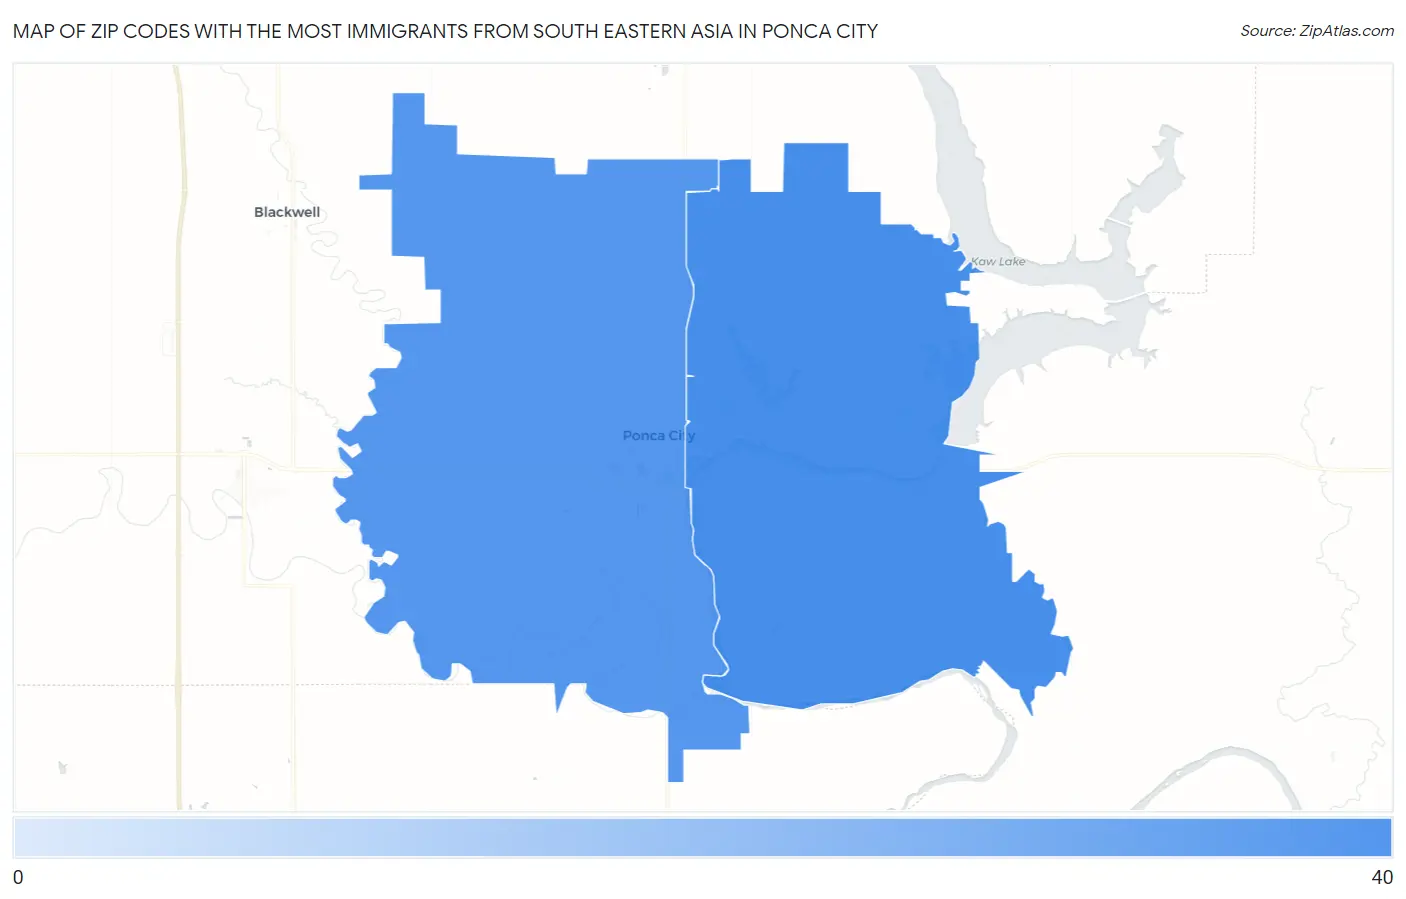
Map of Zip Codes with the Most Immigrants from South Eastern Asia in Ponca City
23
33
Zip Codes with the Most Immigrants from South Eastern Asia in Ponca City, OK
| Zip Code | South Eastern Asia | vs State | vs National | |
| 1. | 74604 | 33 | 31,076(0.11%)#121 | 4,292,058(0.00%)#8,929 |
| 2. | 74601 | 23 | 31,076(0.07%)#143 | 4,292,058(0.00%)#9,897 |
1
Common Questions
What are the Top Zip Codes with the Most Immigrants from South Eastern Asia in Ponca City, OK?
Top Zip Codes with the Most Immigrants from South Eastern Asia in Ponca City, OK are:
What zip code has the Most Immigrants from South Eastern Asia in Ponca City, OK?
74604 has the Most Immigrants from South Eastern Asia in Ponca City, OK with 33.
What is the Total Immigrants from South Eastern Asia in Ponca City, OK?
Total Immigrants from South Eastern Asia in Ponca City is 50.
What is the Total Immigrants from South Eastern Asia in Oklahoma?
Total Immigrants from South Eastern Asia in Oklahoma is 31,076.
What is the Total Immigrants from South Eastern Asia in the United States?
Total Immigrants from South Eastern Asia in the United States is 4,292,058.