Zip Codes with the Highest Percentage of Population Employed in Legal Services & Support in Ponca City, OK
RELATED REPORTS & OPTIONS
Legal Services & Support
Ponca City
Compare Zip Codes
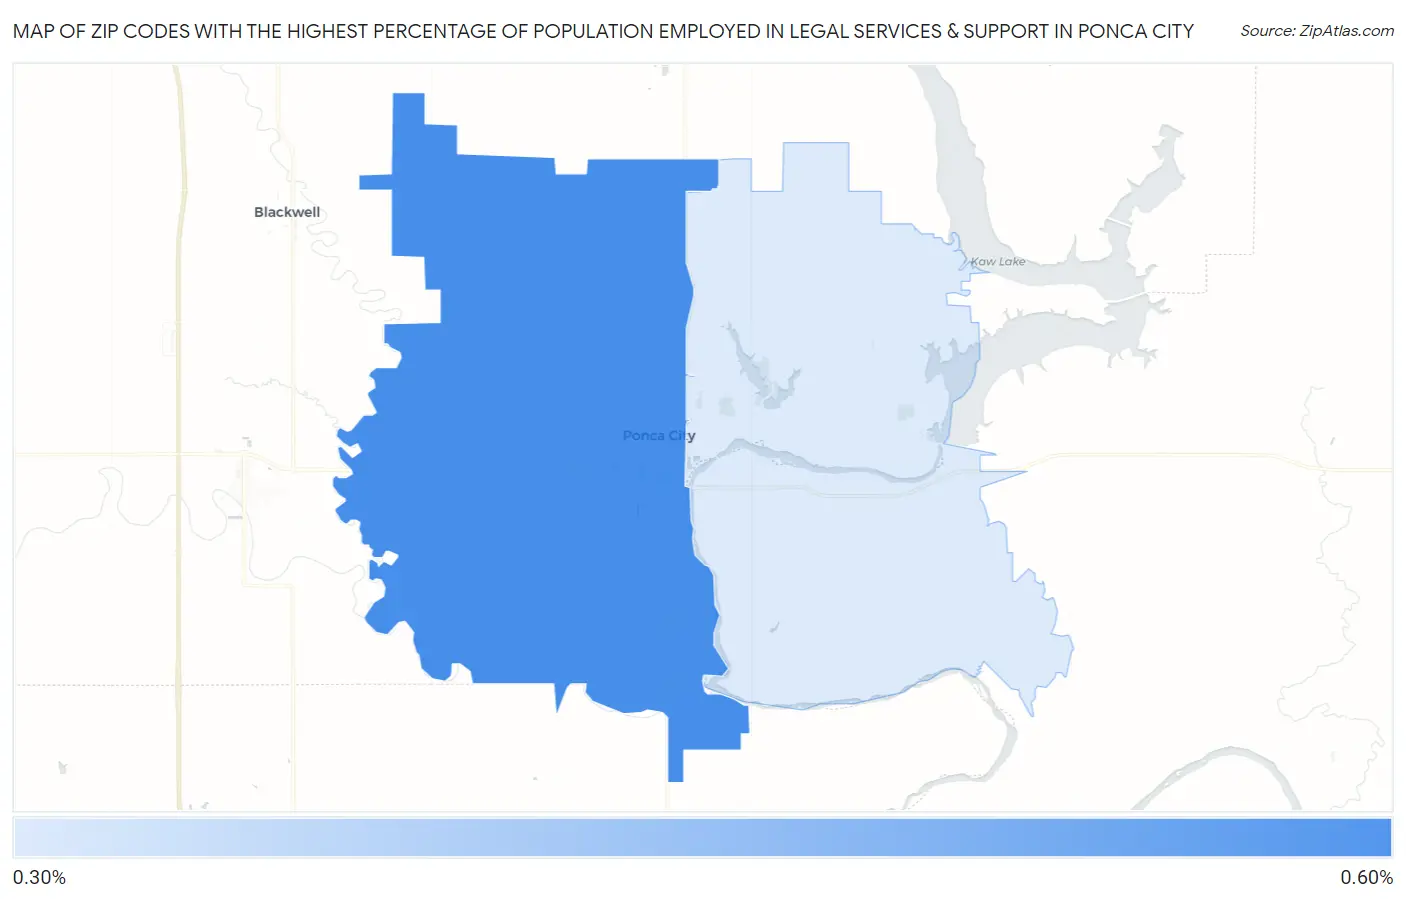
Map of Zip Codes with the Highest Percentage of Population Employed in Legal Services & Support in Ponca City
0.37%
0.56%
Zip Codes with the Highest Percentage of Population Employed in Legal Services & Support in Ponca City, OK
| Zip Code | % Employed | vs State | vs National | |
| 1. | 74601 | 0.56% | 1.0%(-0.450)#197 | 1.2%(-0.625)#11,948 |
| 2. | 74604 | 0.37% | 1.0%(-0.641)#254 | 1.2%(-0.816)#14,227 |
1
Common Questions
What are the Top Zip Codes with the Highest Percentage of Population Employed in Legal Services & Support in Ponca City, OK?
Top Zip Codes with the Highest Percentage of Population Employed in Legal Services & Support in Ponca City, OK are:
What zip code has the Highest Percentage of Population Employed in Legal Services & Support in Ponca City, OK?
74601 has the Highest Percentage of Population Employed in Legal Services & Support in Ponca City, OK with 0.56%.
What is the Percentage of Population Employed in Legal Services & Support in Ponca City, OK?
Percentage of Population Employed in Legal Services & Support in Ponca City is 0.57%.
What is the Percentage of Population Employed in Legal Services & Support in Oklahoma?
Percentage of Population Employed in Legal Services & Support in Oklahoma is 1.0%.
What is the Percentage of Population Employed in Legal Services & Support in the United States?
Percentage of Population Employed in Legal Services & Support in the United States is 1.2%.