Zip Codes with the Highest Percentage of Population Employed in Arts, Entertainment & Recreation in Youngstown, OH
RELATED REPORTS & OPTIONS
Arts, Entertainment & Recreation
Youngstown
Compare Zip Codes
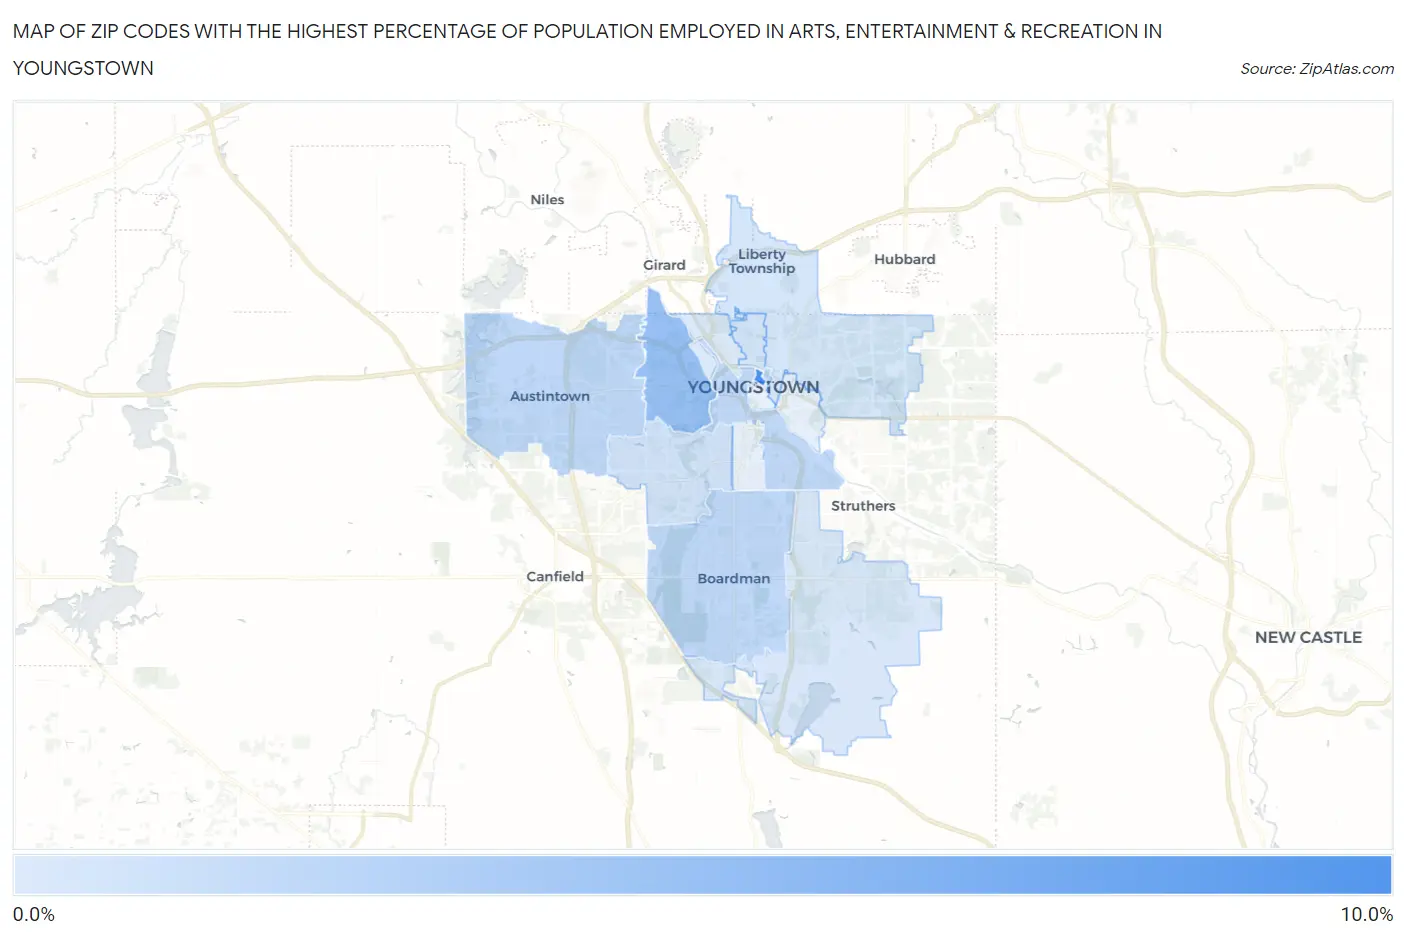
Map of Zip Codes with the Highest Percentage of Population Employed in Arts, Entertainment & Recreation in Youngstown
1.0%
8.2%
Zip Codes with the Highest Percentage of Population Employed in Arts, Entertainment & Recreation in Youngstown, OH
| Zip Code | % Employed | vs State | vs National | |
| 1. | 44555 | 8.2% | 1.7%(+6.57)#14 | 2.1%(+6.16)#994 |
| 2. | 44509 | 4.3% | 1.7%(+2.62)#49 | 2.1%(+2.22)#2,964 |
| 3. | 44512 | 2.5% | 1.7%(+0.782)#175 | 2.1%(+0.378)#7,351 |
| 4. | 44515 | 2.4% | 1.7%(+0.727)#190 | 2.1%(+0.323)#7,625 |
| 5. | 44502 | 2.3% | 1.7%(+0.651)#197 | 2.1%(+0.247)#7,986 |
| 6. | 44511 | 1.6% | 1.7%(-0.116)#386 | 2.1%(-0.520)#12,753 |
| 7. | 44504 | 1.5% | 1.7%(-0.208)#413 | 2.1%(-0.612)#13,442 |
| 8. | 44505 | 1.3% | 1.7%(-0.361)#468 | 2.1%(-0.765)#14,581 |
| 9. | 44514 | 1.3% | 1.7%(-0.427)#496 | 2.1%(-0.831)#15,090 |
| 10. | 44510 | 1.0% | 1.7%(-0.646)#566 | 2.1%(-1.05)#16,711 |
1
Common Questions
What are the Top 10 Zip Codes with the Highest Percentage of Population Employed in Arts, Entertainment & Recreation in Youngstown, OH?
Top 10 Zip Codes with the Highest Percentage of Population Employed in Arts, Entertainment & Recreation in Youngstown, OH are:
What zip code has the Highest Percentage of Population Employed in Arts, Entertainment & Recreation in Youngstown, OH?
44555 has the Highest Percentage of Population Employed in Arts, Entertainment & Recreation in Youngstown, OH with 8.2%.
What is the Percentage of Population Employed in Arts, Entertainment & Recreation in Youngstown, OH?
Percentage of Population Employed in Arts, Entertainment & Recreation in Youngstown is 2.1%.
What is the Percentage of Population Employed in Arts, Entertainment & Recreation in Ohio?
Percentage of Population Employed in Arts, Entertainment & Recreation in Ohio is 1.7%.
What is the Percentage of Population Employed in Arts, Entertainment & Recreation in the United States?
Percentage of Population Employed in Arts, Entertainment & Recreation in the United States is 2.1%.