Zip Codes with the Highest Percentage of Population Employed in Community & Social Service in Youngstown, OH
RELATED REPORTS & OPTIONS
Community & Social Service
Youngstown
Compare Zip Codes
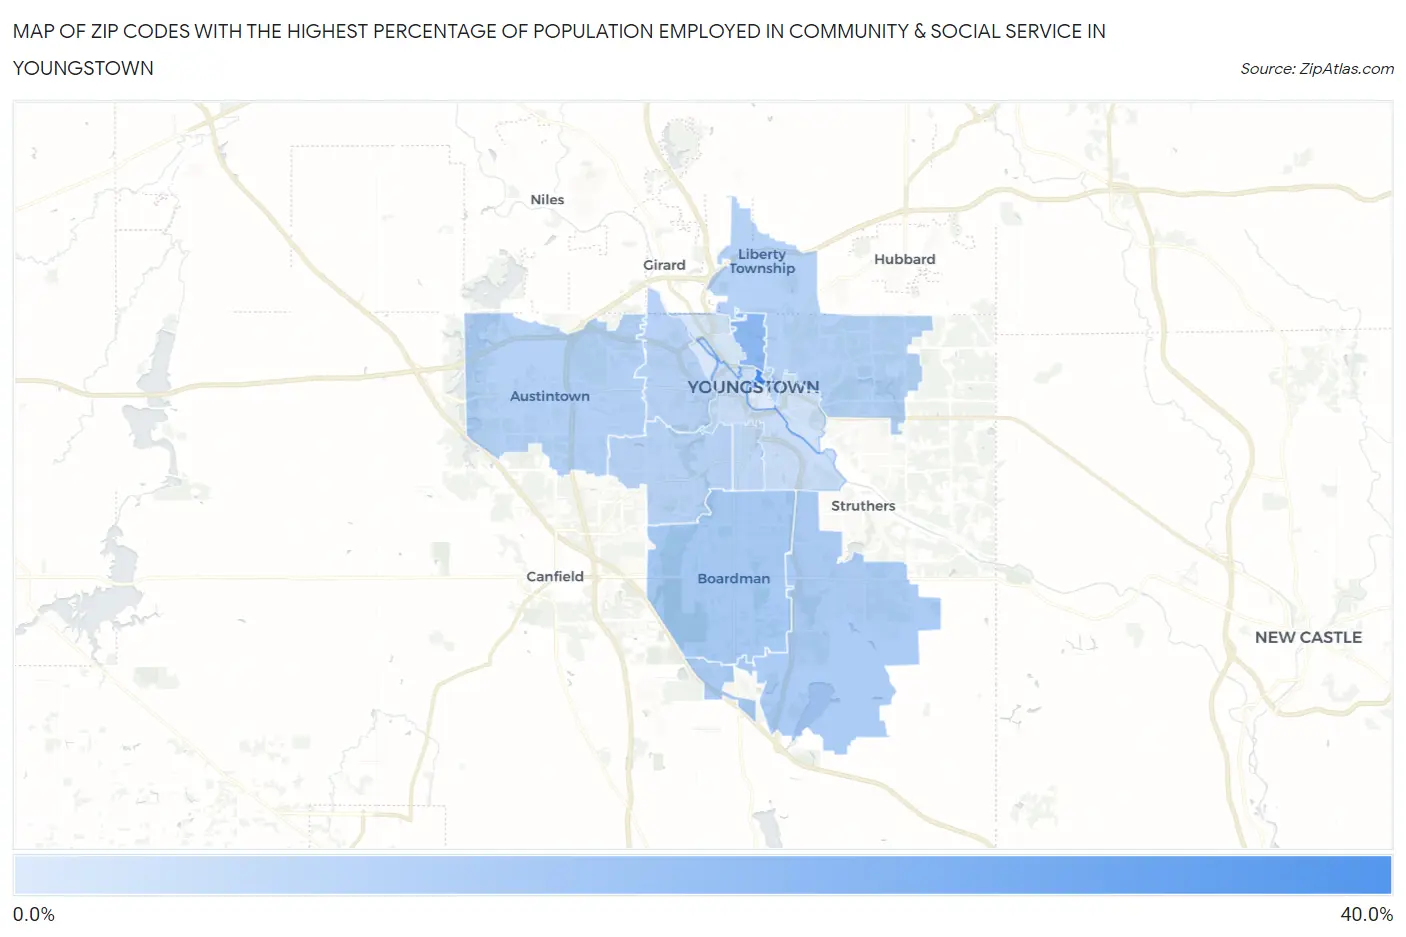
Map of Zip Codes with the Highest Percentage of Population Employed in Community & Social Service in Youngstown
0.73%
34.0%
Zip Codes with the Highest Percentage of Population Employed in Community & Social Service in Youngstown, OH
| Zip Code | % Employed | vs State | vs National | |
| 1. | 44555 | 34.0% | 10.0%(+24.1)#9 | 11.2%(+22.8)#415 |
| 2. | 44504 | 17.1% | 10.0%(+7.10)#70 | 11.2%(+5.84)#3,338 |
| 3. | 44512 | 11.7% | 10.0%(+1.72)#248 | 11.2%(+0.457)#10,072 |
| 4. | 44514 | 10.6% | 10.0%(+0.673)#324 | 11.2%(-0.586)#12,570 |
| 5. | 44505 | 8.6% | 10.0%(-1.34)#501 | 11.2%(-2.60)#17,855 |
| 6. | 44515 | 8.5% | 10.0%(-1.46)#514 | 11.2%(-2.72)#18,185 |
| 7. | 44511 | 8.0% | 10.0%(-1.97)#584 | 11.2%(-3.23)#19,610 |
| 8. | 44509 | 7.9% | 10.0%(-2.08)#603 | 11.2%(-3.34)#19,957 |
| 9. | 44507 | 6.0% | 10.0%(-4.00)#825 | 11.2%(-5.26)#24,463 |
| 10. | 44502 | 4.4% | 10.0%(-5.51)#956 | 11.2%(-6.77)#27,007 |
| 11. | 44506 | 2.8% | 10.0%(-7.20)#1,037 | 11.2%(-8.46)#28,734 |
| 12. | 44510 | 1.6% | 10.0%(-8.33)#1,080 | 11.2%(-9.59)#29,443 |
| 13. | 44503 | 0.73% | 10.0%(-9.23)#1,103 | 11.2%(-10.5)#29,809 |
1
Common Questions
What are the Top 10 Zip Codes with the Highest Percentage of Population Employed in Community & Social Service in Youngstown, OH?
Top 10 Zip Codes with the Highest Percentage of Population Employed in Community & Social Service in Youngstown, OH are:
What zip code has the Highest Percentage of Population Employed in Community & Social Service in Youngstown, OH?
44555 has the Highest Percentage of Population Employed in Community & Social Service in Youngstown, OH with 34.0%.
What is the Percentage of Population Employed in Community & Social Service in Youngstown, OH?
Percentage of Population Employed in Community & Social Service in Youngstown is 8.4%.
What is the Percentage of Population Employed in Community & Social Service in Ohio?
Percentage of Population Employed in Community & Social Service in Ohio is 10.0%.
What is the Percentage of Population Employed in Community & Social Service in the United States?
Percentage of Population Employed in Community & Social Service in the United States is 11.2%.