Zip Codes with the Highest Percentage of Population Employed in Education Instruction & Library in Youngstown, OH
RELATED REPORTS & OPTIONS
Education Instruction & Library
Youngstown
Compare Zip Codes
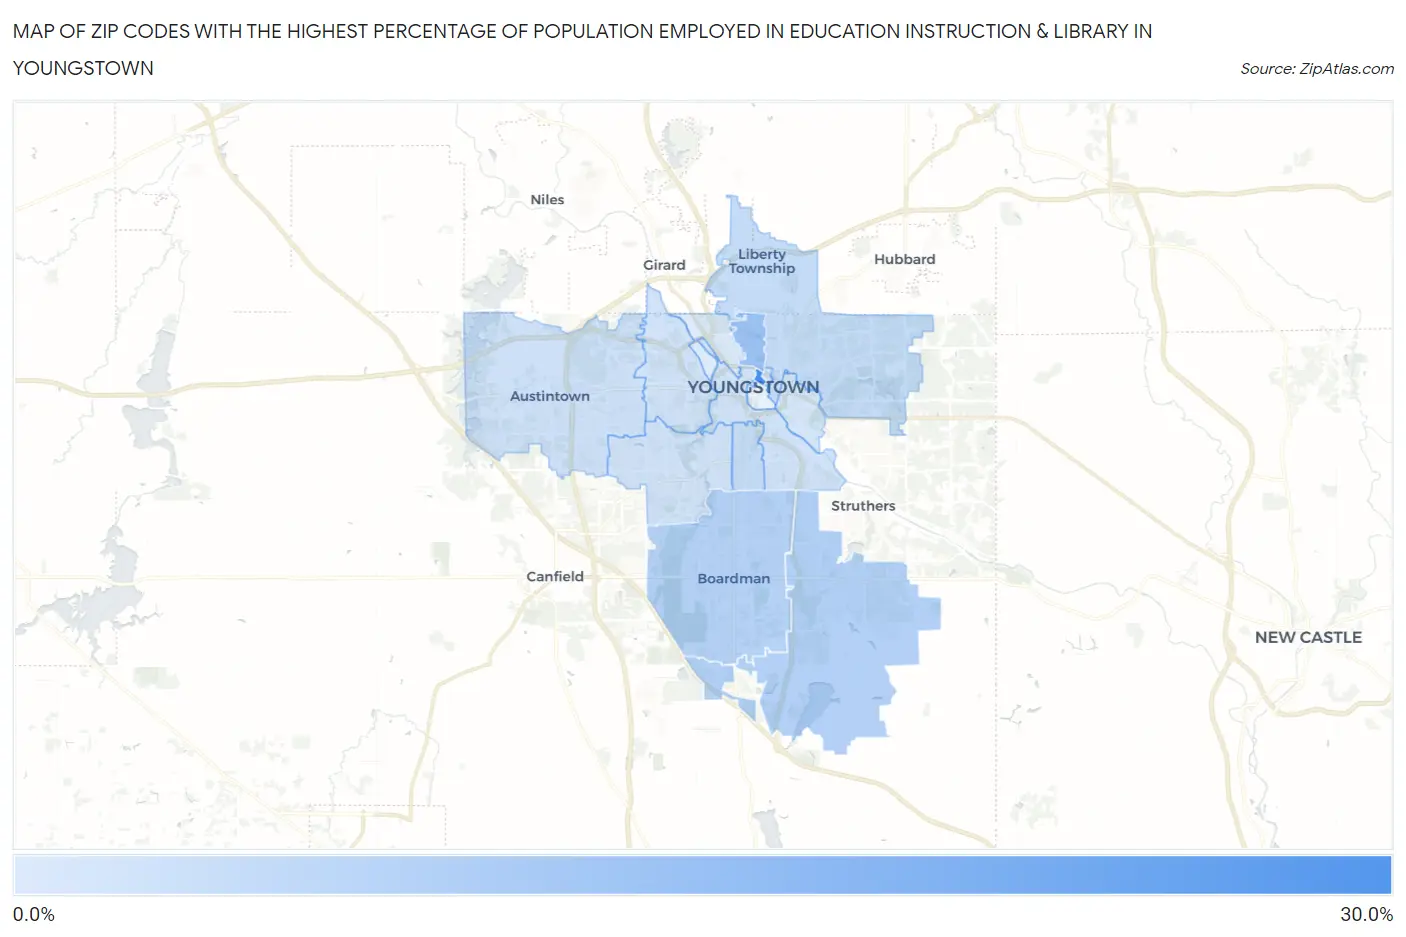
Map of Zip Codes with the Highest Percentage of Population Employed in Education Instruction & Library in Youngstown
1.6%
25.8%
Zip Codes with the Highest Percentage of Population Employed in Education Instruction & Library in Youngstown, OH
| Zip Code | % Employed | vs State | vs National | |
| 1. | 44555 | 25.8% | 5.7%(+20.1)#4 | 6.2%(+19.6)#346 |
| 2. | 44504 | 11.9% | 5.7%(+6.26)#49 | 6.2%(+5.73)#2,438 |
| 3. | 44514 | 7.6% | 5.7%(+2.00)#193 | 6.2%(+1.47)#8,049 |
| 4. | 44512 | 7.3% | 5.7%(+1.67)#217 | 6.2%(+1.14)#8,914 |
| 5. | 44505 | 5.1% | 5.7%(-0.579)#504 | 6.2%(-1.11)#17,334 |
| 6. | 44507 | 5.0% | 5.7%(-0.692)#526 | 6.2%(-1.22)#17,825 |
| 7. | 44515 | 3.7% | 5.7%(-1.90)#739 | 6.2%(-2.44)#22,563 |
| 8. | 44502 | 3.4% | 5.7%(-2.20)#788 | 6.2%(-2.74)#23,508 |
| 9. | 44509 | 3.4% | 5.7%(-2.27)#799 | 6.2%(-2.80)#23,717 |
| 10. | 44511 | 3.3% | 5.7%(-2.39)#819 | 6.2%(-2.92)#24,152 |
| 11. | 44506 | 2.8% | 5.7%(-2.90)#874 | 6.2%(-3.43)#25,421 |
| 12. | 44510 | 1.6% | 5.7%(-4.03)#993 | 6.2%(-4.56)#27,507 |
1
Common Questions
What are the Top 10 Zip Codes with the Highest Percentage of Population Employed in Education Instruction & Library in Youngstown, OH?
Top 10 Zip Codes with the Highest Percentage of Population Employed in Education Instruction & Library in Youngstown, OH are:
What zip code has the Highest Percentage of Population Employed in Education Instruction & Library in Youngstown, OH?
44555 has the Highest Percentage of Population Employed in Education Instruction & Library in Youngstown, OH with 25.8%.
What is the Percentage of Population Employed in Education Instruction & Library in Youngstown, OH?
Percentage of Population Employed in Education Instruction & Library in Youngstown is 4.7%.
What is the Percentage of Population Employed in Education Instruction & Library in Ohio?
Percentage of Population Employed in Education Instruction & Library in Ohio is 5.7%.
What is the Percentage of Population Employed in Education Instruction & Library in the United States?
Percentage of Population Employed in Education Instruction & Library in the United States is 6.2%.