Zip Codes with the Highest Percentage of Population Employed in Community & Social Service in Bowling Green, OH
RELATED REPORTS & OPTIONS
Community & Social Service
Bowling Green
Compare Zip Codes
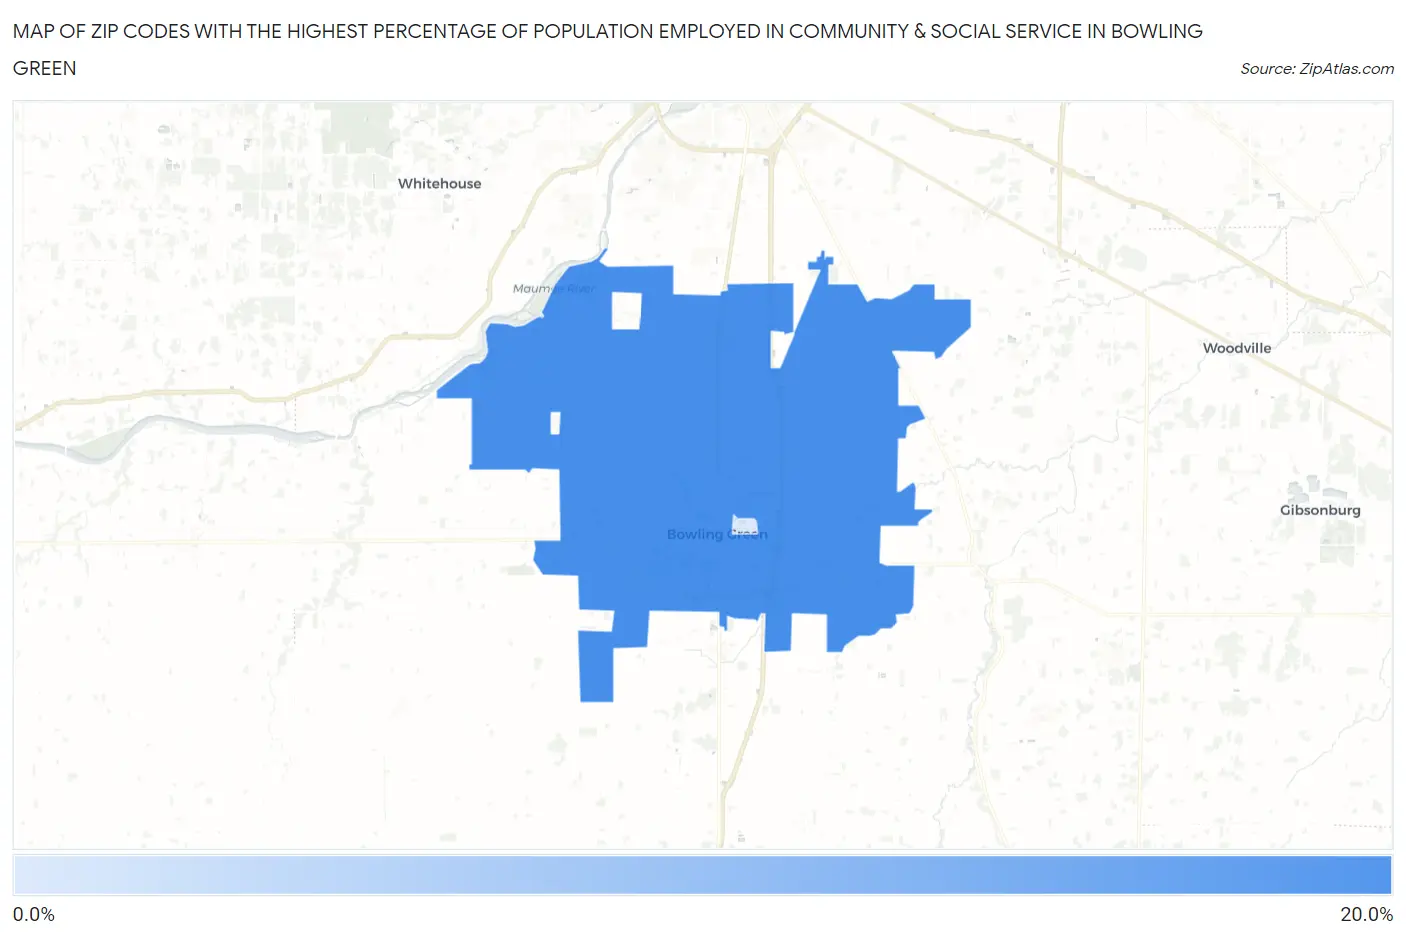
Map of Zip Codes with the Highest Percentage of Population Employed in Community & Social Service in Bowling Green
7.2%
17.7%
Zip Codes with the Highest Percentage of Population Employed in Community & Social Service in Bowling Green, OH
| Zip Code | % Employed | vs State | vs National | |
| 1. | 43402 | 17.7% | 10.0%(+7.79)#56 | 11.2%(+6.53)#2,948 |
| 2. | 43403 | 7.2% | 10.0%(-2.73)#673 | 11.2%(-3.99)#21,578 |
1
Common Questions
What are the Top Zip Codes with the Highest Percentage of Population Employed in Community & Social Service in Bowling Green, OH?
Top Zip Codes with the Highest Percentage of Population Employed in Community & Social Service in Bowling Green, OH are:
What zip code has the Highest Percentage of Population Employed in Community & Social Service in Bowling Green, OH?
43402 has the Highest Percentage of Population Employed in Community & Social Service in Bowling Green, OH with 17.7%.
What is the Percentage of Population Employed in Community & Social Service in Bowling Green, OH?
Percentage of Population Employed in Community & Social Service in Bowling Green is 17.0%.
What is the Percentage of Population Employed in Community & Social Service in Ohio?
Percentage of Population Employed in Community & Social Service in Ohio is 10.0%.
What is the Percentage of Population Employed in Community & Social Service in the United States?
Percentage of Population Employed in Community & Social Service in the United States is 11.2%.