Zip Codes with the Highest Percentage of Population Employed in Community & Social Service in Dayton, OH
RELATED REPORTS & OPTIONS
Community & Social Service
Dayton
Compare Zip Codes
Map of Zip Codes with the Highest Percentage of Population Employed in Community & Social Service in Dayton
3.5%
22.0%
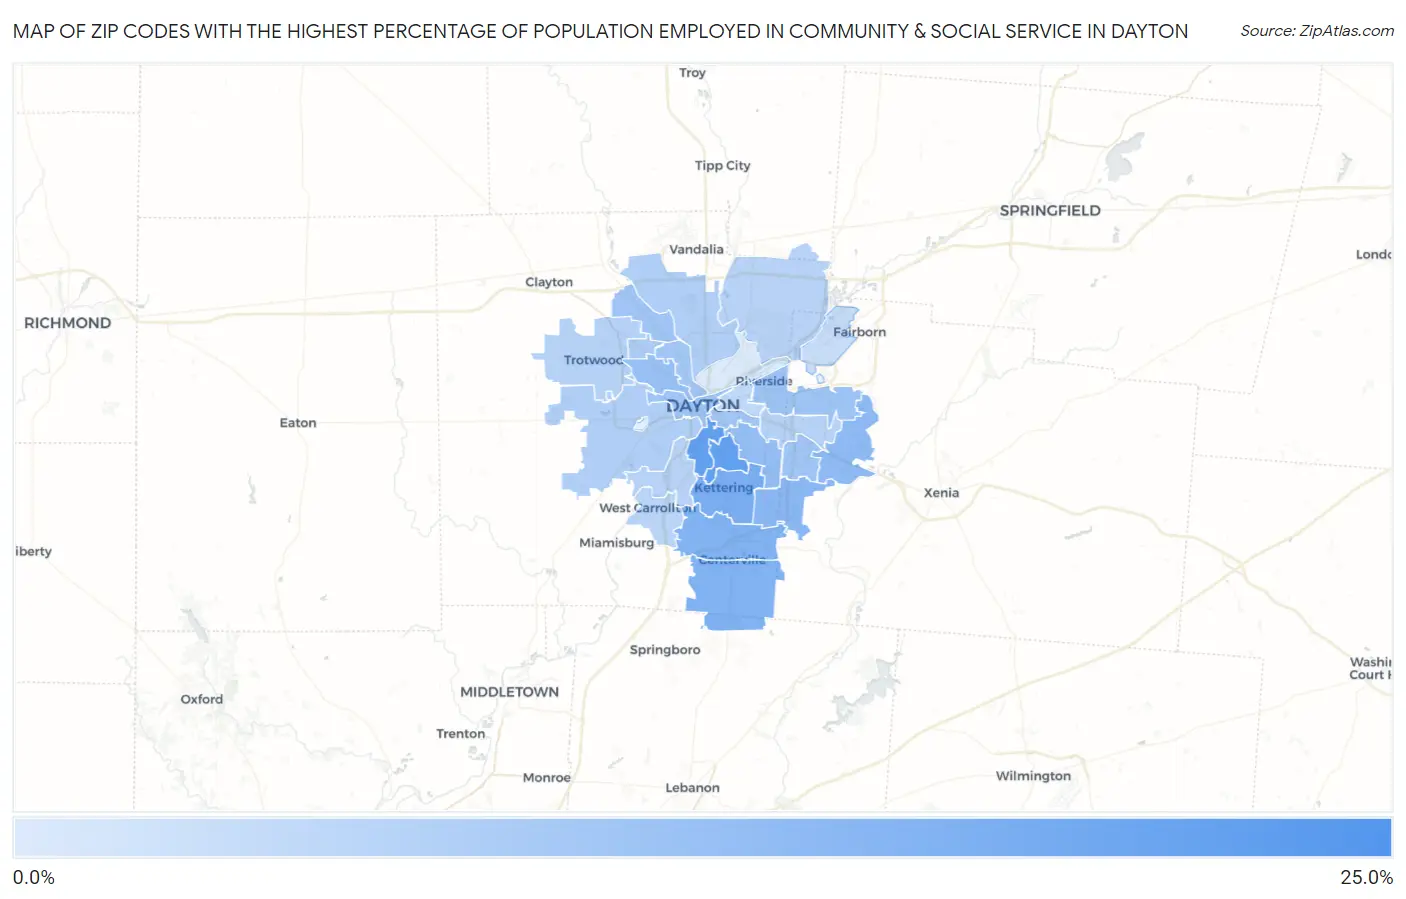
Zip Codes with the Highest Percentage of Population Employed in Community & Social Service in Dayton, OH
| Zip Code | % Employed | vs State | vs National | |
| 1. | 45469 | 22.0% | 10.0% (+12.1)#24 | 11.2% (+10.8)#1,476 |
| 2. | 45419 | 18.3% | 10.0% (+8.38)#51 | 11.2% (+7.12)#2,657 |
| 3. | 45409 | 18.3% | 10.0% (+8.32)#53 | 11.2% (+7.06)#2,684 |
| 4. | 45429 | 15.4% | 10.0% (+5.41)#99 | 11.2% (+4.15)#4,647 |
| 5. | 45458 | 14.6% | 10.0% (+4.64)#118 | 11.2% (+3.38)#5,371 |
| 6. | 45459 | 14.4% | 10.0% (+4.44)#120 | 11.2% (+3.18)#5,592 |
| 7. | 45440 | 13.3% | 10.0% (+3.32)#156 | 11.2% (+2.06)#7,119 |
| 8. | 45434 | 12.8% | 10.0% (+2.89)#174 | 11.2% (+1.63)#7,808 |
| 9. | 45420 | 12.1% | 10.0% (+2.18)#216 | 11.2% (+0.919)#9,087 |
| 10. | 45406 | 11.7% | 10.0% (+1.78)#244 | 11.2% (+0.521)#9,907 |
| 11. | 45431 | 10.8% | 10.0% (+0.858)#311 | 11.2% (-0.401)#12,084 |
| 12. | 45415 | 10.6% | 10.0% (+0.657)#326 | 11.2% (-0.602)#12,604 |
| 13. | 45430 | 10.6% | 10.0% (+0.604)#330 | 11.2% (-0.655)#12,729 |
| 14. | 45402 | 10.5% | 10.0% (+0.541)#333 | 11.2% (-0.718)#12,877 |
| 15. | 45410 | 10.4% | 10.0% (+0.430)#340 | 11.2% (-0.829)#13,155 |
| 16. | 45405 | 10.2% | 10.0% (+0.236)#357 | 11.2% (-1.02)#13,621 |
| 17. | 45416 | 9.3% | 10.0% (-0.682)#435 | 11.2% (-1.94)#16,066 |
| 18. | 45417 | 8.7% | 10.0% (-1.30)#493 | 11.2% (-2.55)#17,737 |
| 19. | 45414 | 8.6% | 10.0% (-1.31)#496 | 11.2% (-2.57)#17,772 |
| 20. | 45432 | 8.1% | 10.0% (-1.81)#556 | 11.2% (-3.07)#19,171 |
| 21. | 45426 | 8.0% | 10.0% (-1.99)#586 | 11.2% (-3.25)#19,652 |
| 22. | 45439 | 7.9% | 10.0% (-2.06)#598 | 11.2% (-3.32)#19,889 |
| 23. | 45424 | 7.7% | 10.0% (-2.31)#619 | 11.2% (-3.56)#20,503 |
| 24. | 45449 | 7.6% | 10.0% (-2.36)#625 | 11.2% (-3.62)#20,648 |
| 25. | 45403 | 6.9% | 10.0% (-3.05)#710 | 11.2% (-4.31)#22,374 |
| 26. | 45433 | 5.8% | 10.0% (-4.20)#846 | 11.2% (-5.46)#24,861 |
| 27. | 45404 | 3.5% | 10.0% (-6.47)#1,008 | 11.2% (-7.73)#28,110 |
1
Common Questions
What are the Top 10 Zip Codes with the Highest Percentage of Population Employed in Community & Social Service in Dayton, OH?
Top 10 Zip Codes with the Highest Percentage of Population Employed in Community & Social Service in Dayton, OH are:
What zip code has the Highest Percentage of Population Employed in Community & Social Service in Dayton, OH?
45469 has the Highest Percentage of Population Employed in Community & Social Service in Dayton, OH with 22.0%.
What is the Percentage of Population Employed in Community & Social Service in Dayton, OH?
Percentage of Population Employed in Community & Social Service in Dayton is 10.7%.
What is the Percentage of Population Employed in Community & Social Service in Ohio?
Percentage of Population Employed in Community & Social Service in Ohio is 10.0%.
What is the Percentage of Population Employed in Community & Social Service in the United States?
Percentage of Population Employed in Community & Social Service in the United States is 11.2%.