Zip Codes with the Highest Percentage of Population Employed in Community & Social Service in Santa Fe, NM

RELATED REPORTS & OPTIONS

Community & Social Service
Population
Families and Households
Female Fertility
Female Fertility (Unmarried)
Race (Community Size)
Race (Percentage)
Ancestry (Community Size)
AfricanAlaska NativeAlbanianAmericanApacheArabArgentineanArmenianAustralianAustrianBasqueBelgianBhutaneseBlackfeetBrazilianBritishBulgarianBurmeseCajunCanadianCelticCentral AmericanCentral American IndianCherokeeChickasawChileanChoctawColombianCreekCroatianCubanCzechCzechoslovakianDanishDominicanDutchEastern EuropeanEcuadorianEnglishEstonianEthiopianEuropeanFinnishFrenchFrench American IndianFrench CanadianGermanGreekGuamanian / ChamorroGuatemalanHonduranHopiHungarianIndian (Asian)InupiatIranianIrishIroquoisItalianJamaicanKoreanLaotianLatvianLebaneseLithuanianMacedonianMexicanMexican American IndianNative HawaiianNavajoNorthern EuropeanNorwegianPakistaniPennsylvania GermanPeruvianPolishPortuguesePuebloPuerto RicanRomanianRussianSalvadoranScandinavianScotch-IrishScottishSeminoleSerbianShoshoneSiouxSlavicSlovakSouth AmericanSpaniardSpanishSpanish AmericanSpanish American IndianSri LankanSubsaharan AfricanSwedishSwissThaiTurkishUkrainianUruguayanUteVenezuelanWelshYaquiYugoslavian
Ancestry (Percentage)
AfricanAlaska NativeAlbanianAmericanApacheArabArgentineanArmenianAustralianAustrianBasqueBelgianBhutaneseBlackfeetBrazilianBritishBulgarianBurmeseCajunCanadianCelticCentral AmericanCentral American IndianCherokeeChickasawChileanChoctawColombianCreekCroatianCubanCzechCzechoslovakianDanishDominicanDutchEastern EuropeanEcuadorianEnglishEstonianEthiopianEuropeanFinnishFrenchFrench American IndianFrench CanadianGermanGreekGuamanian / ChamorroGuatemalanHonduranHopiHungarianIndian (Asian)InupiatIranianIrishIroquoisItalianJamaicanKoreanLaotianLatvianLebaneseLithuanianMacedonianMexicanMexican American IndianNative HawaiianNavajoNorthern EuropeanNorwegianPakistaniPennsylvania GermanPeruvianPolishPortuguesePuebloPuerto RicanRomanianRussianSalvadoranScandinavianScotch-IrishScottishSeminoleSerbianShoshoneSiouxSlavicSlovakSouth AmericanSpaniardSpanishSpanish AmericanSpanish American IndianSri LankanSubsaharan AfricanSwedishSwissThaiTurkishUkrainianUruguayanUteVenezuelanWelshYaquiYugoslavian
Immigrant Origin (Total)
Immigrant Origin (Percentage)
Income
Income (Families)
Income (Households)
Poverty
Poverty (Families)
Unemployment
Employment Occupations
Employment Industries
Employer Class
Commute Time
Commute Means
School Enrollment
Education by Degree Field
Occupancy
Finances
Physical Characteristics
Santa Fe
Compare Zip Codes
Comparison Subject

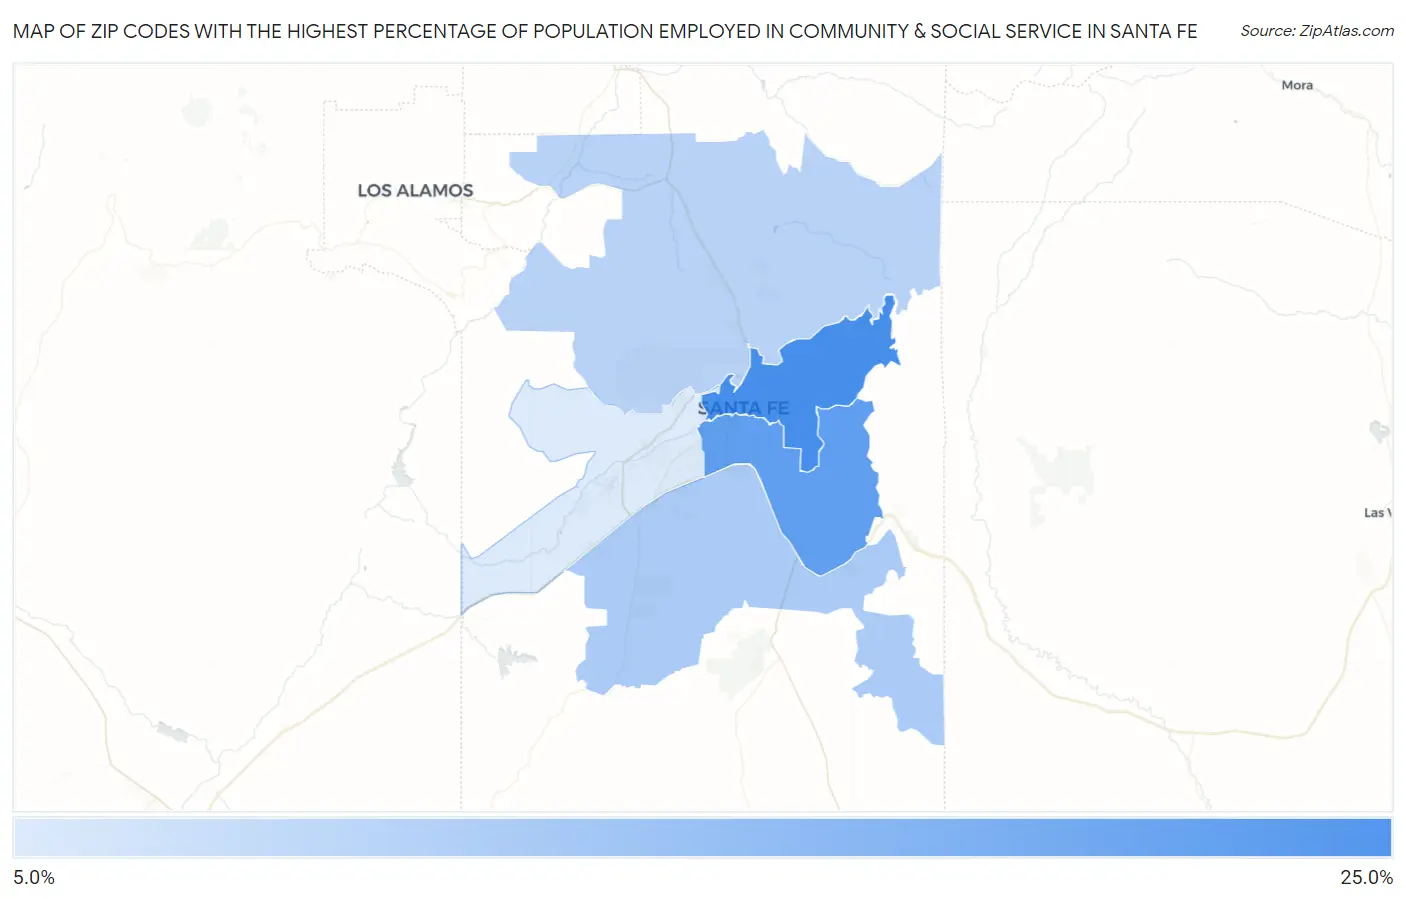
Map of Zip Codes with the Highest Percentage of Population Employed in Community & Social Service in Santa Fe

0.0%
25.0%
Zip Codes with the Highest Percentage of Population Employed in Community & Social Service  in Santa Fe Map

Zip Codes with the Highest Percentage of Population Employed in Community & Social Service in Santa Fe, NM

Zip Code % Employed vs State vs National
1.8750123.2%12.3%(+10.9)#4011.2%(+12.0)#1,248
2.8750520.6%12.3%(+8.39)#4711.2%(+9.43)#1,825
3.8750814.0%12.3%(+1.73)#9411.2%(+2.78)#6,096
4.8750612.6%12.3%(+0.373)#11411.2%(+1.42)#8,190
5.875079.5%12.3%(-2.74)#16611.2%(-1.70)#15,375

Common Questions

What are the Top 3 Zip Codes with the Highest Percentage of Population Employed in Community & Social Service in Santa Fe, NM?
Top 3 Zip Codes with the Highest Percentage of Population Employed in Community & Social Service in Santa Fe, NM are:
#1
23.2%
#2
20.6%
#3
14.0%
What zip code has the Highest Percentage of Population Employed in Community & Social Service in Santa Fe, NM?
87501 has the Highest Percentage of Population Employed in Community & Social Service in Santa Fe, NM with 23.2%.
What is the Percentage of Population Employed in Community & Social Service in Santa Fe, NM?
Percentage of Population Employed in Community & Social Service in Santa Fe is 15.9%.
What is the Percentage of Population Employed in Community & Social Service in New Mexico?
Percentage of Population Employed in Community & Social Service in New Mexico is 12.3%.
What is the Percentage of Population Employed in Community & Social Service in the United States?
Percentage of Population Employed in Community & Social Service in the United States is 11.2%.