Zip Codes with the Highest Percentage of Population Employed in Agriculture, Fishing & Hunting in Santa Fe, NM
RELATED REPORTS & OPTIONS
Agriculture, Fishing & Hunting
Santa Fe
Compare Zip Codes
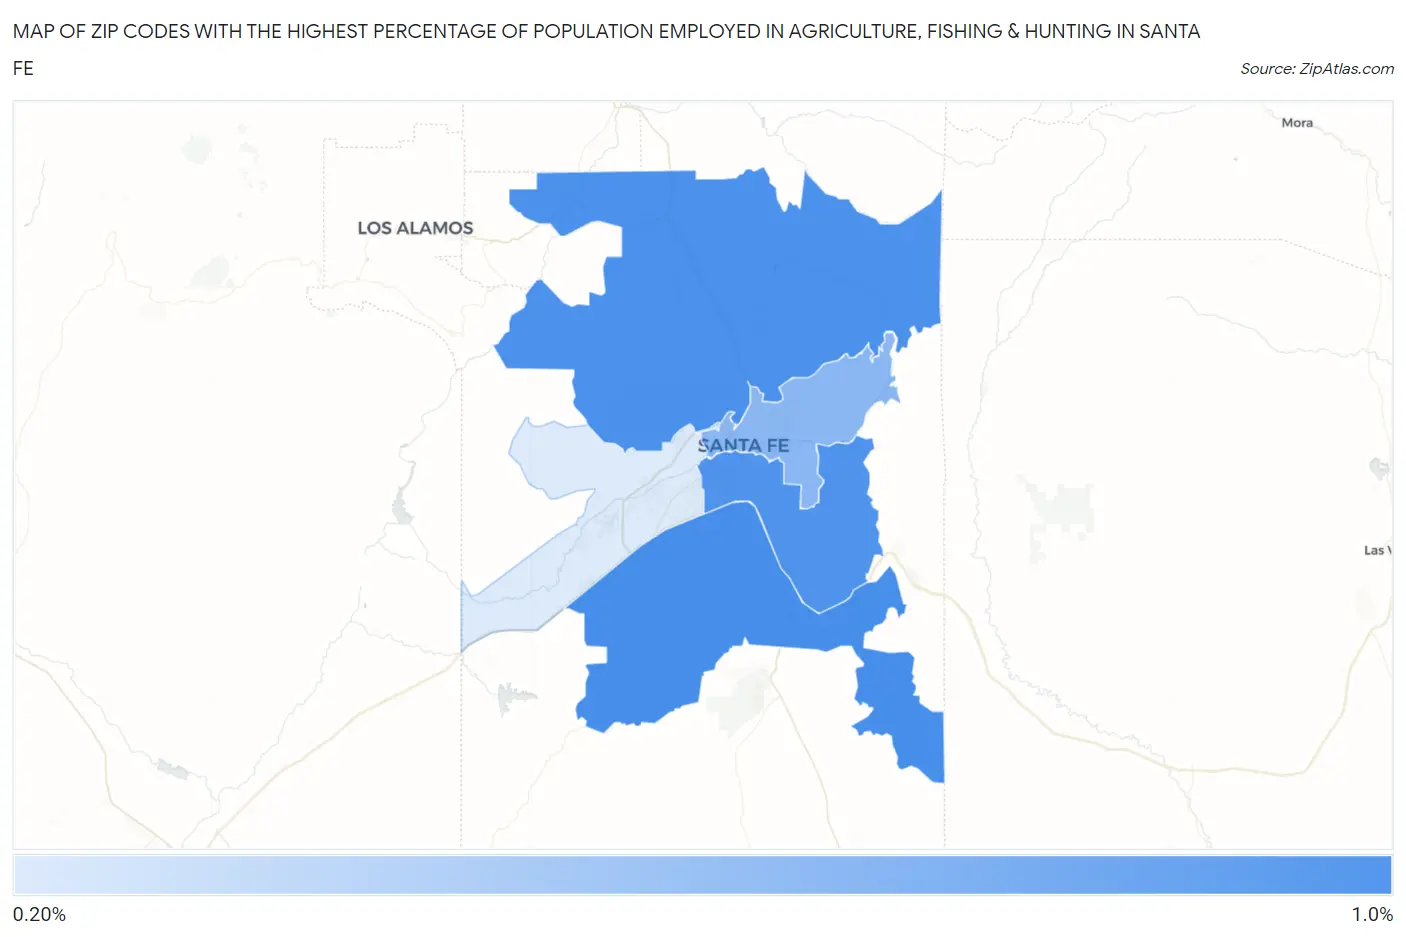
Map of Zip Codes with the Highest Percentage of Population Employed in Agriculture, Fishing & Hunting in Santa Fe
0.24%
0.95%
Zip Codes with the Highest Percentage of Population Employed in Agriculture, Fishing & Hunting in Santa Fe, NM
| Zip Code | % Employed | vs State | vs National | |
| 1. | 87508 | 0.95% | 2.0%(-1.01)#173 | 1.2%(-0.253)#16,465 |
| 2. | 87506 | 0.92% | 2.0%(-1.04)#175 | 1.2%(-0.279)#16,611 |
| 3. | 87505 | 0.90% | 2.0%(-1.05)#177 | 1.2%(-0.294)#16,682 |
| 4. | 87501 | 0.63% | 2.0%(-1.32)#190 | 1.2%(-0.566)#18,249 |
| 5. | 87507 | 0.24% | 2.0%(-1.72)#209 | 1.2%(-0.960)#21,895 |
1
Common Questions
What are the Top 3 Zip Codes with the Highest Percentage of Population Employed in Agriculture, Fishing & Hunting in Santa Fe, NM?
Top 3 Zip Codes with the Highest Percentage of Population Employed in Agriculture, Fishing & Hunting in Santa Fe, NM are:
What zip code has the Highest Percentage of Population Employed in Agriculture, Fishing & Hunting in Santa Fe, NM?
87508 has the Highest Percentage of Population Employed in Agriculture, Fishing & Hunting in Santa Fe, NM with 0.95%.
What is the Percentage of Population Employed in Agriculture, Fishing & Hunting in Santa Fe, NM?
Percentage of Population Employed in Agriculture, Fishing & Hunting in Santa Fe is 0.51%.
What is the Percentage of Population Employed in Agriculture, Fishing & Hunting in New Mexico?
Percentage of Population Employed in Agriculture, Fishing & Hunting in New Mexico is 2.0%.
What is the Percentage of Population Employed in Agriculture, Fishing & Hunting in the United States?
Percentage of Population Employed in Agriculture, Fishing & Hunting in the United States is 1.2%.