Zip Codes with the Highest Percentage of Population Employed in Legal Services & Support in Santa Fe, NM
RELATED REPORTS & OPTIONS
Legal Services & Support
Santa Fe
Compare Zip Codes
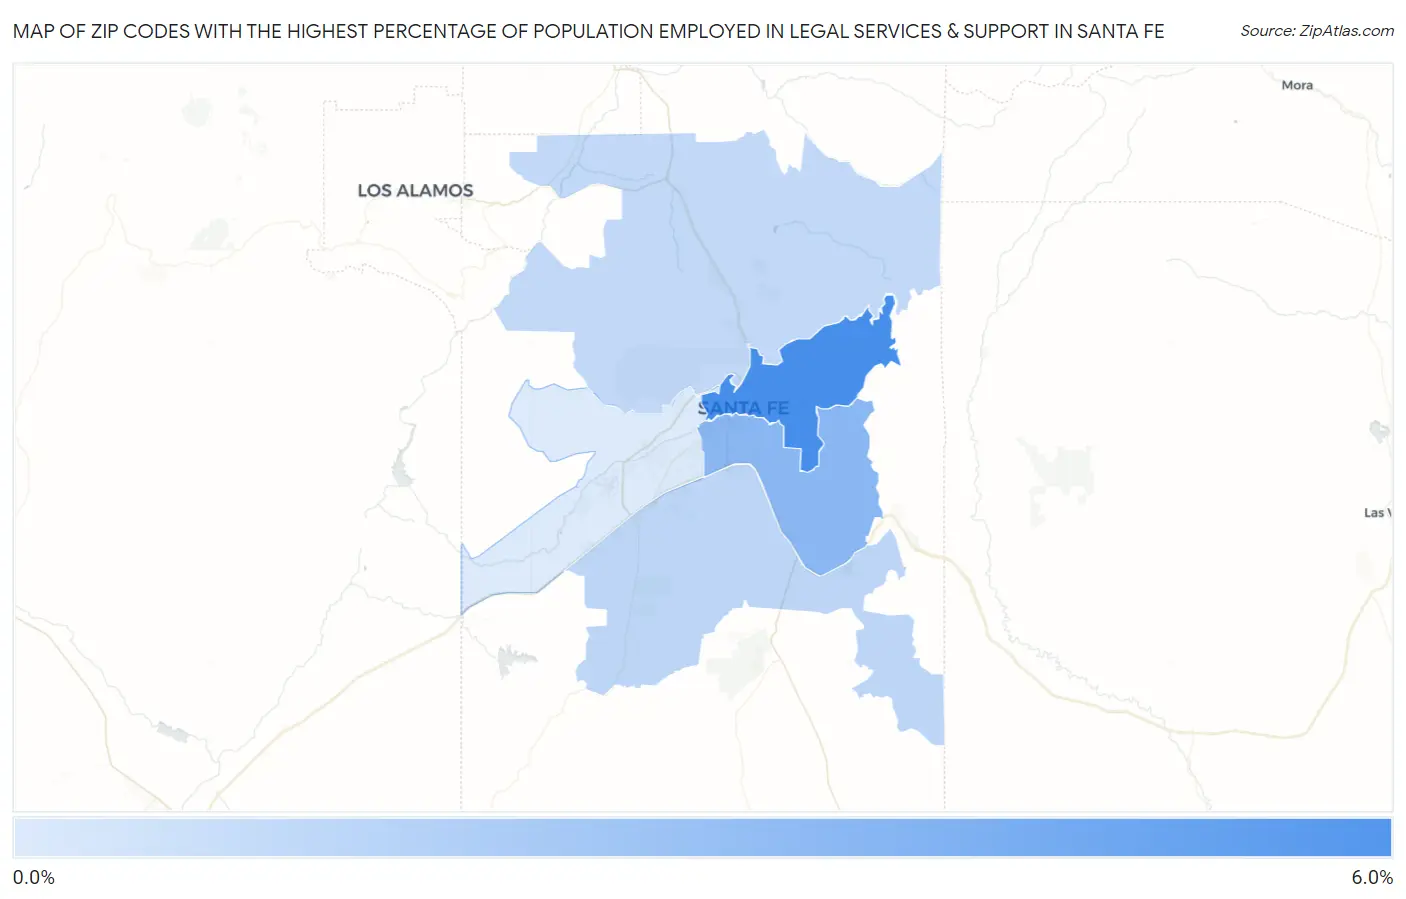
Map of Zip Codes with the Highest Percentage of Population Employed in Legal Services & Support in Santa Fe
0.94%
5.1%
Zip Codes with the Highest Percentage of Population Employed in Legal Services & Support in Santa Fe, NM
| Zip Code | % Employed | vs State | vs National | |
| 1. | 87501 | 5.1% | 1.3%(+3.78)#8 | 1.2%(+3.91)#695 |
| 2. | 87505 | 3.2% | 1.3%(+1.90)#14 | 1.2%(+2.03)#1,641 |
| 3. | 87508 | 1.8% | 1.3%(+0.504)#40 | 1.2%(+0.631)#3,964 |
| 4. | 87506 | 1.7% | 1.3%(+0.361)#44 | 1.2%(+0.487)#4,419 |
| 5. | 87507 | 0.94% | 1.3%(-0.367)#71 | 1.2%(-0.240)#8,249 |
1
Common Questions
What are the Top 3 Zip Codes with the Highest Percentage of Population Employed in Legal Services & Support in Santa Fe, NM?
Top 3 Zip Codes with the Highest Percentage of Population Employed in Legal Services & Support in Santa Fe, NM are:
What zip code has the Highest Percentage of Population Employed in Legal Services & Support in Santa Fe, NM?
87501 has the Highest Percentage of Population Employed in Legal Services & Support in Santa Fe, NM with 5.1%.
What is the Percentage of Population Employed in Legal Services & Support in Santa Fe, NM?
Percentage of Population Employed in Legal Services & Support in Santa Fe is 2.4%.
What is the Percentage of Population Employed in Legal Services & Support in New Mexico?
Percentage of Population Employed in Legal Services & Support in New Mexico is 1.3%.
What is the Percentage of Population Employed in Legal Services & Support in the United States?
Percentage of Population Employed in Legal Services & Support in the United States is 1.2%.