Zip Codes with the Highest Percentage of Population with a Degree in Liberal Arts and History in Hobbs, NM
RELATED REPORTS & OPTIONS
Liberal Arts and History
Hobbs
Compare Zip Codes
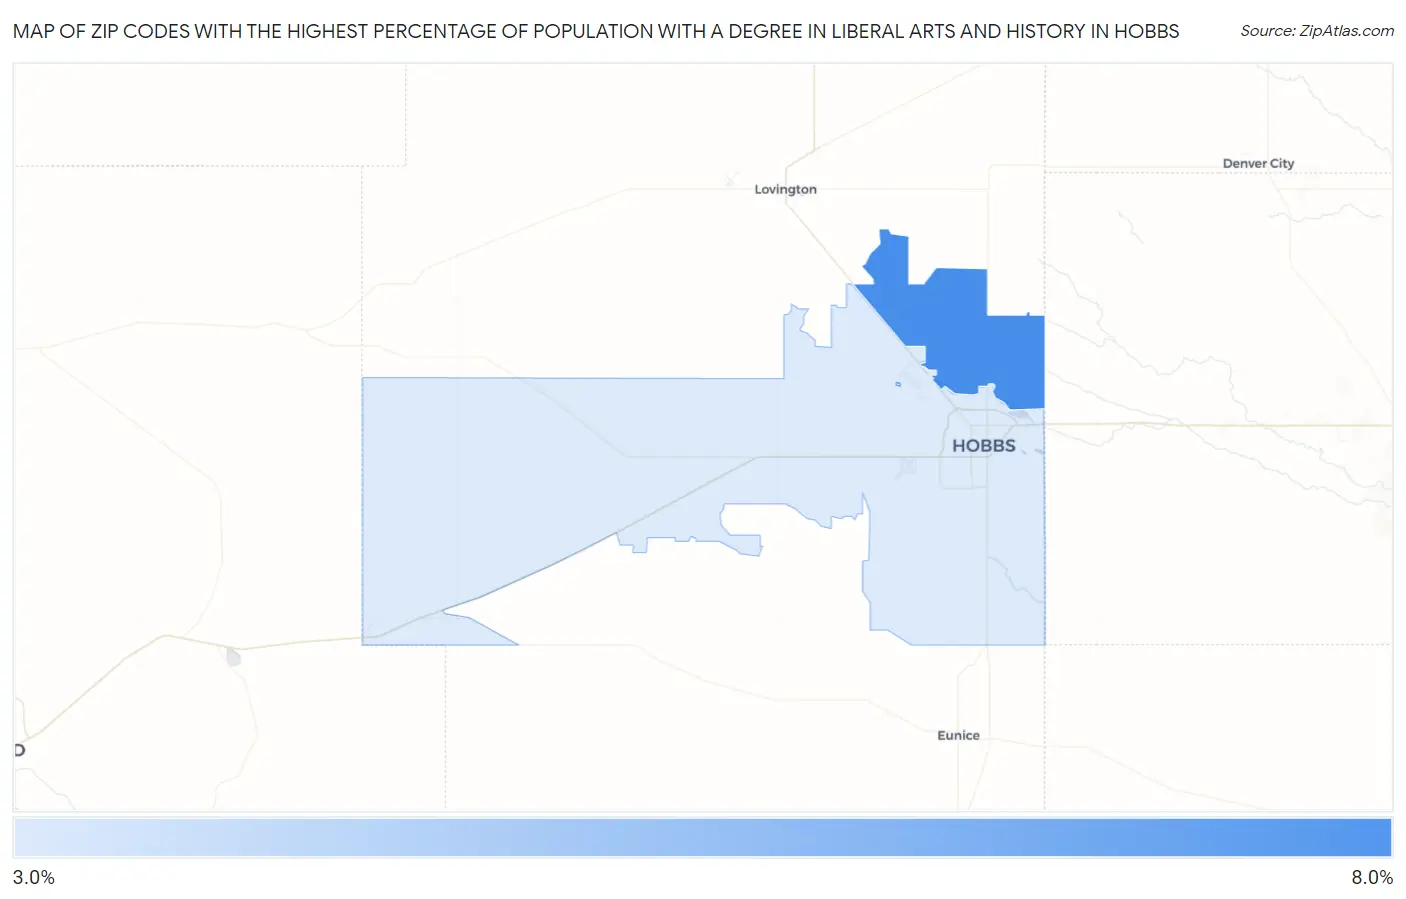
Map of Zip Codes with the Highest Percentage of Population with a Degree in Liberal Arts and History in Hobbs
3.5%
6.4%
Zip Codes with the Highest Percentage of Population with a Degree in Liberal Arts and History in Hobbs, NM
| Zip Code | % Graduates | vs State | vs National | |
| 1. | 88242 | 6.4% | 5.5%(+0.894)#65 | 4.9%(+1.48)#7,662 |
| 2. | 88240 | 3.5% | 5.5%(-1.95)#131 | 4.9%(-1.37)#16,588 |
1
Common Questions
What are the Top Zip Codes with the Highest Percentage of Population with a Degree in Liberal Arts and History in Hobbs, NM?
Top Zip Codes with the Highest Percentage of Population with a Degree in Liberal Arts and History in Hobbs, NM are:
What zip code has the Highest Percentage of Population with a Degree in Liberal Arts and History in Hobbs, NM?
88242 has the Highest Percentage of Population with a Degree in Liberal Arts and History in Hobbs, NM with 6.4%.
What is the Percentage of Population with a Degree in Liberal Arts and History in Hobbs, NM?
Percentage of Population with a Degree in Liberal Arts and History in Hobbs is 3.3%.
What is the Percentage of Population with a Degree in Liberal Arts and History in New Mexico?
Percentage of Population with a Degree in Liberal Arts and History in New Mexico is 5.5%.
What is the Percentage of Population with a Degree in Liberal Arts and History in the United States?
Percentage of Population with a Degree in Liberal Arts and History in the United States is 4.9%.