Zip Codes with the Highest Percentage of Population Employed in Legal Services & Support in Farmington, NM
RELATED REPORTS & OPTIONS
Legal Services & Support
Farmington
Compare Zip Codes
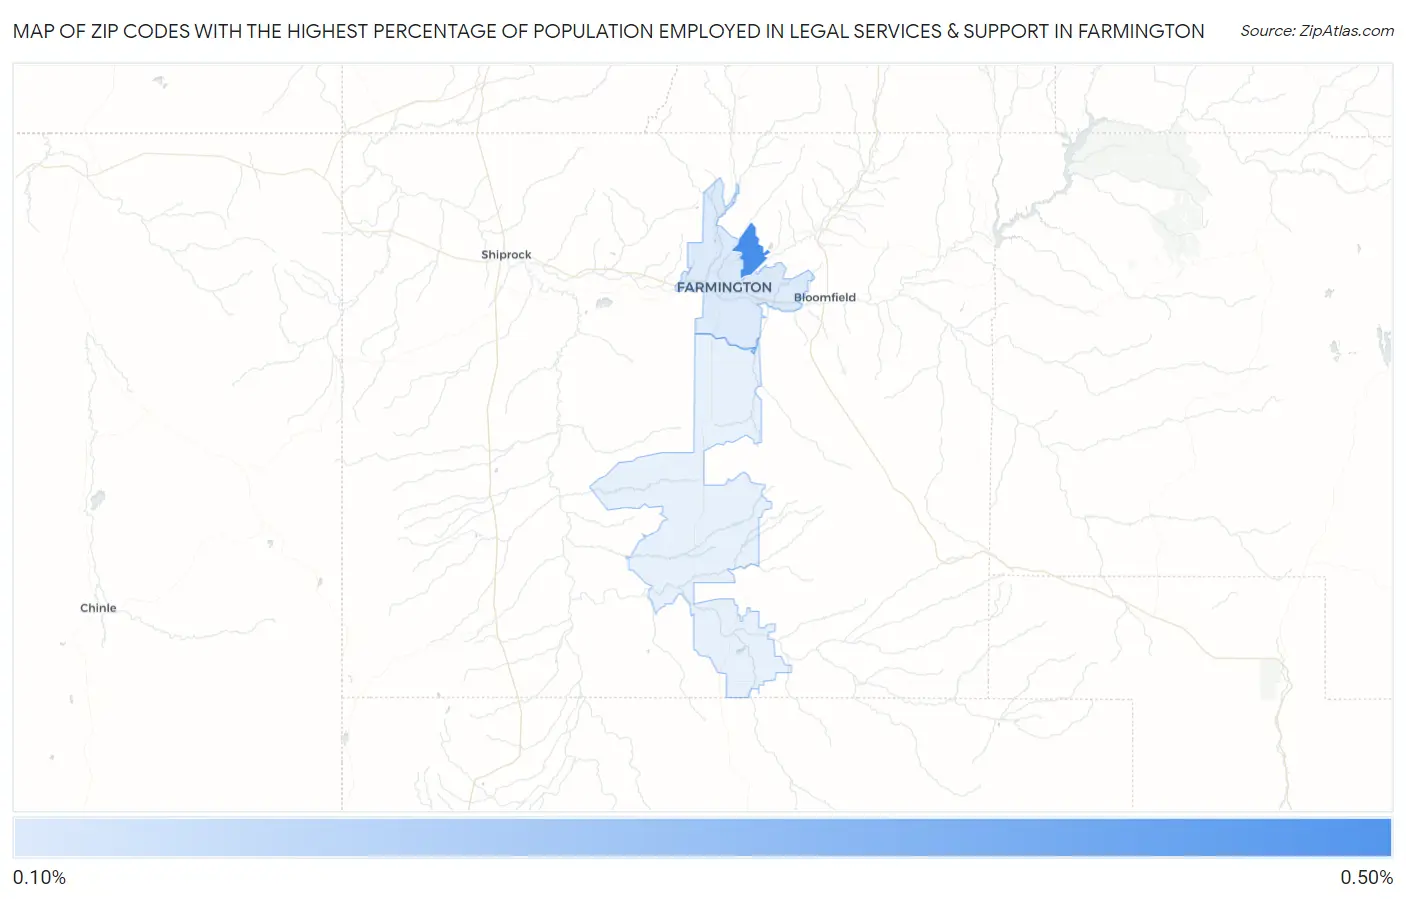
Map of Zip Codes with the Highest Percentage of Population Employed in Legal Services & Support in Farmington
0.17%
0.47%
Zip Codes with the Highest Percentage of Population Employed in Legal Services & Support in Farmington, NM
| Zip Code | % Employed | vs State | vs National | |
| 1. | 87402 | 0.47% | 1.3%(-0.840)#91 | 1.2%(-0.713)#13,001 |
| 2. | 87401 | 0.17% | 1.3%(-1.15)#106 | 1.2%(-1.02)#16,538 |
1
Common Questions
What are the Top Zip Codes with the Highest Percentage of Population Employed in Legal Services & Support in Farmington, NM?
Top Zip Codes with the Highest Percentage of Population Employed in Legal Services & Support in Farmington, NM are:
What zip code has the Highest Percentage of Population Employed in Legal Services & Support in Farmington, NM?
87402 has the Highest Percentage of Population Employed in Legal Services & Support in Farmington, NM with 0.47%.
What is the Percentage of Population Employed in Legal Services & Support in Farmington, NM?
Percentage of Population Employed in Legal Services & Support in Farmington is 0.21%.
What is the Percentage of Population Employed in Legal Services & Support in New Mexico?
Percentage of Population Employed in Legal Services & Support in New Mexico is 1.3%.
What is the Percentage of Population Employed in Legal Services & Support in the United States?
Percentage of Population Employed in Legal Services & Support in the United States is 1.2%.