Zip Codes with the Highest Percentage of Population Employed in Installation, Maintenance & Repair in Burlington, NC
RELATED REPORTS & OPTIONS
Installation, Maintenance & Repair
Burlington
Compare Zip Codes
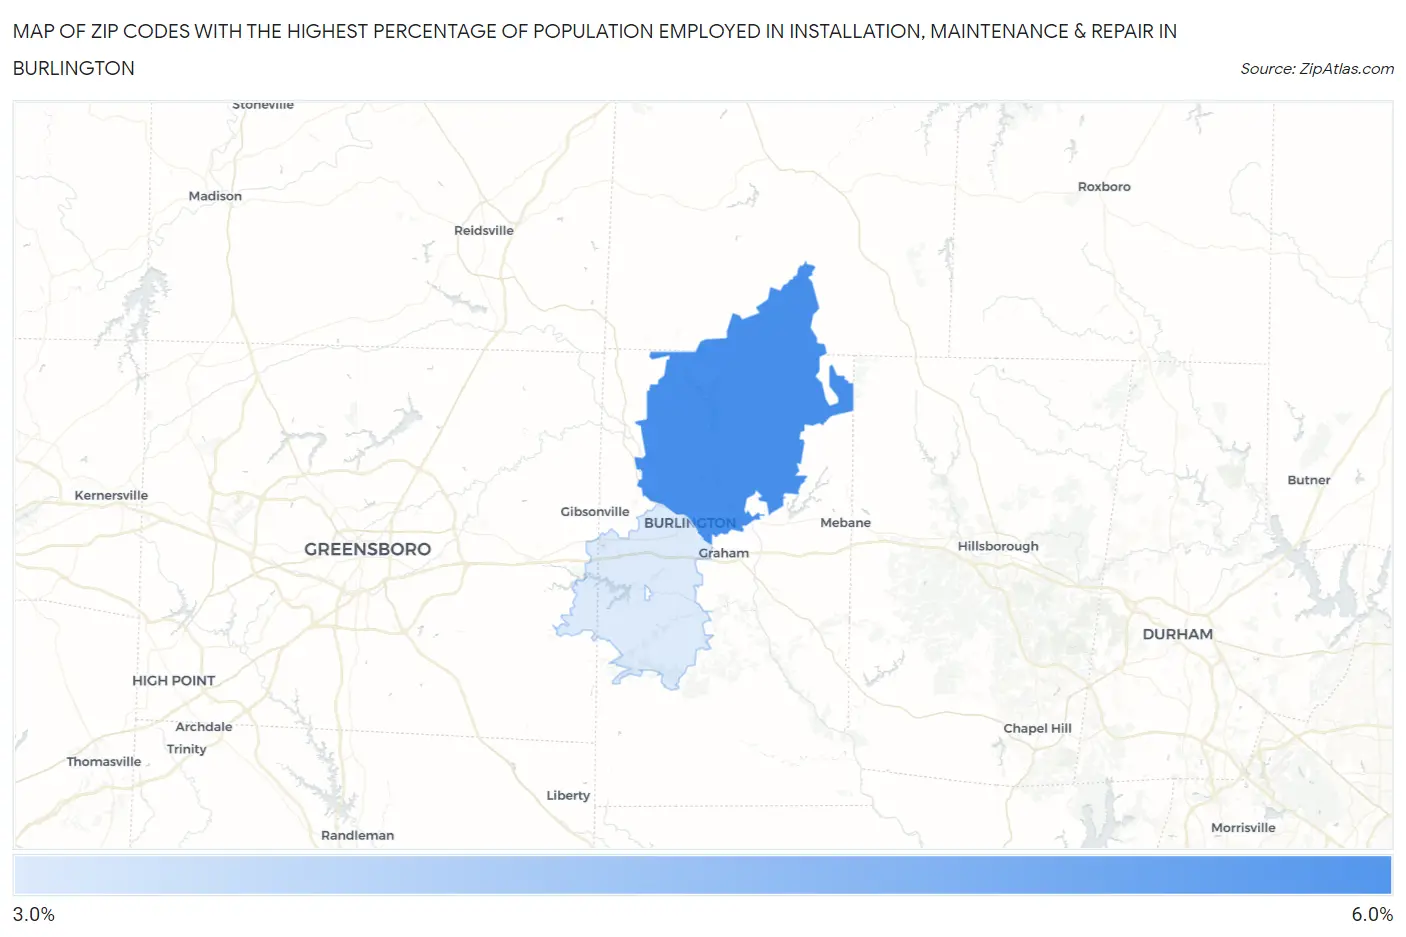
Map of Zip Codes with the Highest Percentage of Population Employed in Installation, Maintenance & Repair in Burlington
3.2%
5.7%
Zip Codes with the Highest Percentage of Population Employed in Installation, Maintenance & Repair in Burlington, NC
| Zip Code | % Employed | vs State | vs National | |
| 1. | 27217 | 5.7% | 3.4%(+2.24)#185 | 3.1%(+2.58)#6,893 |
| 2. | 27215 | 3.2% | 3.4%(-0.239)#433 | 3.1%(+0.102)#16,181 |
1
Common Questions
What are the Top Zip Codes with the Highest Percentage of Population Employed in Installation, Maintenance & Repair in Burlington, NC?
Top Zip Codes with the Highest Percentage of Population Employed in Installation, Maintenance & Repair in Burlington, NC are:
What zip code has the Highest Percentage of Population Employed in Installation, Maintenance & Repair in Burlington, NC?
27217 has the Highest Percentage of Population Employed in Installation, Maintenance & Repair in Burlington, NC with 5.7%.
What is the Percentage of Population Employed in Installation, Maintenance & Repair in Burlington, NC?
Percentage of Population Employed in Installation, Maintenance & Repair in Burlington is 2.8%.
What is the Percentage of Population Employed in Installation, Maintenance & Repair in North Carolina?
Percentage of Population Employed in Installation, Maintenance & Repair in North Carolina is 3.4%.
What is the Percentage of Population Employed in Installation, Maintenance & Repair in the United States?
Percentage of Population Employed in Installation, Maintenance & Repair in the United States is 3.1%.