Zip Codes with the Highest Percentage of Population Employed in Architecture & Engineering in Burlington, NC
RELATED REPORTS & OPTIONS
Architecture & Engineering
Burlington
Compare Zip Codes
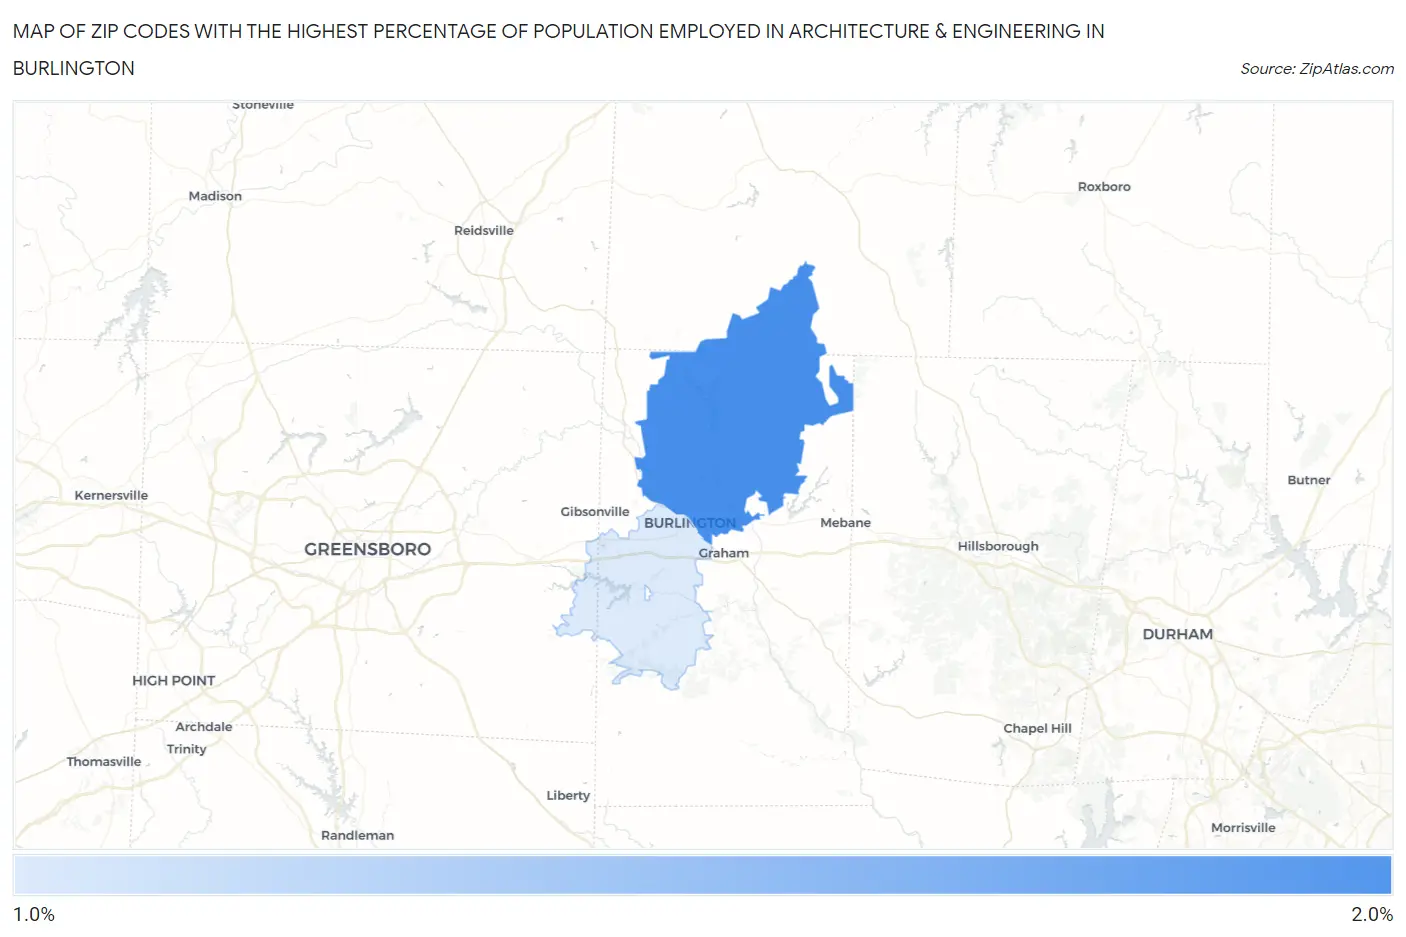
Map of Zip Codes with the Highest Percentage of Population Employed in Architecture & Engineering in Burlington
1.5%
1.6%
Zip Codes with the Highest Percentage of Population Employed in Architecture & Engineering in Burlington, NC
| Zip Code | % Employed | vs State | vs National | |
| 1. | 27217 | 1.6% | 1.9%(-0.305)#293 | 2.1%(-0.566)#12,286 |
| 2. | 27215 | 1.5% | 1.9%(-0.430)#320 | 2.1%(-0.690)#13,171 |
1
Common Questions
What are the Top Zip Codes with the Highest Percentage of Population Employed in Architecture & Engineering in Burlington, NC?
Top Zip Codes with the Highest Percentage of Population Employed in Architecture & Engineering in Burlington, NC are:
What zip code has the Highest Percentage of Population Employed in Architecture & Engineering in Burlington, NC?
27217 has the Highest Percentage of Population Employed in Architecture & Engineering in Burlington, NC with 1.6%.
What is the Percentage of Population Employed in Architecture & Engineering in Burlington, NC?
Percentage of Population Employed in Architecture & Engineering in Burlington is 1.4%.
What is the Percentage of Population Employed in Architecture & Engineering in North Carolina?
Percentage of Population Employed in Architecture & Engineering in North Carolina is 1.9%.
What is the Percentage of Population Employed in Architecture & Engineering in the United States?
Percentage of Population Employed in Architecture & Engineering in the United States is 2.1%.