Zip Codes with the Highest Percentage of Population with a Degree in Visual and Performing Arts in Burlington, NC
RELATED REPORTS & OPTIONS
Visual and Performing Arts
Burlington
Compare Zip Codes
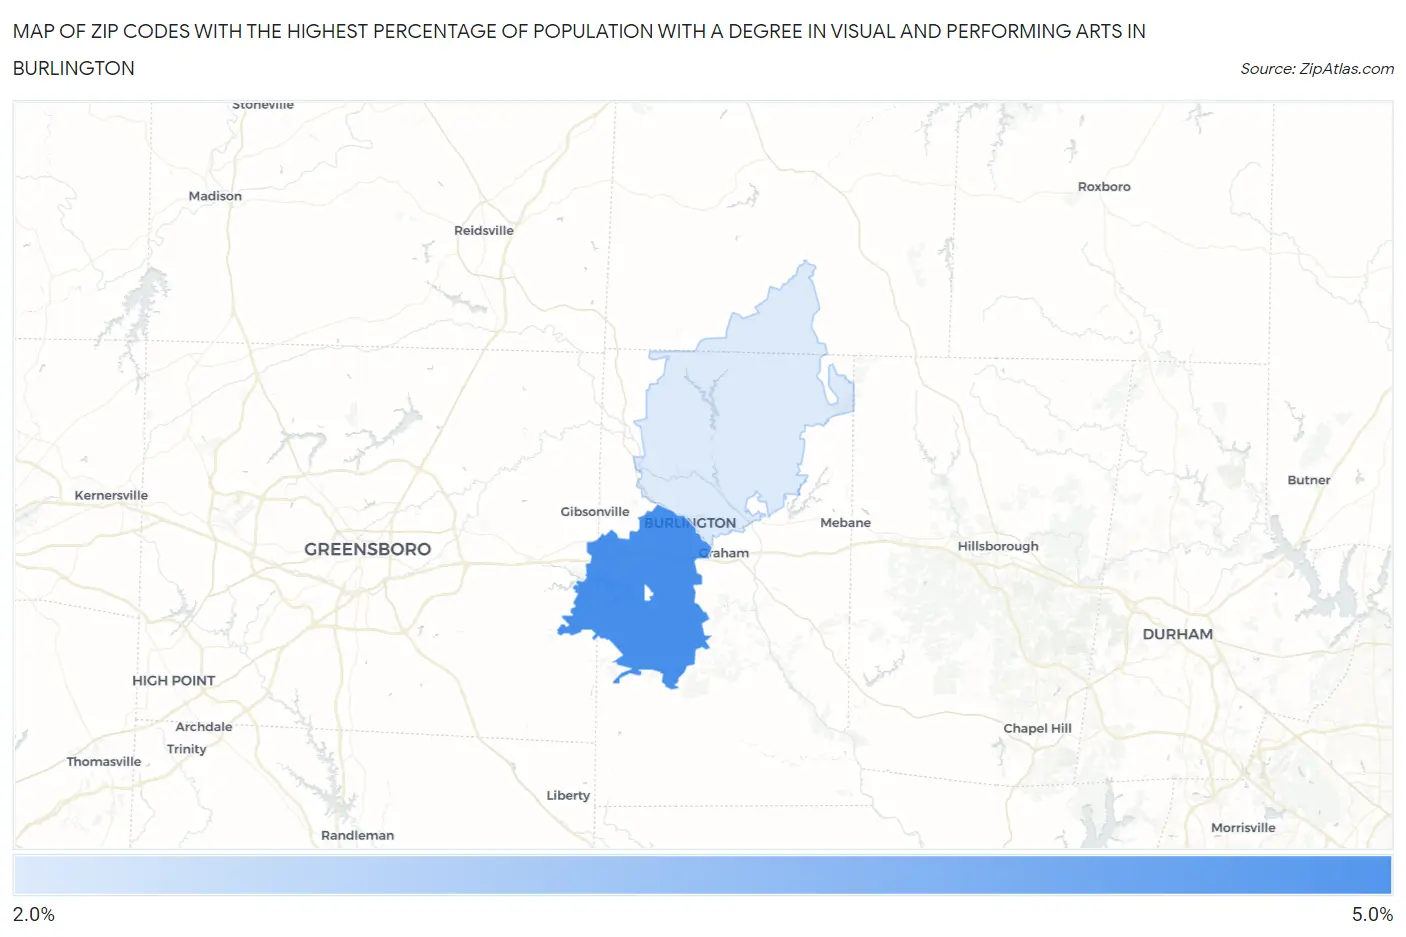
Map of Zip Codes with the Highest Percentage of Population with a Degree in Visual and Performing Arts in Burlington
2.8%
4.7%
Zip Codes with the Highest Percentage of Population with a Degree in Visual and Performing Arts in Burlington, NC
| Zip Code | % Graduates | vs State | vs National | |
| 1. | 27215 | 4.7% | 3.6%(+1.05)#180 | 4.3%(+0.421)#7,359 |
| 2. | 27217 | 2.8% | 3.6%(-0.817)#348 | 4.3%(-1.45)#13,483 |
1
Common Questions
What are the Top Zip Codes with the Highest Percentage of Population with a Degree in Visual and Performing Arts in Burlington, NC?
Top Zip Codes with the Highest Percentage of Population with a Degree in Visual and Performing Arts in Burlington, NC are:
What zip code has the Highest Percentage of Population with a Degree in Visual and Performing Arts in Burlington, NC?
27215 has the Highest Percentage of Population with a Degree in Visual and Performing Arts in Burlington, NC with 4.7%.
What is the Percentage of Population with a Degree in Visual and Performing Arts in Burlington, NC?
Percentage of Population with a Degree in Visual and Performing Arts in Burlington is 5.1%.
What is the Percentage of Population with a Degree in Visual and Performing Arts in North Carolina?
Percentage of Population with a Degree in Visual and Performing Arts in North Carolina is 3.6%.
What is the Percentage of Population with a Degree in Visual and Performing Arts in the United States?
Percentage of Population with a Degree in Visual and Performing Arts in the United States is 4.3%.