Zip Codes with the Highest Percentage of Population Taking Taxi / Cab to Work in Inver Grove Heights, MN
RELATED REPORTS & OPTIONS
Taxi / Cab
Inver Grove Heights
Compare Zip Codes
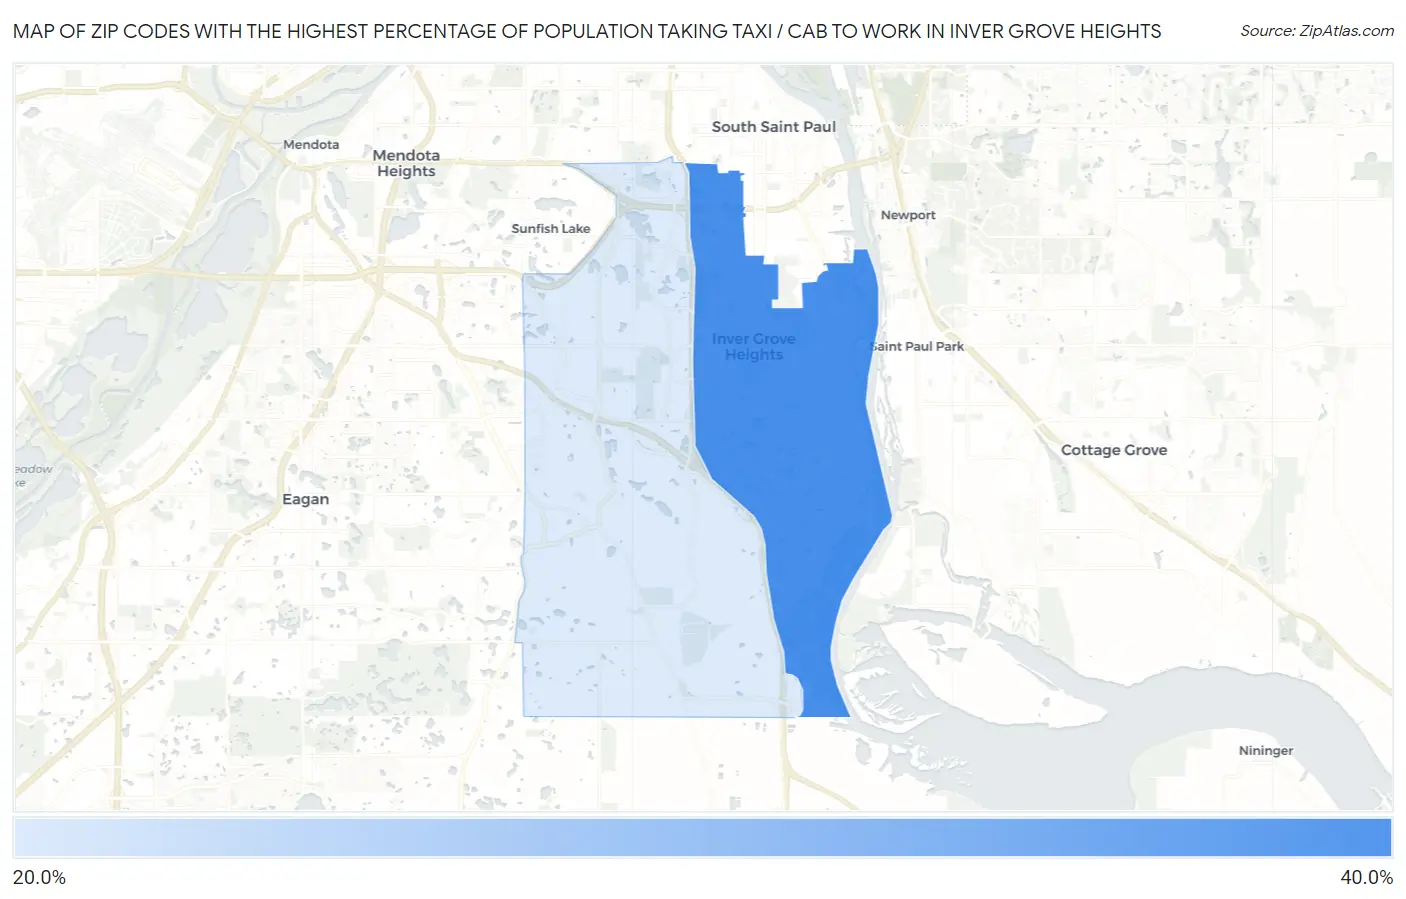
Map of Zip Codes with the Highest Percentage of Population Taking Taxi / Cab to Work in Inver Grove Heights
24.2%
35.4%
Zip Codes with the Highest Percentage of Population Taking Taxi / Cab to Work in Inver Grove Heights, MN
| Zip Code | % Take Taxi / Cab | vs State | vs National | |
| 1. | 55076 | 35.4% | 38.3%(-2.90)#338 | 38.2%(-2.80)#8,739 |
| 2. | 55077 | 24.2% | 38.3%(-14.1)#436 | 38.2%(-14.0)#12,416 |
1
Common Questions
What are the Top Zip Codes with the Highest Percentage of Population Taking Taxi / Cab to Work in Inver Grove Heights, MN?
Top Zip Codes with the Highest Percentage of Population Taking Taxi / Cab to Work in Inver Grove Heights, MN are:
What zip code has the Highest Percentage of Population Taking Taxi / Cab to Work in Inver Grove Heights, MN?
55076 has the Highest Percentage of Population Taking Taxi / Cab to Work in Inver Grove Heights, MN with 35.4%.
What is the Percentage of Population Taking Taxi / Cab to Work in Inver Grove Heights, MN?
Percentage of Population Taking Taxi / Cab to Work in Inver Grove Heights is 24.5%.
What is the Percentage of Population Taking Taxi / Cab to Work in Minnesota?
Percentage of Population Taking Taxi / Cab to Work in Minnesota is 38.3%.
What is the Percentage of Population Taking Taxi / Cab to Work in the United States?
Percentage of Population Taking Taxi / Cab to Work in the United States is 38.2%.