Zip Codes with the Highest Percentage of Population Employed in Agriculture, Fishing & Hunting in Inver Grove Heights, MN
RELATED REPORTS & OPTIONS
Agriculture, Fishing & Hunting
Inver Grove Heights
Compare Zip Codes
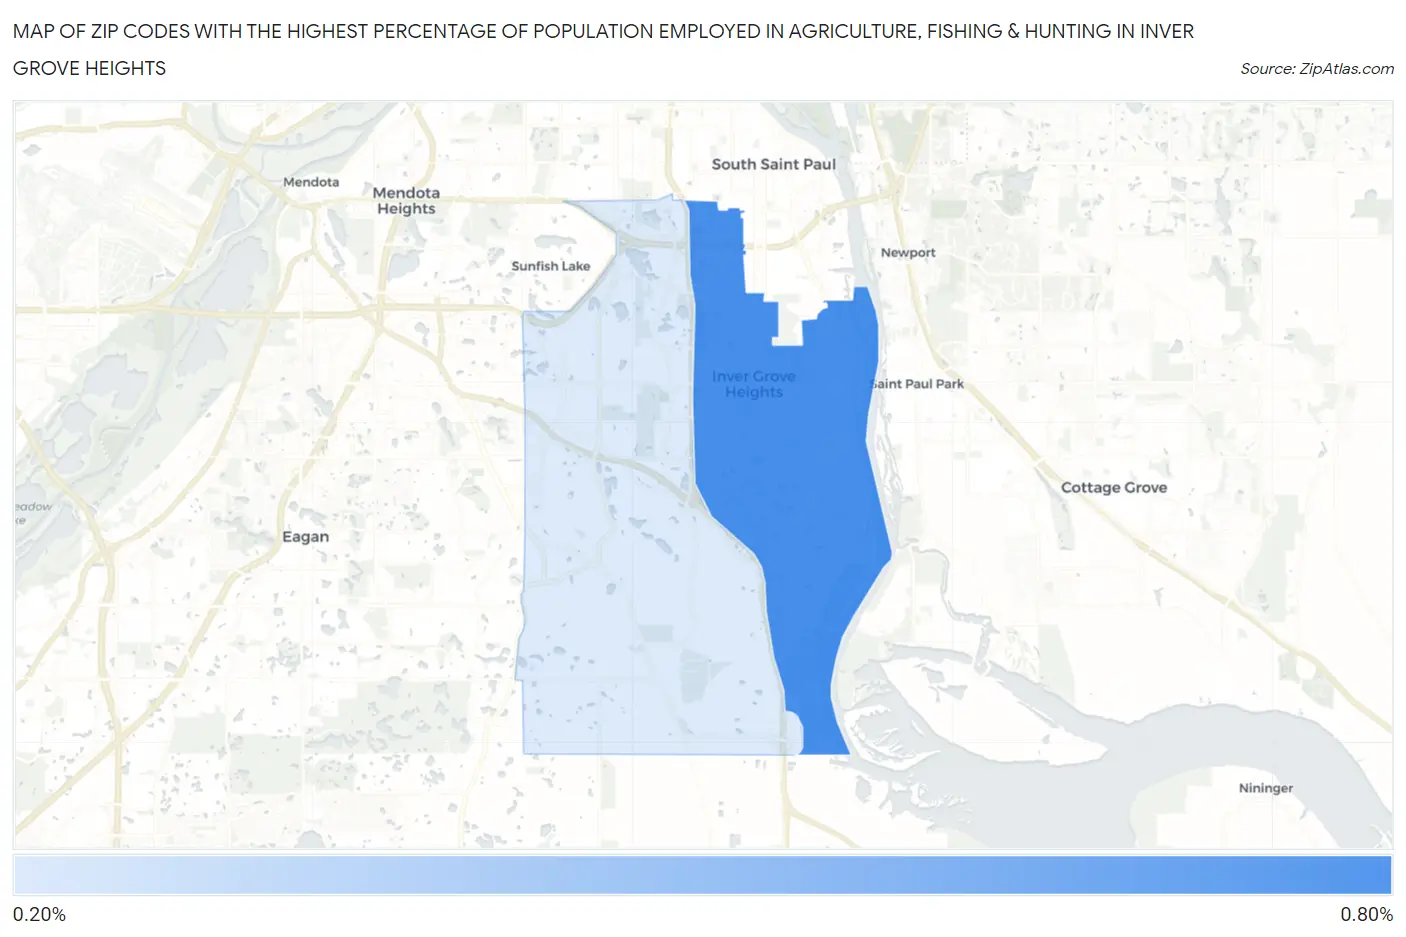
Map of Zip Codes with the Highest Percentage of Population Employed in Agriculture, Fishing & Hunting in Inver Grove Heights
0.30%
0.74%
Zip Codes with the Highest Percentage of Population Employed in Agriculture, Fishing & Hunting in Inver Grove Heights, MN
| Zip Code | % Employed | vs State | vs National | |
| 1. | 55076 | 0.74% | 1.9%(-1.15)#691 | 1.2%(-0.462)#17,615 |
| 2. | 55077 | 0.30% | 1.9%(-1.60)#777 | 1.2%(-0.903)#21,212 |
1
Common Questions
What are the Top Zip Codes with the Highest Percentage of Population Employed in Agriculture, Fishing & Hunting in Inver Grove Heights, MN?
Top Zip Codes with the Highest Percentage of Population Employed in Agriculture, Fishing & Hunting in Inver Grove Heights, MN are:
What zip code has the Highest Percentage of Population Employed in Agriculture, Fishing & Hunting in Inver Grove Heights, MN?
55076 has the Highest Percentage of Population Employed in Agriculture, Fishing & Hunting in Inver Grove Heights, MN with 0.74%.
What is the Percentage of Population Employed in Agriculture, Fishing & Hunting in Inver Grove Heights, MN?
Percentage of Population Employed in Agriculture, Fishing & Hunting in Inver Grove Heights is 0.56%.
What is the Percentage of Population Employed in Agriculture, Fishing & Hunting in Minnesota?
Percentage of Population Employed in Agriculture, Fishing & Hunting in Minnesota is 1.9%.
What is the Percentage of Population Employed in Agriculture, Fishing & Hunting in the United States?
Percentage of Population Employed in Agriculture, Fishing & Hunting in the United States is 1.2%.