Zip Codes with the Most Immigrants from Eastern Asia in Inver Grove Heights, MN
RELATED REPORTS & OPTIONS
Eastern Asia
Inver Grove Heights
Compare Zip Codes
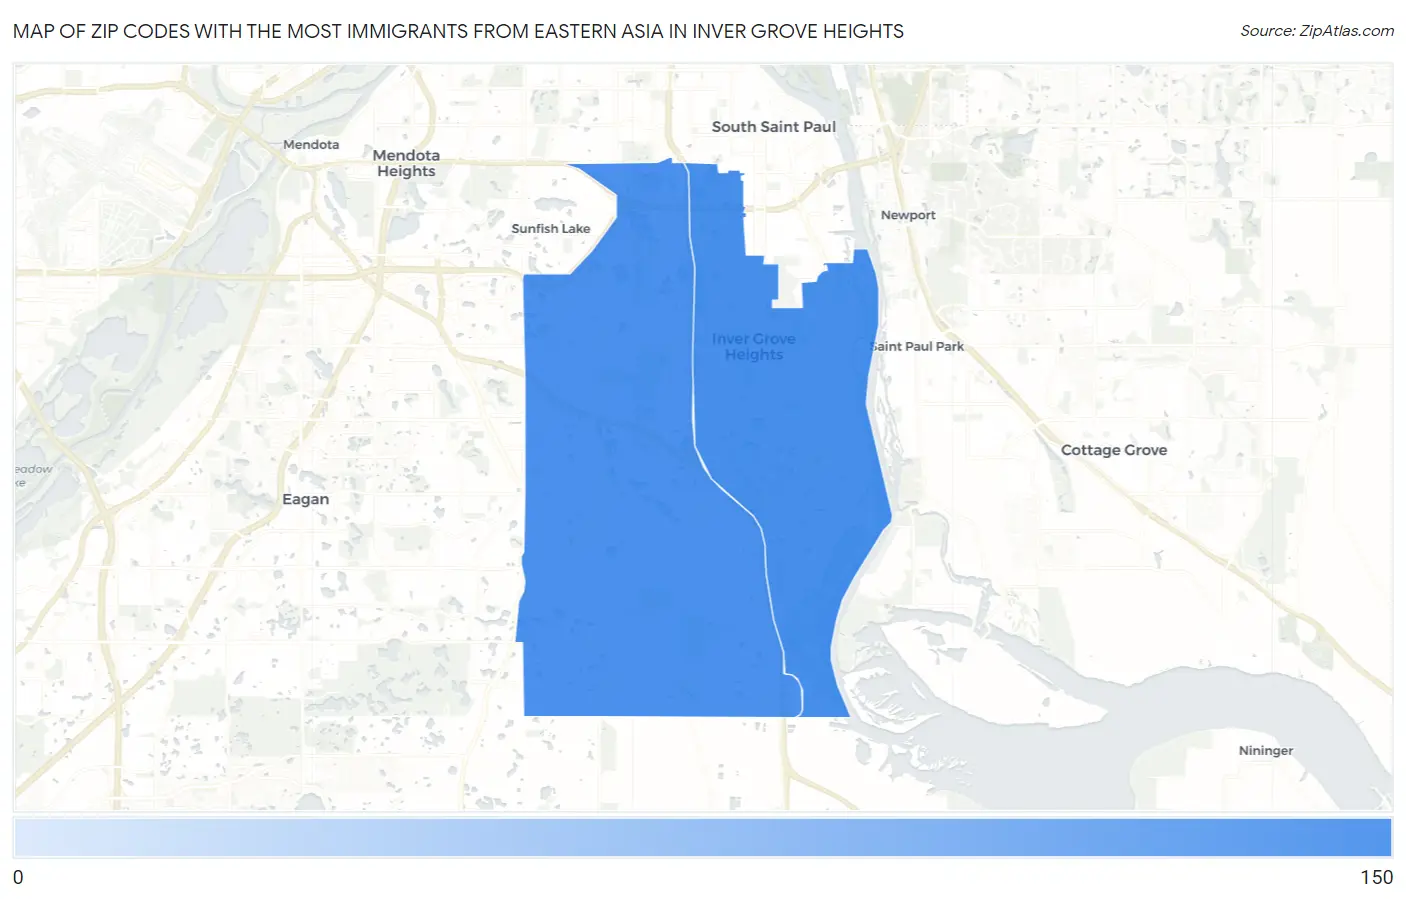
Map of Zip Codes with the Most Immigrants from Eastern Asia in Inver Grove Heights
98
102
Zip Codes with the Most Immigrants from Eastern Asia in Inver Grove Heights, MN
| Zip Code | Eastern Asia | vs State | vs National | |
| 1. | 55076 | 102 | 34,706(0.29%)#102 | 4,223,726(0.00%)#5,323 |
| 2. | 55077 | 98 | 34,706(0.28%)#107 | 4,223,726(0.00%)#5,432 |
1
Common Questions
What are the Top Zip Codes with the Most Immigrants from Eastern Asia in Inver Grove Heights, MN?
Top Zip Codes with the Most Immigrants from Eastern Asia in Inver Grove Heights, MN are:
What zip code has the Most Immigrants from Eastern Asia in Inver Grove Heights, MN?
55076 has the Most Immigrants from Eastern Asia in Inver Grove Heights, MN with 102.
What is the Total Immigrants from Eastern Asia in Inver Grove Heights, MN?
Total Immigrants from Eastern Asia in Inver Grove Heights is 195.
What is the Total Immigrants from Eastern Asia in Minnesota?
Total Immigrants from Eastern Asia in Minnesota is 34,706.
What is the Total Immigrants from Eastern Asia in the United States?
Total Immigrants from Eastern Asia in the United States is 4,223,726.