Zip Codes with the Highest Percentage of Population with a Degree in Liberal Arts and History in Upper Marlboro, MD
RELATED REPORTS & OPTIONS
Liberal Arts and History
Upper Marlboro
Compare Zip Codes
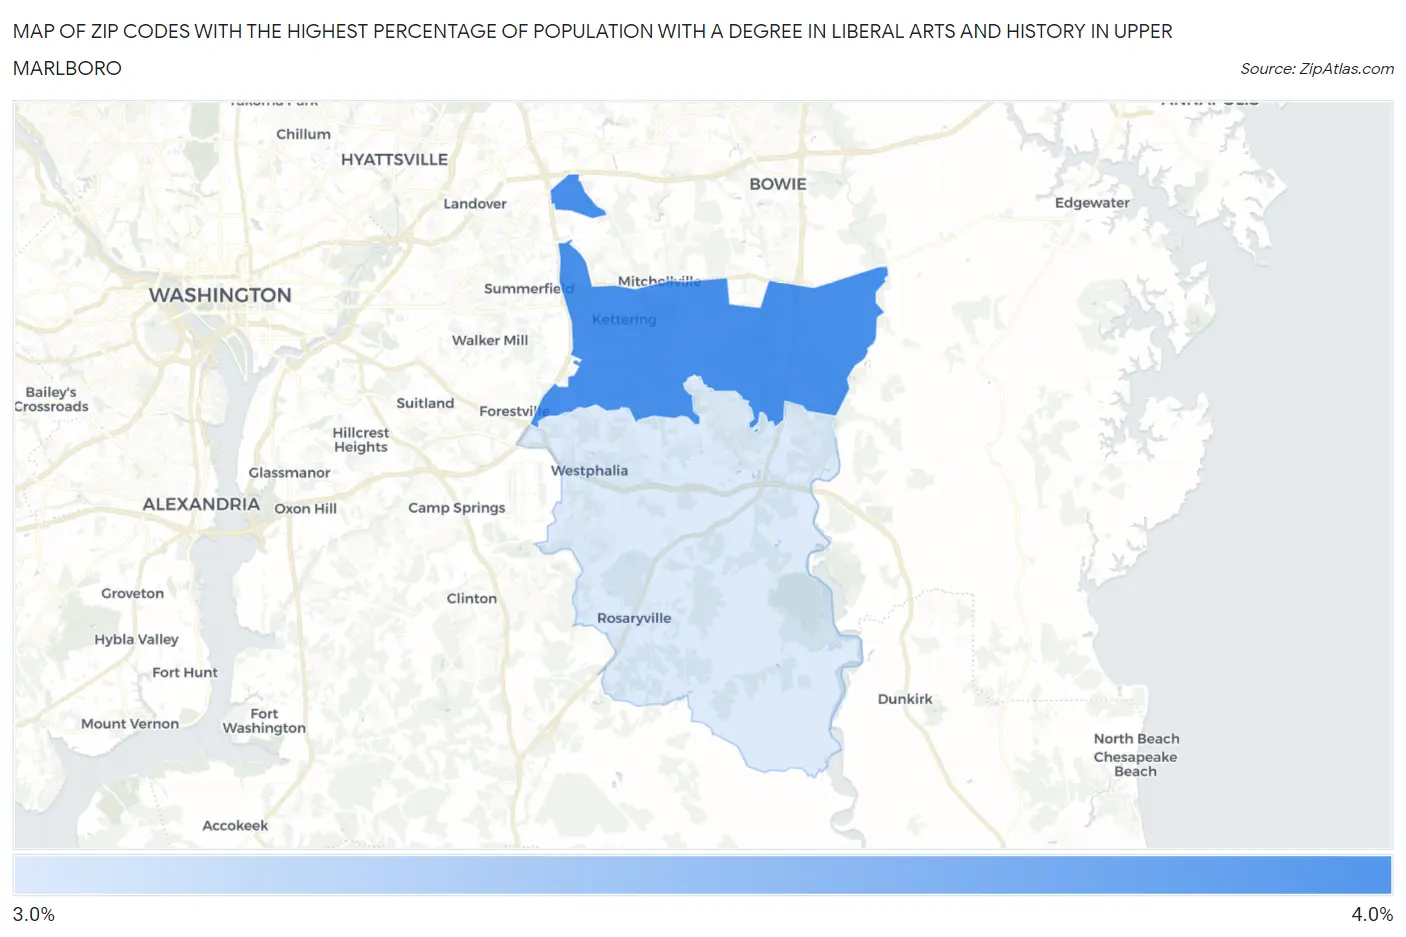
Map of Zip Codes with the Highest Percentage of Population with a Degree in Liberal Arts and History in Upper Marlboro
3.6%
3.9%
Zip Codes with the Highest Percentage of Population with a Degree in Liberal Arts and History in Upper Marlboro, MD
| Zip Code | % Graduates | vs State | vs National | |
| 1. | 20774 | 3.9% | 5.0%(-1.17)#261 | 4.9%(-1.01)#15,276 |
| 2. | 20772 | 3.6% | 5.0%(-1.42)#276 | 4.9%(-1.26)#16,221 |
1
Common Questions
What are the Top Zip Codes with the Highest Percentage of Population with a Degree in Liberal Arts and History in Upper Marlboro, MD?
Top Zip Codes with the Highest Percentage of Population with a Degree in Liberal Arts and History in Upper Marlboro, MD are:
What zip code has the Highest Percentage of Population with a Degree in Liberal Arts and History in Upper Marlboro, MD?
20774 has the Highest Percentage of Population with a Degree in Liberal Arts and History in Upper Marlboro, MD with 3.9%.
What is the Percentage of Population with a Degree in Liberal Arts and History in Upper Marlboro, MD?
Percentage of Population with a Degree in Liberal Arts and History in Upper Marlboro is 12.3%.
What is the Percentage of Population with a Degree in Liberal Arts and History in Maryland?
Percentage of Population with a Degree in Liberal Arts and History in Maryland is 5.0%.
What is the Percentage of Population with a Degree in Liberal Arts and History in the United States?
Percentage of Population with a Degree in Liberal Arts and History in the United States is 4.9%.