Zip Codes with the Highest Percentage of Population Employed in Office & Administration in Covington, LA
RELATED REPORTS & OPTIONS
Office & Administration
Covington
Compare Zip Codes
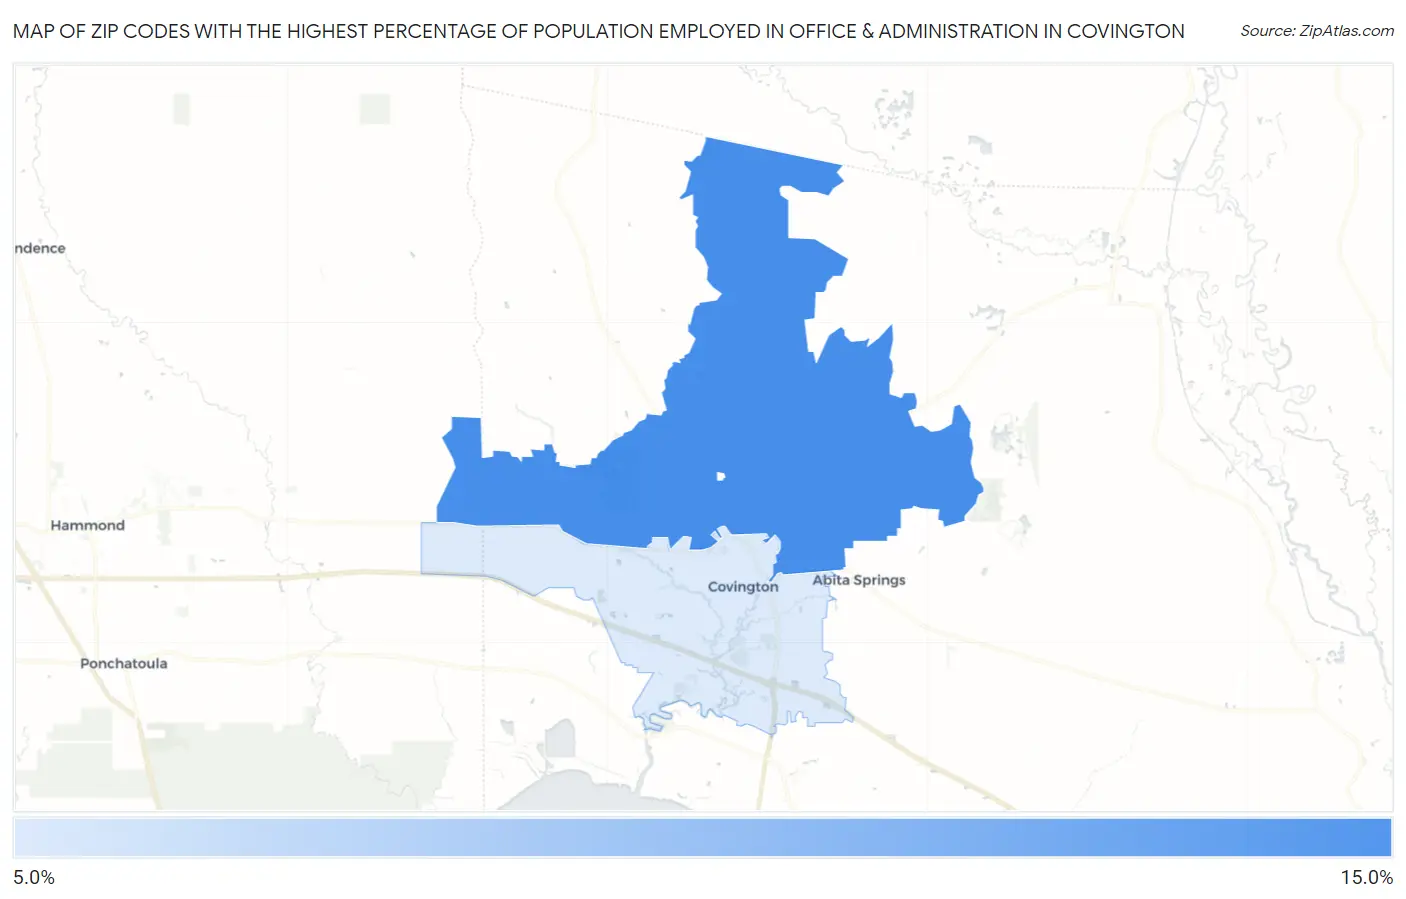
Map of Zip Codes with the Highest Percentage of Population Employed in Office & Administration in Covington
9.1%
12.2%
Zip Codes with the Highest Percentage of Population Employed in Office & Administration in Covington, LA
| Zip Code | % Employed | vs State | vs National | |
| 1. | 70435 | 12.2% | 10.6%(+1.56)#164 | 10.9%(+1.31)#10,235 |
| 2. | 70433 | 9.1% | 10.6%(-1.47)#302 | 10.9%(-1.73)#19,843 |
1
Common Questions
What are the Top Zip Codes with the Highest Percentage of Population Employed in Office & Administration in Covington, LA?
Top Zip Codes with the Highest Percentage of Population Employed in Office & Administration in Covington, LA are:
What zip code has the Highest Percentage of Population Employed in Office & Administration in Covington, LA?
70435 has the Highest Percentage of Population Employed in Office & Administration in Covington, LA with 12.2%.
What is the Percentage of Population Employed in Office & Administration in Covington, LA?
Percentage of Population Employed in Office & Administration in Covington is 7.8%.
What is the Percentage of Population Employed in Office & Administration in Louisiana?
Percentage of Population Employed in Office & Administration in Louisiana is 10.6%.
What is the Percentage of Population Employed in Office & Administration in the United States?
Percentage of Population Employed in Office & Administration in the United States is 10.9%.