Zip Codes with the Highest Percentage of Population with a Degree in Visual and Performing Arts in Covington, LA
RELATED REPORTS & OPTIONS
Visual and Performing Arts
Covington
Compare Zip Codes
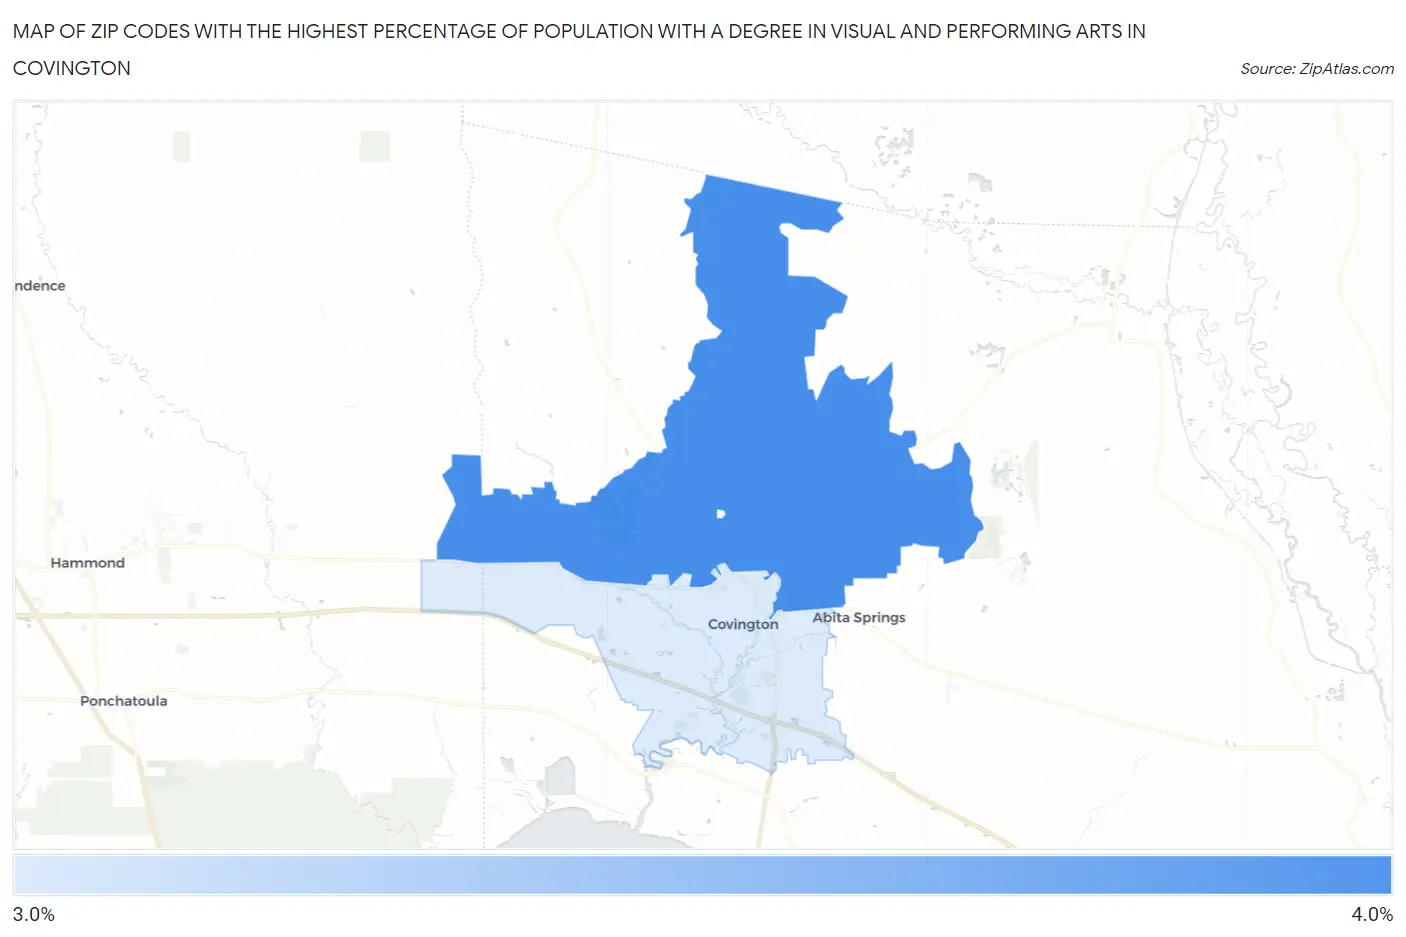
Map of Zip Codes with the Highest Percentage of Population with a Degree in Visual and Performing Arts in Covington
3.1%
3.7%
Zip Codes with the Highest Percentage of Population with a Degree in Visual and Performing Arts in Covington, LA
| Zip Code | % Graduates | vs State | vs National | |
| 1. | 70435 | 3.7% | 3.3%(+0.385)#75 | 4.3%(-0.586)#10,280 |
| 2. | 70433 | 3.1% | 3.3%(-0.180)#97 | 4.3%(-1.15)#12,337 |
1
Common Questions
What are the Top Zip Codes with the Highest Percentage of Population with a Degree in Visual and Performing Arts in Covington, LA?
Top Zip Codes with the Highest Percentage of Population with a Degree in Visual and Performing Arts in Covington, LA are:
What zip code has the Highest Percentage of Population with a Degree in Visual and Performing Arts in Covington, LA?
70435 has the Highest Percentage of Population with a Degree in Visual and Performing Arts in Covington, LA with 3.7%.
What is the Percentage of Population with a Degree in Visual and Performing Arts in Covington, LA?
Percentage of Population with a Degree in Visual and Performing Arts in Covington is 5.7%.
What is the Percentage of Population with a Degree in Visual and Performing Arts in Louisiana?
Percentage of Population with a Degree in Visual and Performing Arts in Louisiana is 3.3%.
What is the Percentage of Population with a Degree in Visual and Performing Arts in the United States?
Percentage of Population with a Degree in Visual and Performing Arts in the United States is 4.3%.