Zip Codes with the Lowest Percentage of Renter-Occupied Units in Lexington, KY
RELATED REPORTS & OPTIONS
Lowest Renter-Occupied
Lexington
Compare Zip Codes
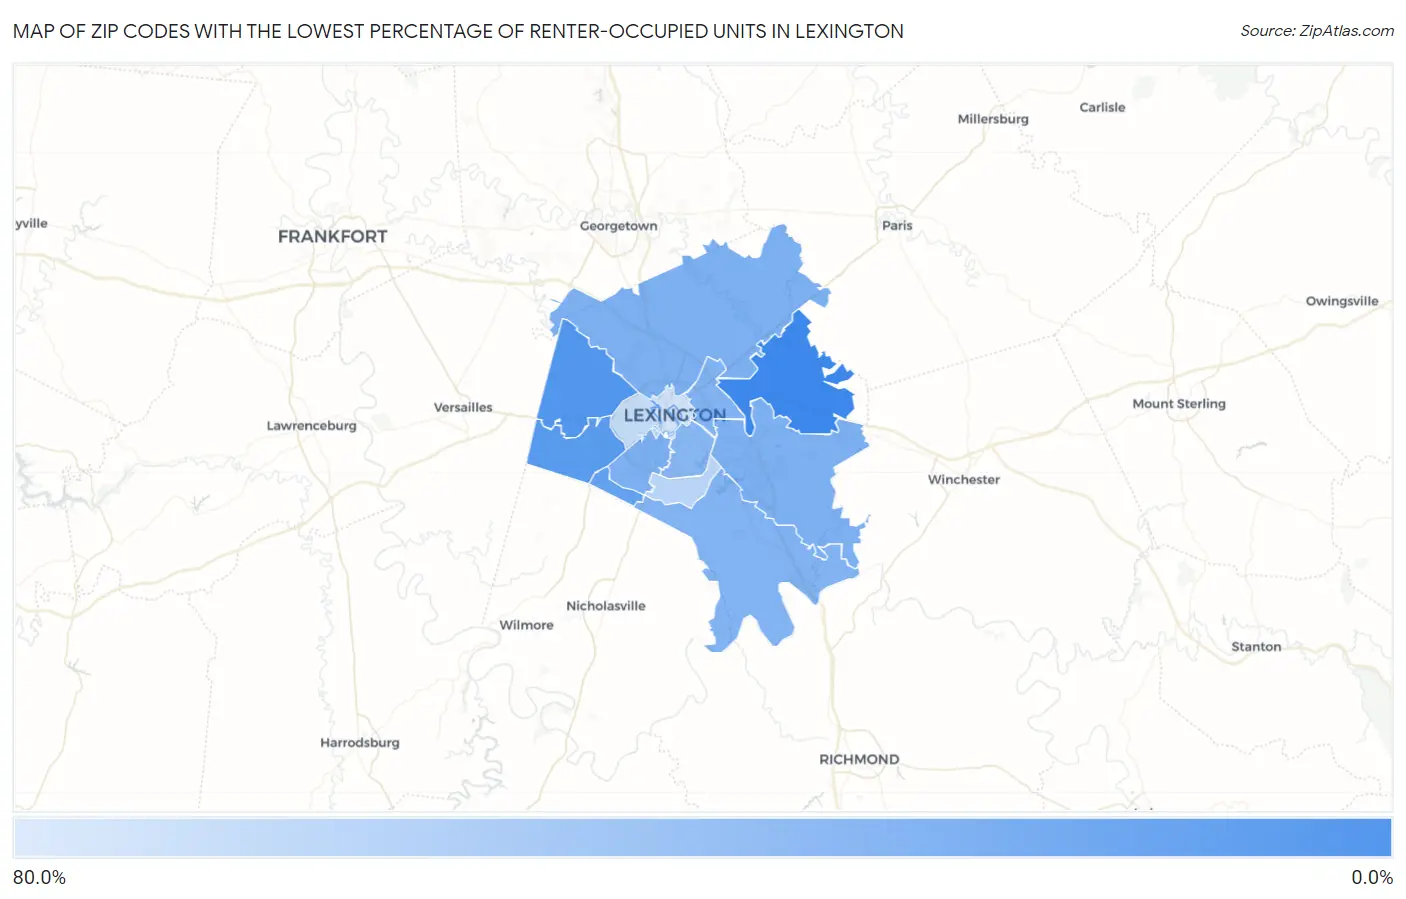
Map of Zip Codes with the Lowest Percentage of Renter-Occupied Units in Lexington
72.5%
14.7%
Zip Codes with the Lowest Percentage of Renter-Occupied Units in Lexington, KY
| Zip Code | % Renter-Occupied | vs State | vs National | |
| 1. | 40516 | 14.7% | 31.9%(-17.2)#161 | 35.2%(-20.5)#7,628 |
| 2. | 40510 | 21.9% | 31.9%(-10.0)#317 | 35.2%(-13.3)#14,626 |
| 3. | 40513 | 24.7% | 31.9%(-7.14)#382 | 35.2%(-10.4)#17,229 |
| 4. | 40514 | 27.5% | 31.9%(-4.36)#443 | 35.2%(-7.66)#19,382 |
| 5. | 40503 | 36.8% | 31.9%(+4.88)#575 | 35.2%(+1.58)#24,509 |
| 6. | 40511 | 36.8% | 31.9%(+4.91)#576 | 35.2%(+1.61)#24,526 |
| 7. | 40509 | 37.9% | 31.9%(+6.00)#582 | 35.2%(+2.70)#24,966 |
| 8. | 40515 | 38.8% | 31.9%(+6.95)#588 | 35.2%(+3.65)#25,319 |
| 9. | 40505 | 38.8% | 31.9%(+6.95)#589 | 35.2%(+3.65)#25,320 |
| 10. | 40502 | 41.4% | 31.9%(+9.51)#608 | 35.2%(+6.21)#26,105 |
| 11. | 40517 | 62.3% | 31.9%(+30.4)#668 | 35.2%(+27.1)#29,498 |
| 12. | 40504 | 67.5% | 31.9%(+35.6)#672 | 35.2%(+32.3)#29,891 |
| 13. | 40507 | 69.9% | 31.9%(+38.0)#674 | 35.2%(+34.7)#30,031 |
| 14. | 40508 | 72.5% | 31.9%(+40.6)#676 | 35.2%(+37.3)#30,166 |
1
Common Questions
What are the Top 10 Zip Codes with the Lowest Percentage of Renter-Occupied Units in Lexington, KY?
Top 10 Zip Codes with the Lowest Percentage of Renter-Occupied Units in Lexington, KY are:
What zip code has the Lowest Percentage of Renter-Occupied Units in Lexington, KY?
40516 has the Lowest Percentage of Renter-Occupied Units in Lexington, KY with 14.7%.
What is the Percentage of Renter-Occupied Units in Lexington, KY?
Percentage of Renter-Occupied Units in Lexington is 45.7%.
What is the Percentage of Renter-Occupied Units in Kentucky?
Percentage of Renter-Occupied Units in Kentucky is 31.9%.
What is the Percentage of Renter-Occupied Units in the United States?
Percentage of Renter-Occupied Units in the United States is 35.2%.