West Indian vs Austrian Disability
COMPARE
West Indian
Austrian
Disability
Disability Comparison
West Indians
Austrians
12.2%
DISABILITY
2.9/ 100
METRIC RATING
228th/ 347
METRIC RANK
12.0%
DISABILITY
7.2/ 100
METRIC RATING
212th/ 347
METRIC RANK
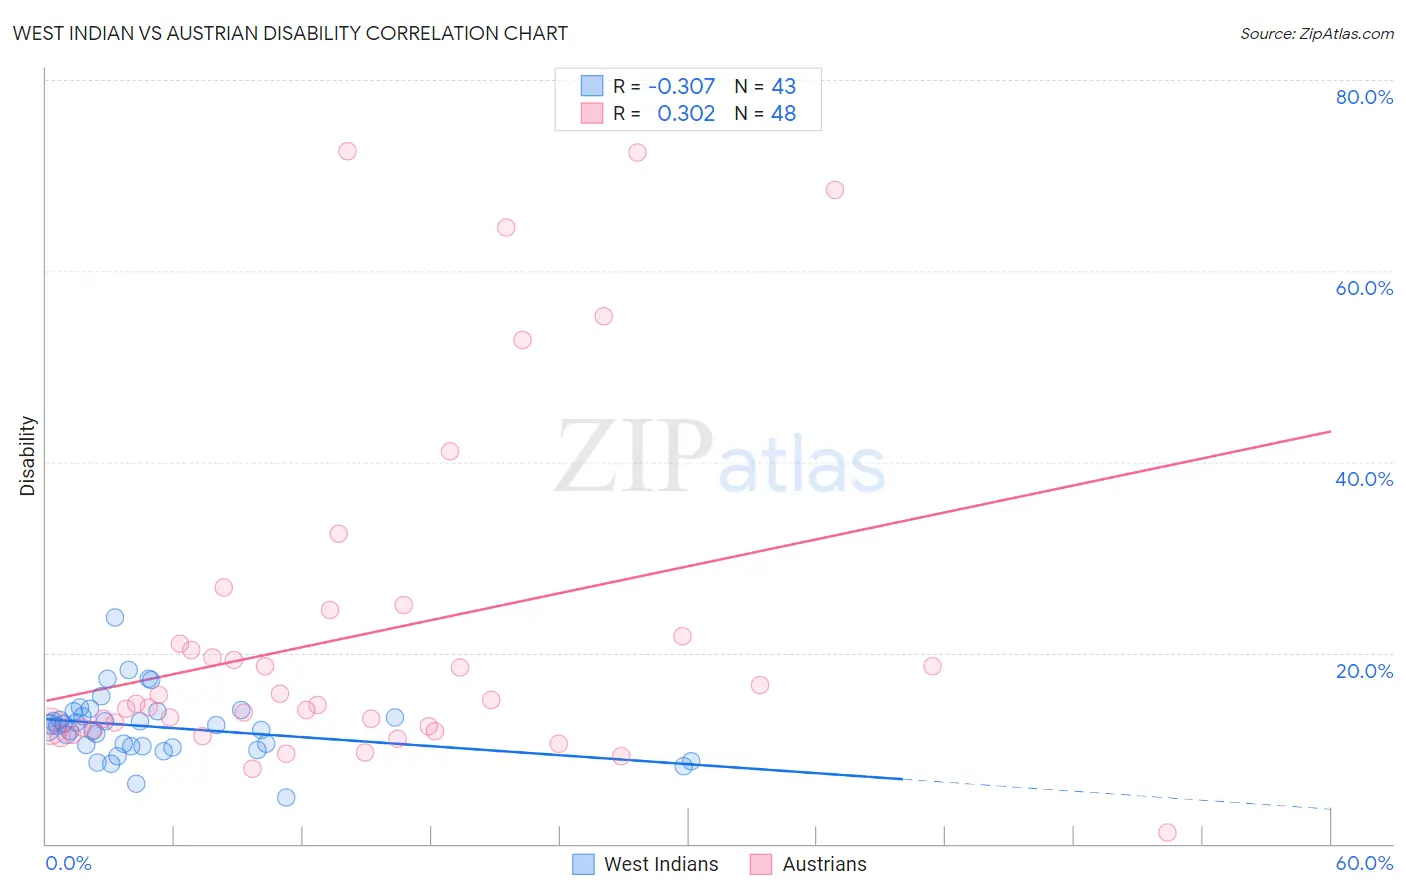
West Indian vs Austrian Disability Correlation Chart
The statistical analysis conducted on geographies consisting of 254,018,929 people shows a mild negative correlation between the proportion of West Indians and percentage of population with a disability in the United States with a correlation coefficient (R) of -0.307 and weighted average of 12.2%. Similarly, the statistical analysis conducted on geographies consisting of 452,057,102 people shows a mild positive correlation between the proportion of Austrians and percentage of population with a disability in the United States with a correlation coefficient (R) of 0.302 and weighted average of 12.0%, a difference of 1.0%.
Disability Correlation Summary
| Measurement | West Indian | Austrian |
| Minimum | 4.9% | 1.2% |
| Maximum | 23.8% | 72.5% |
| Range | 18.9% | 71.4% |
| Mean | 12.2% | 21.8% |
| Median | 12.4% | 14.6% |
| Interquartile 25% (IQ1) | 10.2% | 12.1% |
| Interquartile 75% (IQ3) | 13.9% | 21.4% |
| Interquartile Range (IQR) | 3.7% | 9.3% |
| Standard Deviation (Sample) | 3.3% | 17.7% |
| Standard Deviation (Population) | 3.3% | 17.5% |
Demographics Similar to West Indians and Austrians by Disability
In terms of disability, the demographic groups most similar to West Indians are Inupiat (12.2%, a difference of 0.020%), Samoan (12.2%, a difference of 0.10%), Alsatian (12.1%, a difference of 0.14%), Jamaican (12.1%, a difference of 0.15%), and Senegalese (12.1%, a difference of 0.20%). Similarly, the demographic groups most similar to Austrians are Immigrants from Iraq (12.0%, a difference of 0.010%), Immigrants from Cambodia (12.0%, a difference of 0.030%), Immigrants from Somalia (12.0%, a difference of 0.060%), Czech (12.0%, a difference of 0.11%), and Immigrants from Canada (12.1%, a difference of 0.18%).
| Demographics | Rating | Rank | Disability |
| Czechs | 7.9 /100 | #210 | Tragic 12.0% |
| Immigrants | Cambodia | 7.3 /100 | #211 | Tragic 12.0% |
| Austrians | 7.2 /100 | #212 | Tragic 12.0% |
| Immigrants | Iraq | 7.1 /100 | #213 | Tragic 12.0% |
| Immigrants | Somalia | 6.8 /100 | #214 | Tragic 12.0% |
| Immigrants | Canada | 6.1 /100 | #215 | Tragic 12.1% |
| Panamanians | 5.4 /100 | #216 | Tragic 12.1% |
| Immigrants | North America | 5.3 /100 | #217 | Tragic 12.1% |
| Immigrants | Jamaica | 5.0 /100 | #218 | Tragic 12.1% |
| Croatians | 4.9 /100 | #219 | Tragic 12.1% |
| Immigrants | Bahamas | 4.7 /100 | #220 | Tragic 12.1% |
| Northern Europeans | 4.2 /100 | #221 | Tragic 12.1% |
| Spanish American Indians | 4.1 /100 | #222 | Tragic 12.1% |
| Hispanics or Latinos | 3.9 /100 | #223 | Tragic 12.1% |
| Mexicans | 3.7 /100 | #224 | Tragic 12.1% |
| Senegalese | 3.5 /100 | #225 | Tragic 12.1% |
| Jamaicans | 3.3 /100 | #226 | Tragic 12.1% |
| Alsatians | 3.3 /100 | #227 | Tragic 12.1% |
| West Indians | 2.9 /100 | #228 | Tragic 12.2% |
| Inupiat | 2.8 /100 | #229 | Tragic 12.2% |
| Samoans | 2.6 /100 | #230 | Tragic 12.2% |