West Indian vs Inupiat Disability
COMPARE
West Indian
Inupiat
Disability
Disability Comparison
West Indians
Inupiat
12.2%
DISABILITY
2.9/ 100
METRIC RATING
228th/ 347
METRIC RANK
12.2%
DISABILITY
2.8/ 100
METRIC RATING
229th/ 347
METRIC RANK
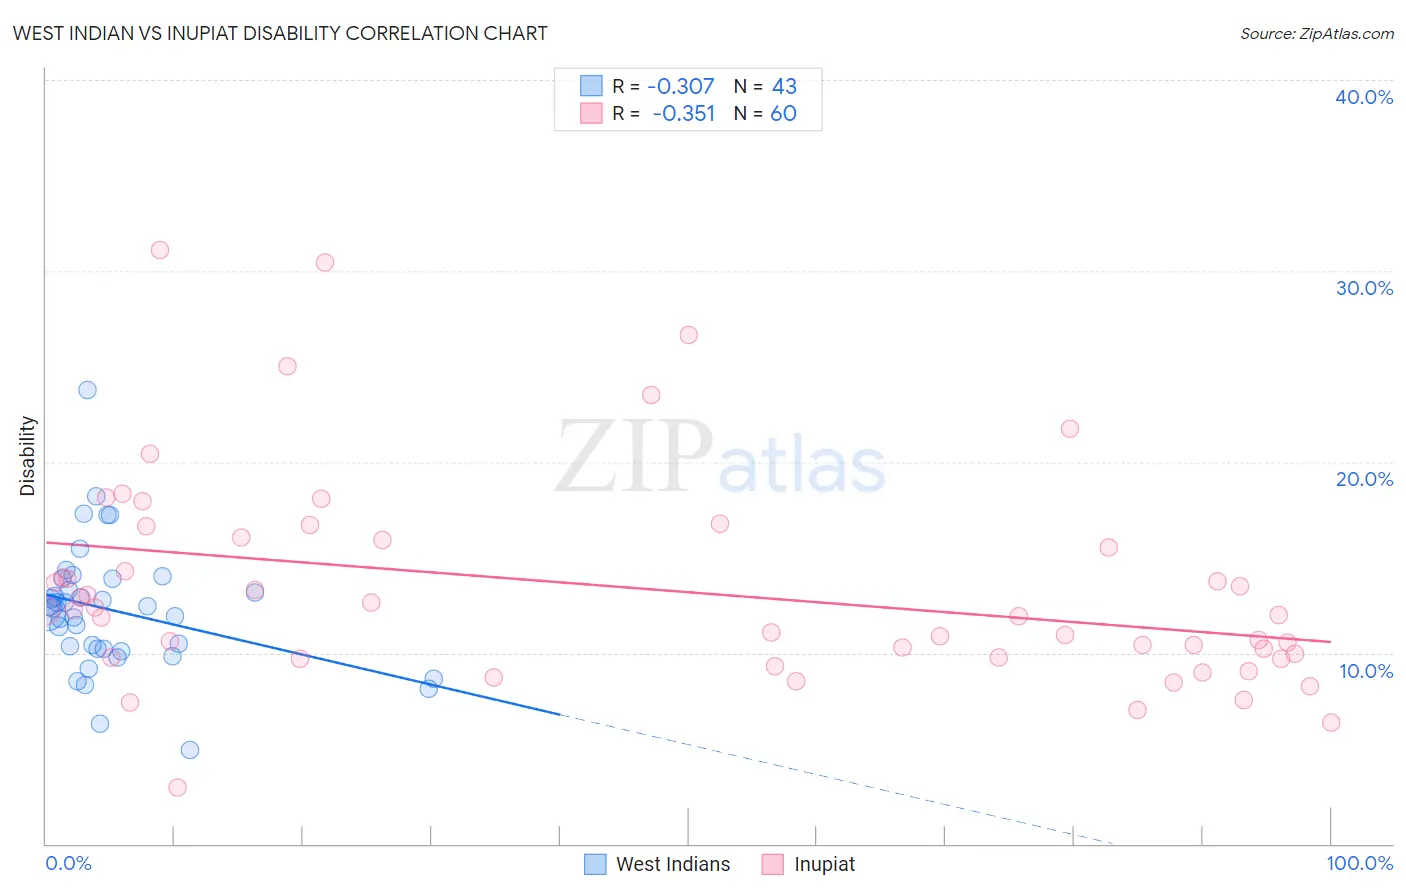
West Indian vs Inupiat Disability Correlation Chart
The statistical analysis conducted on geographies consisting of 254,018,929 people shows a mild negative correlation between the proportion of West Indians and percentage of population with a disability in the United States with a correlation coefficient (R) of -0.307 and weighted average of 12.2%. Similarly, the statistical analysis conducted on geographies consisting of 96,338,624 people shows a mild negative correlation between the proportion of Inupiat and percentage of population with a disability in the United States with a correlation coefficient (R) of -0.351 and weighted average of 12.2%, a difference of 0.020%.
Disability Correlation Summary
| Measurement | West Indian | Inupiat |
| Minimum | 4.9% | 2.9% |
| Maximum | 23.8% | 31.1% |
| Range | 18.9% | 28.2% |
| Mean | 12.2% | 13.4% |
| Median | 12.4% | 12.1% |
| Interquartile 25% (IQ1) | 10.2% | 9.8% |
| Interquartile 75% (IQ3) | 13.9% | 16.0% |
| Interquartile Range (IQR) | 3.7% | 6.2% |
| Standard Deviation (Sample) | 3.3% | 5.6% |
| Standard Deviation (Population) | 3.3% | 5.6% |
Demographics Similar to West Indians and Inupiat by Disability
In terms of disability, the demographic groups most similar to West Indians are Samoan (12.2%, a difference of 0.10%), Malaysian (12.2%, a difference of 0.13%), Alsatian (12.1%, a difference of 0.14%), Italian (12.2%, a difference of 0.14%), and Jamaican (12.1%, a difference of 0.15%). Similarly, the demographic groups most similar to Inupiat are Samoan (12.2%, a difference of 0.080%), Malaysian (12.2%, a difference of 0.11%), Italian (12.2%, a difference of 0.12%), Alsatian (12.1%, a difference of 0.16%), and Jamaican (12.1%, a difference of 0.17%).
| Demographics | Rating | Rank | Disability |
| Immigrants | Jamaica | 5.0 /100 | #218 | Tragic 12.1% |
| Croatians | 4.9 /100 | #219 | Tragic 12.1% |
| Immigrants | Bahamas | 4.7 /100 | #220 | Tragic 12.1% |
| Northern Europeans | 4.2 /100 | #221 | Tragic 12.1% |
| Spanish American Indians | 4.1 /100 | #222 | Tragic 12.1% |
| Hispanics or Latinos | 3.9 /100 | #223 | Tragic 12.1% |
| Mexicans | 3.7 /100 | #224 | Tragic 12.1% |
| Senegalese | 3.5 /100 | #225 | Tragic 12.1% |
| Jamaicans | 3.3 /100 | #226 | Tragic 12.1% |
| Alsatians | 3.3 /100 | #227 | Tragic 12.1% |
| West Indians | 2.9 /100 | #228 | Tragic 12.2% |
| Inupiat | 2.8 /100 | #229 | Tragic 12.2% |
| Samoans | 2.6 /100 | #230 | Tragic 12.2% |
| Malaysians | 2.5 /100 | #231 | Tragic 12.2% |
| Italians | 2.5 /100 | #232 | Tragic 12.2% |
| Bahamians | 2.3 /100 | #233 | Tragic 12.2% |
| Japanese | 2.3 /100 | #234 | Tragic 12.2% |
| Yup'ik | 2.2 /100 | #235 | Tragic 12.2% |
| Chinese | 2.0 /100 | #236 | Tragic 12.2% |
| Immigrants | Congo | 1.9 /100 | #237 | Tragic 12.2% |
| Norwegians | 1.9 /100 | #238 | Tragic 12.2% |