West Indian vs Seminole Disability
COMPARE
West Indian
Seminole
Disability
Disability Comparison
West Indians
Seminole
12.2%
DISABILITY
2.9/ 100
METRIC RATING
228th/ 347
METRIC RANK
14.9%
DISABILITY
0.0/ 100
METRIC RATING
337th/ 347
METRIC RANK
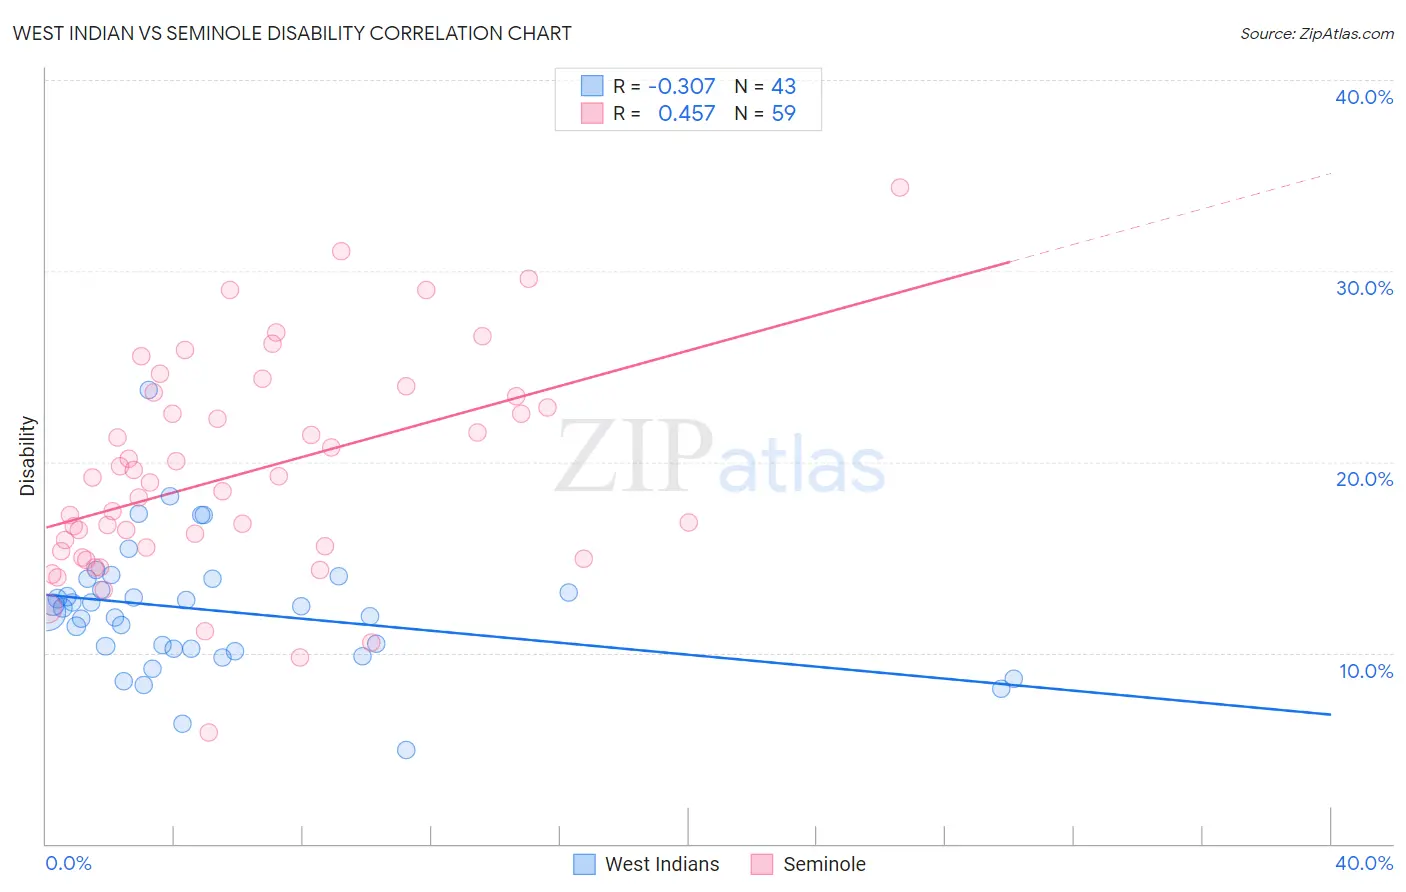
West Indian vs Seminole Disability Correlation Chart
The statistical analysis conducted on geographies consisting of 254,018,929 people shows a mild negative correlation between the proportion of West Indians and percentage of population with a disability in the United States with a correlation coefficient (R) of -0.307 and weighted average of 12.2%. Similarly, the statistical analysis conducted on geographies consisting of 118,308,491 people shows a moderate positive correlation between the proportion of Seminole and percentage of population with a disability in the United States with a correlation coefficient (R) of 0.457 and weighted average of 14.9%, a difference of 22.2%.
Disability Correlation Summary
| Measurement | West Indian | Seminole |
| Minimum | 4.9% | 5.8% |
| Maximum | 23.8% | 34.4% |
| Range | 18.9% | 28.5% |
| Mean | 12.2% | 19.4% |
| Median | 12.4% | 18.9% |
| Interquartile 25% (IQ1) | 10.2% | 15.3% |
| Interquartile 75% (IQ3) | 13.9% | 23.4% |
| Interquartile Range (IQR) | 3.7% | 8.1% |
| Standard Deviation (Sample) | 3.3% | 5.7% |
| Standard Deviation (Population) | 3.3% | 5.6% |
Similar Demographics by Disability
Demographics Similar to West Indians by Disability
In terms of disability, the demographic groups most similar to West Indians are Inupiat (12.2%, a difference of 0.020%), Samoan (12.2%, a difference of 0.10%), Malaysian (12.2%, a difference of 0.13%), Alsatian (12.1%, a difference of 0.14%), and Italian (12.2%, a difference of 0.14%).
| Demographics | Rating | Rank | Disability |
| Northern Europeans | 4.2 /100 | #221 | Tragic 12.1% |
| Spanish American Indians | 4.1 /100 | #222 | Tragic 12.1% |
| Hispanics or Latinos | 3.9 /100 | #223 | Tragic 12.1% |
| Mexicans | 3.7 /100 | #224 | Tragic 12.1% |
| Senegalese | 3.5 /100 | #225 | Tragic 12.1% |
| Jamaicans | 3.3 /100 | #226 | Tragic 12.1% |
| Alsatians | 3.3 /100 | #227 | Tragic 12.1% |
| West Indians | 2.9 /100 | #228 | Tragic 12.2% |
| Inupiat | 2.8 /100 | #229 | Tragic 12.2% |
| Samoans | 2.6 /100 | #230 | Tragic 12.2% |
| Malaysians | 2.5 /100 | #231 | Tragic 12.2% |
| Italians | 2.5 /100 | #232 | Tragic 12.2% |
| Bahamians | 2.3 /100 | #233 | Tragic 12.2% |
| Japanese | 2.3 /100 | #234 | Tragic 12.2% |
| Yup'ik | 2.2 /100 | #235 | Tragic 12.2% |
Demographics Similar to Seminole by Disability
In terms of disability, the demographic groups most similar to Seminole are Cherokee (14.8%, a difference of 0.090%), Dutch West Indian (14.9%, a difference of 0.30%), Tohono O'odham (14.8%, a difference of 0.61%), Yuman (14.6%, a difference of 1.7%), and Cajun (14.6%, a difference of 1.8%).
| Demographics | Rating | Rank | Disability |
| Navajo | 0.0 /100 | #330 | Tragic 14.3% |
| Alaskan Athabascans | 0.0 /100 | #331 | Tragic 14.4% |
| Pueblo | 0.0 /100 | #332 | Tragic 14.4% |
| Cajuns | 0.0 /100 | #333 | Tragic 14.6% |
| Yuman | 0.0 /100 | #334 | Tragic 14.6% |
| Tohono O'odham | 0.0 /100 | #335 | Tragic 14.8% |
| Cherokee | 0.0 /100 | #336 | Tragic 14.8% |
| Seminole | 0.0 /100 | #337 | Tragic 14.9% |
| Dutch West Indians | 0.0 /100 | #338 | Tragic 14.9% |
| Chickasaw | 0.0 /100 | #339 | Tragic 15.2% |
| Choctaw | 0.0 /100 | #340 | Tragic 15.4% |
| Lumbee | 0.0 /100 | #341 | Tragic 15.5% |
| Kiowa | 0.0 /100 | #342 | Tragic 15.6% |
| Creek | 0.0 /100 | #343 | Tragic 15.6% |
| Colville | 0.0 /100 | #344 | Tragic 15.8% |