Dutch vs American Disability
COMPARE
Dutch
American
Disability
Disability Comparison
Dutch
Americans
12.8%
DISABILITY
0.0/ 100
METRIC RATING
277th/ 347
METRIC RANK
13.9%
DISABILITY
0.0/ 100
METRIC RATING
322nd/ 347
METRIC RANK
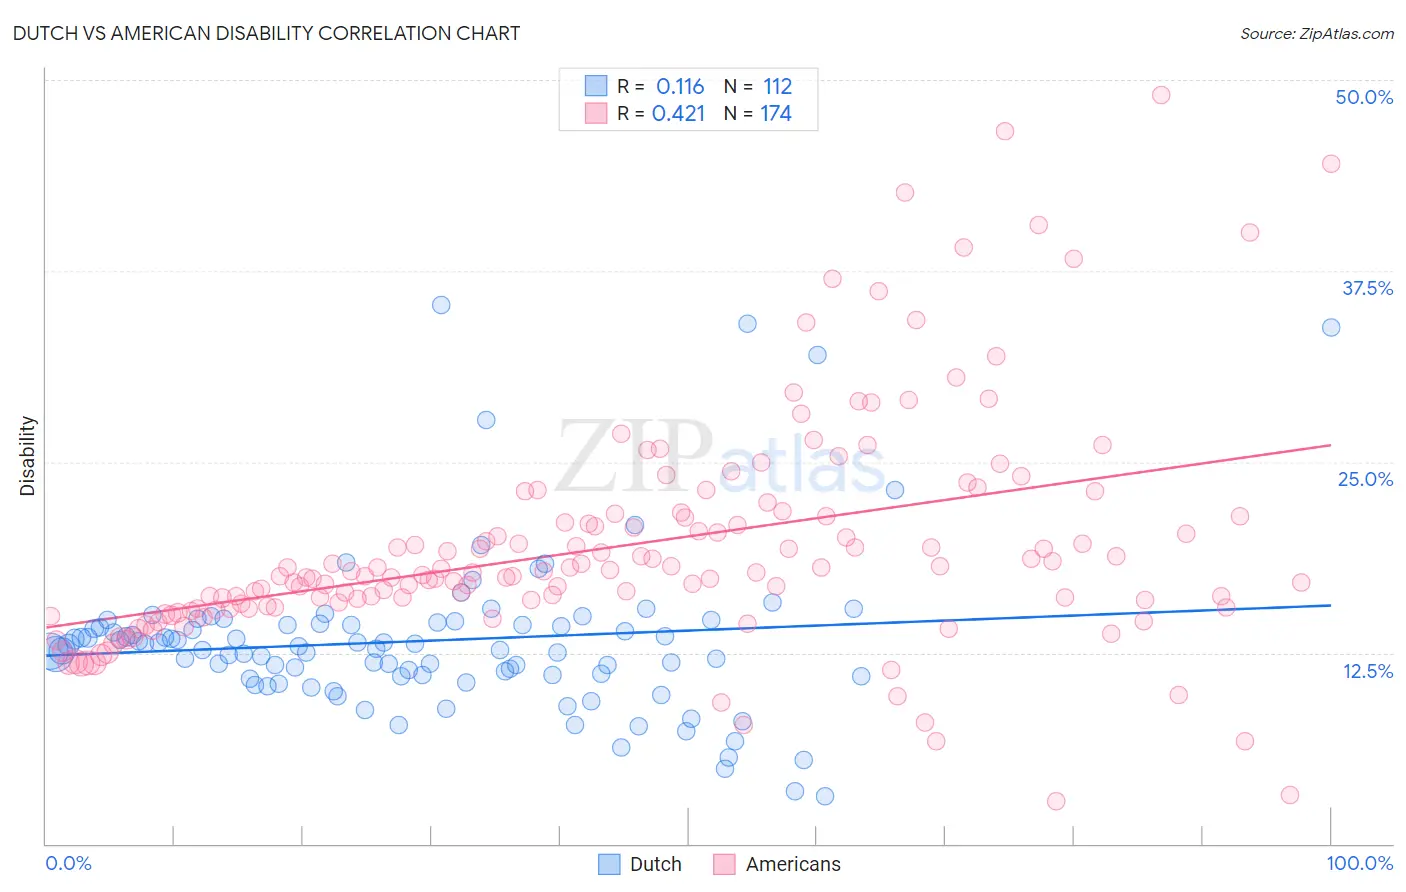
Dutch vs American Disability Correlation Chart
The statistical analysis conducted on geographies consisting of 554,259,467 people shows a poor positive correlation between the proportion of Dutch and percentage of population with a disability in the United States with a correlation coefficient (R) of 0.116 and weighted average of 12.8%. Similarly, the statistical analysis conducted on geographies consisting of 581,794,262 people shows a moderate positive correlation between the proportion of Americans and percentage of population with a disability in the United States with a correlation coefficient (R) of 0.421 and weighted average of 13.9%, a difference of 8.8%.
Disability Correlation Summary
| Measurement | Dutch | American |
| Minimum | 3.1% | 2.8% |
| Maximum | 35.3% | 49.1% |
| Range | 32.1% | 46.3% |
| Mean | 13.3% | 19.4% |
| Median | 12.8% | 17.7% |
| Interquartile 25% (IQ1) | 11.0% | 15.4% |
| Interquartile 75% (IQ3) | 14.4% | 21.4% |
| Interquartile Range (IQR) | 3.3% | 6.0% |
| Standard Deviation (Sample) | 5.3% | 7.5% |
| Standard Deviation (Population) | 5.3% | 7.5% |
Similar Demographics by Disability
Demographics Similar to Dutch by Disability
In terms of disability, the demographic groups most similar to Dutch are Hmong (12.8%, a difference of 0.050%), German (12.8%, a difference of 0.17%), Sioux (12.8%, a difference of 0.20%), Fijian (12.8%, a difference of 0.26%), and Nepalese (12.8%, a difference of 0.28%).
| Demographics | Rating | Rank | Disability |
| Portuguese | 0.1 /100 | #270 | Tragic 12.6% |
| Immigrants | Yemen | 0.1 /100 | #271 | Tragic 12.6% |
| Dominicans | 0.0 /100 | #272 | Tragic 12.7% |
| Finns | 0.0 /100 | #273 | Tragic 12.7% |
| Nepalese | 0.0 /100 | #274 | Tragic 12.8% |
| Sioux | 0.0 /100 | #275 | Tragic 12.8% |
| Hmong | 0.0 /100 | #276 | Tragic 12.8% |
| Dutch | 0.0 /100 | #277 | Tragic 12.8% |
| Germans | 0.0 /100 | #278 | Tragic 12.8% |
| Fijians | 0.0 /100 | #279 | Tragic 12.8% |
| Spanish | 0.0 /100 | #280 | Tragic 12.8% |
| Immigrants | Portugal | 0.0 /100 | #281 | Tragic 12.9% |
| Scottish | 0.0 /100 | #282 | Tragic 12.9% |
| Irish | 0.0 /100 | #283 | Tragic 12.9% |
| Welsh | 0.0 /100 | #284 | Tragic 12.9% |
Demographics Similar to Americans by Disability
In terms of disability, the demographic groups most similar to Americans are Paiute (13.9%, a difference of 0.42%), Apache (13.9%, a difference of 0.55%), Iroquois (13.8%, a difference of 0.84%), Menominee (13.8%, a difference of 1.1%), and Comanche (14.1%, a difference of 1.3%).
| Demographics | Rating | Rank | Disability |
| Puget Sound Salish | 0.0 /100 | #315 | Tragic 13.7% |
| Pima | 0.0 /100 | #316 | Tragic 13.7% |
| Immigrants | Cabo Verde | 0.0 /100 | #317 | Tragic 13.7% |
| Menominee | 0.0 /100 | #318 | Tragic 13.8% |
| Iroquois | 0.0 /100 | #319 | Tragic 13.8% |
| Apache | 0.0 /100 | #320 | Tragic 13.9% |
| Paiute | 0.0 /100 | #321 | Tragic 13.9% |
| Americans | 0.0 /100 | #322 | Tragic 13.9% |
| Comanche | 0.0 /100 | #323 | Tragic 14.1% |
| Chippewa | 0.0 /100 | #324 | Tragic 14.1% |
| Natives/Alaskans | 0.0 /100 | #325 | Tragic 14.2% |
| Osage | 0.0 /100 | #326 | Tragic 14.2% |
| Ottawa | 0.0 /100 | #327 | Tragic 14.2% |
| Immigrants | Azores | 0.0 /100 | #328 | Tragic 14.2% |
| Potawatomi | 0.0 /100 | #329 | Tragic 14.2% |