Dutch vs Czech Disability
COMPARE
Dutch
Czech
Disability
Disability Comparison
Dutch
Czechs
12.8%
DISABILITY
0.0/ 100
METRIC RATING
277th/ 347
METRIC RANK
12.0%
DISABILITY
7.9/ 100
METRIC RATING
210th/ 347
METRIC RANK
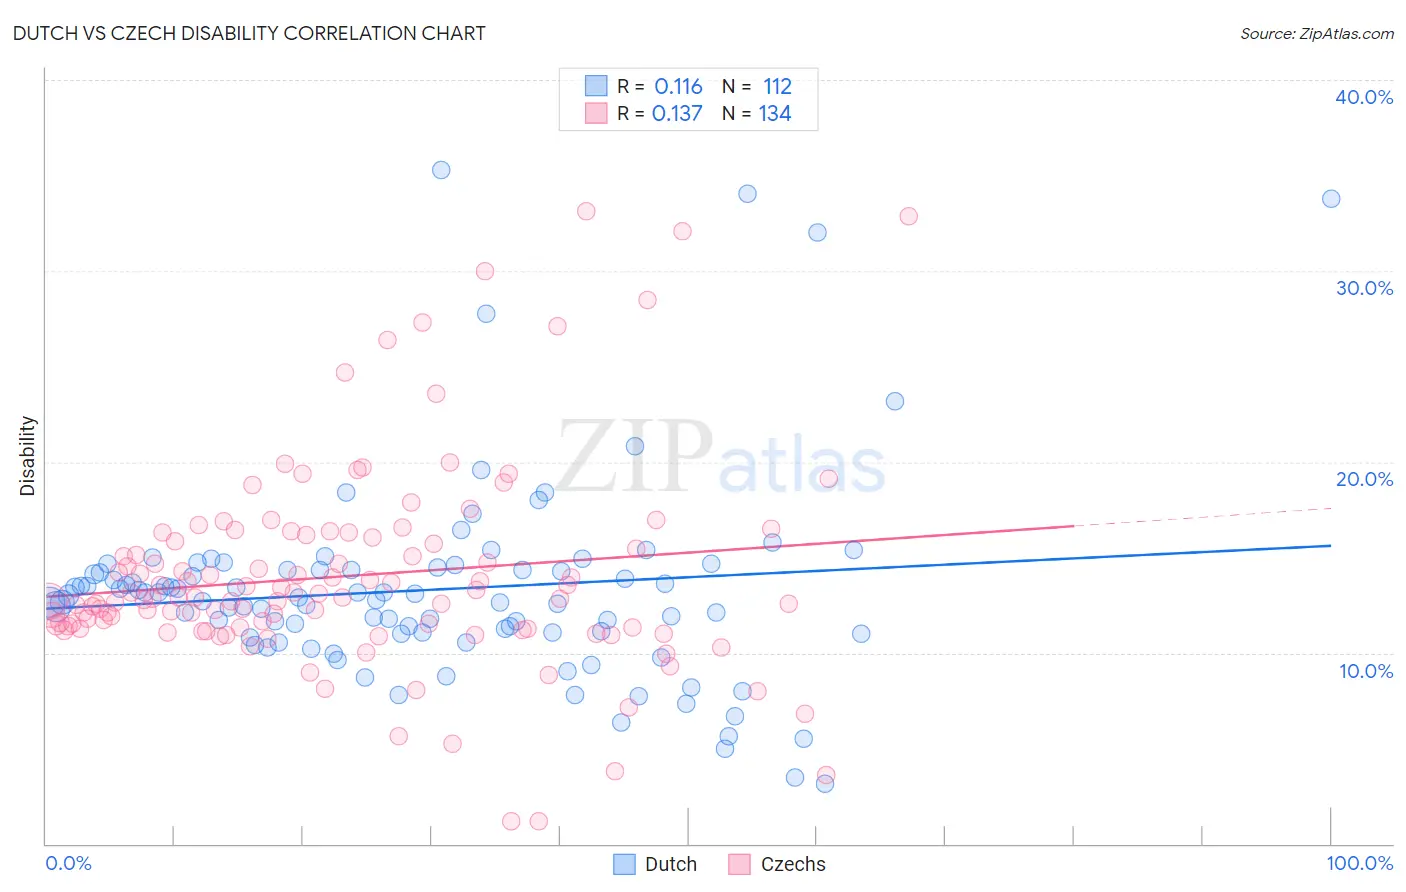
Dutch vs Czech Disability Correlation Chart
The statistical analysis conducted on geographies consisting of 554,259,467 people shows a poor positive correlation between the proportion of Dutch and percentage of population with a disability in the United States with a correlation coefficient (R) of 0.116 and weighted average of 12.8%. Similarly, the statistical analysis conducted on geographies consisting of 484,761,061 people shows a poor positive correlation between the proportion of Czechs and percentage of population with a disability in the United States with a correlation coefficient (R) of 0.137 and weighted average of 12.0%, a difference of 6.5%.
Disability Correlation Summary
| Measurement | Dutch | Czech |
| Minimum | 3.1% | 1.2% |
| Maximum | 35.3% | 33.1% |
| Range | 32.1% | 31.9% |
| Mean | 13.3% | 14.0% |
| Median | 12.8% | 12.9% |
| Interquartile 25% (IQ1) | 11.0% | 11.3% |
| Interquartile 75% (IQ3) | 14.4% | 16.0% |
| Interquartile Range (IQR) | 3.3% | 4.7% |
| Standard Deviation (Sample) | 5.3% | 5.4% |
| Standard Deviation (Population) | 5.3% | 5.4% |
Similar Demographics by Disability
Demographics Similar to Dutch by Disability
In terms of disability, the demographic groups most similar to Dutch are Hmong (12.8%, a difference of 0.050%), German (12.8%, a difference of 0.17%), Sioux (12.8%, a difference of 0.20%), Fijian (12.8%, a difference of 0.26%), and Nepalese (12.8%, a difference of 0.28%).
| Demographics | Rating | Rank | Disability |
| Portuguese | 0.1 /100 | #270 | Tragic 12.6% |
| Immigrants | Yemen | 0.1 /100 | #271 | Tragic 12.6% |
| Dominicans | 0.0 /100 | #272 | Tragic 12.7% |
| Finns | 0.0 /100 | #273 | Tragic 12.7% |
| Nepalese | 0.0 /100 | #274 | Tragic 12.8% |
| Sioux | 0.0 /100 | #275 | Tragic 12.8% |
| Hmong | 0.0 /100 | #276 | Tragic 12.8% |
| Dutch | 0.0 /100 | #277 | Tragic 12.8% |
| Germans | 0.0 /100 | #278 | Tragic 12.8% |
| Fijians | 0.0 /100 | #279 | Tragic 12.8% |
| Spanish | 0.0 /100 | #280 | Tragic 12.8% |
| Immigrants | Portugal | 0.0 /100 | #281 | Tragic 12.9% |
| Scottish | 0.0 /100 | #282 | Tragic 12.9% |
| Irish | 0.0 /100 | #283 | Tragic 12.9% |
| Welsh | 0.0 /100 | #284 | Tragic 12.9% |
Demographics Similar to Czechs by Disability
In terms of disability, the demographic groups most similar to Czechs are Immigrants from Cambodia (12.0%, a difference of 0.080%), Austrian (12.0%, a difference of 0.11%), Immigrants from Iraq (12.0%, a difference of 0.11%), Danish (12.0%, a difference of 0.13%), and Immigrants from Somalia (12.0%, a difference of 0.16%).
| Demographics | Rating | Rank | Disability |
| British West Indians | 11.5 /100 | #203 | Poor 12.0% |
| Mexican American Indians | 11.4 /100 | #204 | Poor 12.0% |
| Immigrants | Western Europe | 10.1 /100 | #205 | Poor 12.0% |
| Immigrants | Senegal | 9.4 /100 | #206 | Tragic 12.0% |
| Immigrants | Thailand | 9.3 /100 | #207 | Tragic 12.0% |
| Immigrants | Caribbean | 9.1 /100 | #208 | Tragic 12.0% |
| Danes | 8.7 /100 | #209 | Tragic 12.0% |
| Czechs | 7.9 /100 | #210 | Tragic 12.0% |
| Immigrants | Cambodia | 7.3 /100 | #211 | Tragic 12.0% |
| Austrians | 7.2 /100 | #212 | Tragic 12.0% |
| Immigrants | Iraq | 7.1 /100 | #213 | Tragic 12.0% |
| Immigrants | Somalia | 6.8 /100 | #214 | Tragic 12.0% |
| Immigrants | Canada | 6.1 /100 | #215 | Tragic 12.1% |
| Panamanians | 5.4 /100 | #216 | Tragic 12.1% |
| Immigrants | North America | 5.3 /100 | #217 | Tragic 12.1% |