Zip Codes with the Highest Percentage of Self-Employed / Not Incorporated in Mobile, AL
RELATED REPORTS & OPTIONS
Self-Employed / Not Incorporated
Mobile
Compare Zip Codes
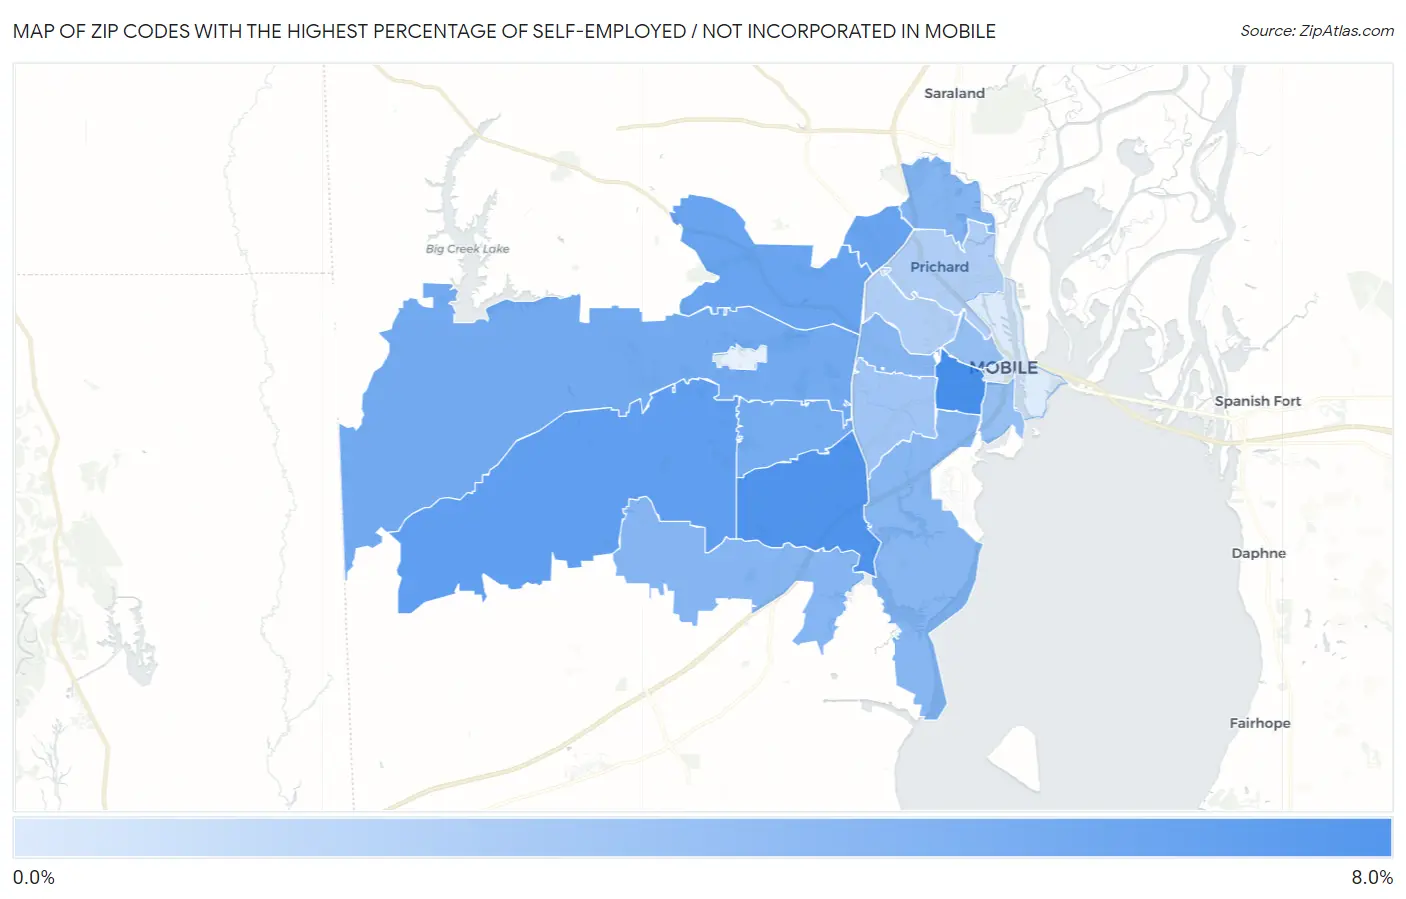
Map of Zip Codes with the Highest Percentage of Self-Employed / Not Incorporated in Mobile
0.0%
8.0%
Zip Codes with the Highest Percentage of Self-Employed / Not Incorporated in Mobile, AL
| Zip Code | % Self-Employed / Not Incorporated | vs State | vs National | |
| 1. | 36604 | 7.7% | 5.3%(+2.39)#126 | 5.8%(+1.91)#11,232 |
| 2. | 36693 | 7.3% | 5.3%(+1.96)#153 | 5.8%(+1.48)#12,297 |
| 3. | 36695 | 6.5% | 5.3%(+1.14)#199 | 5.8%(+0.660)#14,544 |
| 4. | 36612 | 6.1% | 5.3%(+0.806)#223 | 5.8%(+0.327)#15,611 |
| 5. | 36618 | 6.1% | 5.3%(+0.733)#229 | 5.8%(+0.254)#15,829 |
| 6. | 36608 | 5.6% | 5.3%(+0.219)#259 | 5.8%(-0.260)#17,577 |
| 7. | 36609 | 5.5% | 5.3%(+0.127)#266 | 5.8%(-0.352)#17,896 |
| 8. | 36611 | 4.8% | 5.3%(-0.555)#326 | 5.8%(-1.03)#20,492 |
| 9. | 36607 | 4.7% | 5.3%(-0.679)#338 | 5.8%(-1.16)#20,956 |
| 10. | 36619 | 4.6% | 5.3%(-0.691)#341 | 5.8%(-1.17)#20,995 |
| 11. | 36605 | 4.5% | 5.3%(-0.790)#349 | 5.8%(-1.27)#21,377 |
| 12. | 36603 | 3.9% | 5.3%(-1.45)#408 | 5.8%(-1.93)#23,768 |
| 13. | 36606 | 3.3% | 5.3%(-2.00)#440 | 5.8%(-2.48)#25,499 |
| 14. | 36617 | 2.7% | 5.3%(-2.68)#480 | 5.8%(-3.16)#27,130 |
| 15. | 36610 | 2.6% | 5.3%(-2.71)#483 | 5.8%(-3.19)#27,190 |
| 16. | 36602 | 0.50% | 5.3%(-4.84)#545 | 5.8%(-5.31)#29,401 |
1
Common Questions
What are the Top 10 Zip Codes with the Highest Percentage of Self-Employed / Not Incorporated in Mobile, AL?
Top 10 Zip Codes with the Highest Percentage of Self-Employed / Not Incorporated in Mobile, AL are:
What zip code has the Highest Percentage of Self-Employed / Not Incorporated in Mobile, AL?
36604 has the Highest Percentage of Self-Employed / Not Incorporated in Mobile, AL with 7.7%.
What is the Percentage of Self-Employed / Not Incorporated in Mobile, AL?
Percentage of Self-Employed / Not Incorporated in Mobile is 5.1%.
What is the Percentage of Self-Employed / Not Incorporated in Alabama?
Percentage of Self-Employed / Not Incorporated in Alabama is 5.3%.
What is the Percentage of Self-Employed / Not Incorporated in the United States?
Percentage of Self-Employed / Not Incorporated in the United States is 5.8%.