Zip Codes with the Highest Percentage of Population Taking Taxi / Cab to Work in Sylacauga, AL
RELATED REPORTS & OPTIONS
Taxi / Cab
Sylacauga
Compare Zip Codes
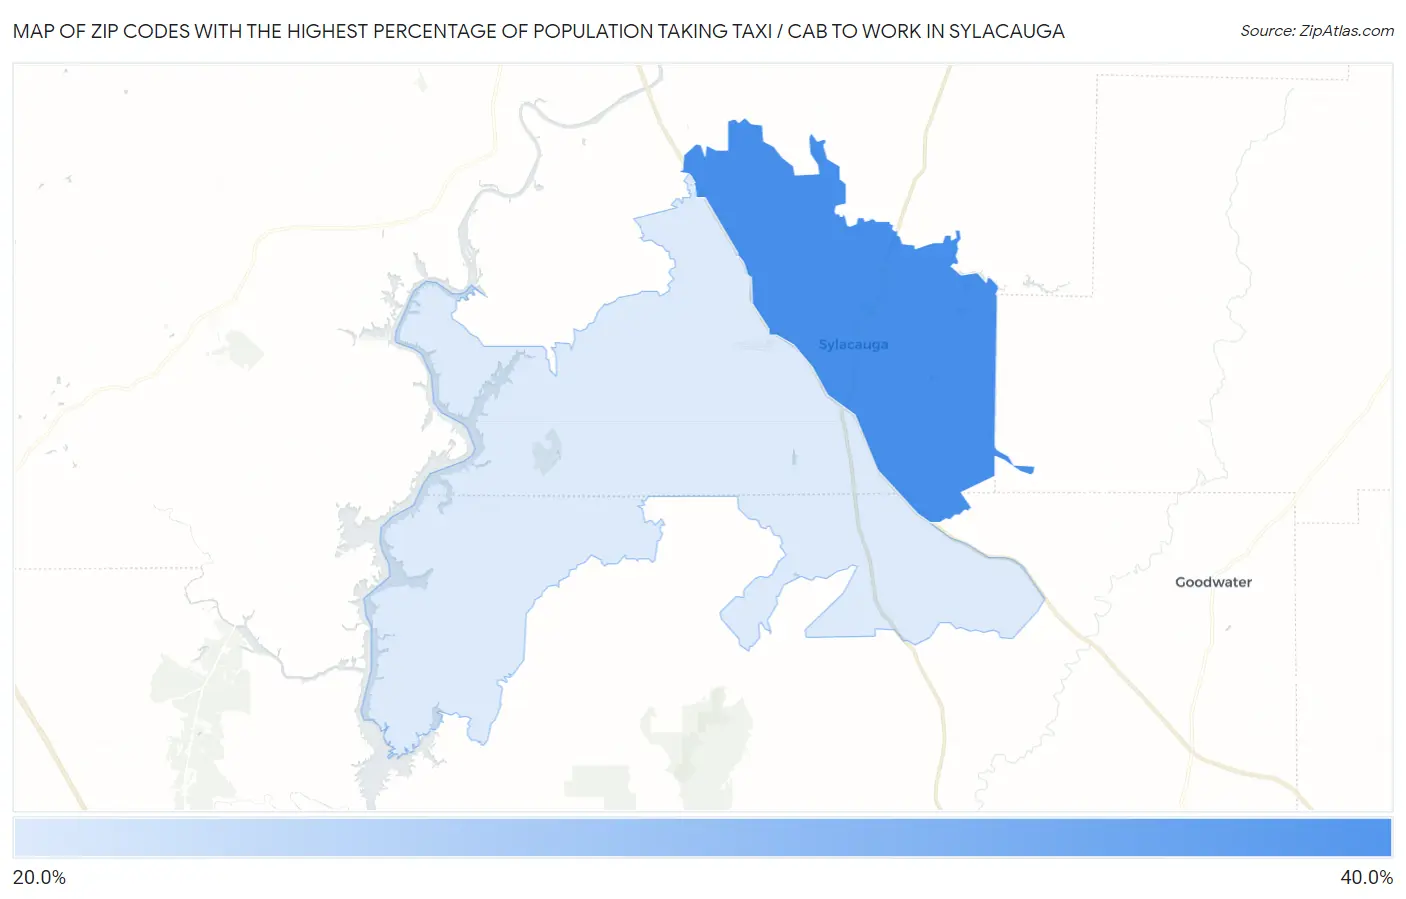
Map of Zip Codes with the Highest Percentage of Population Taking Taxi / Cab to Work in Sylacauga
22.9%
34.8%
Zip Codes with the Highest Percentage of Population Taking Taxi / Cab to Work in Sylacauga, AL
| Zip Code | % Take Taxi / Cab | vs State | vs National | |
| 1. | 35150 | 34.8% | 42.0%(-7.20)#127 | 38.2%(-3.40)#8,988 |
| 2. | 35151 | 22.9% | 42.0%(-19.1)#166 | 38.2%(-15.3)#12,647 |
1
Common Questions
What are the Top Zip Codes with the Highest Percentage of Population Taking Taxi / Cab to Work in Sylacauga, AL?
Top Zip Codes with the Highest Percentage of Population Taking Taxi / Cab to Work in Sylacauga, AL are:
What zip code has the Highest Percentage of Population Taking Taxi / Cab to Work in Sylacauga, AL?
35150 has the Highest Percentage of Population Taking Taxi / Cab to Work in Sylacauga, AL with 34.8%.
What is the Percentage of Population Taking Taxi / Cab to Work in Alabama?
Percentage of Population Taking Taxi / Cab to Work in Alabama is 42.0%.
What is the Percentage of Population Taking Taxi / Cab to Work in the United States?
Percentage of Population Taking Taxi / Cab to Work in the United States is 38.2%.