Zip Codes with the Highest Percentage of Households Heated by Bottled Gas / Liquid Propane in Sylacauga, AL
RELATED REPORTS & OPTIONS
Bottled Gas / LP Heating
Sylacauga
Compare Zip Codes
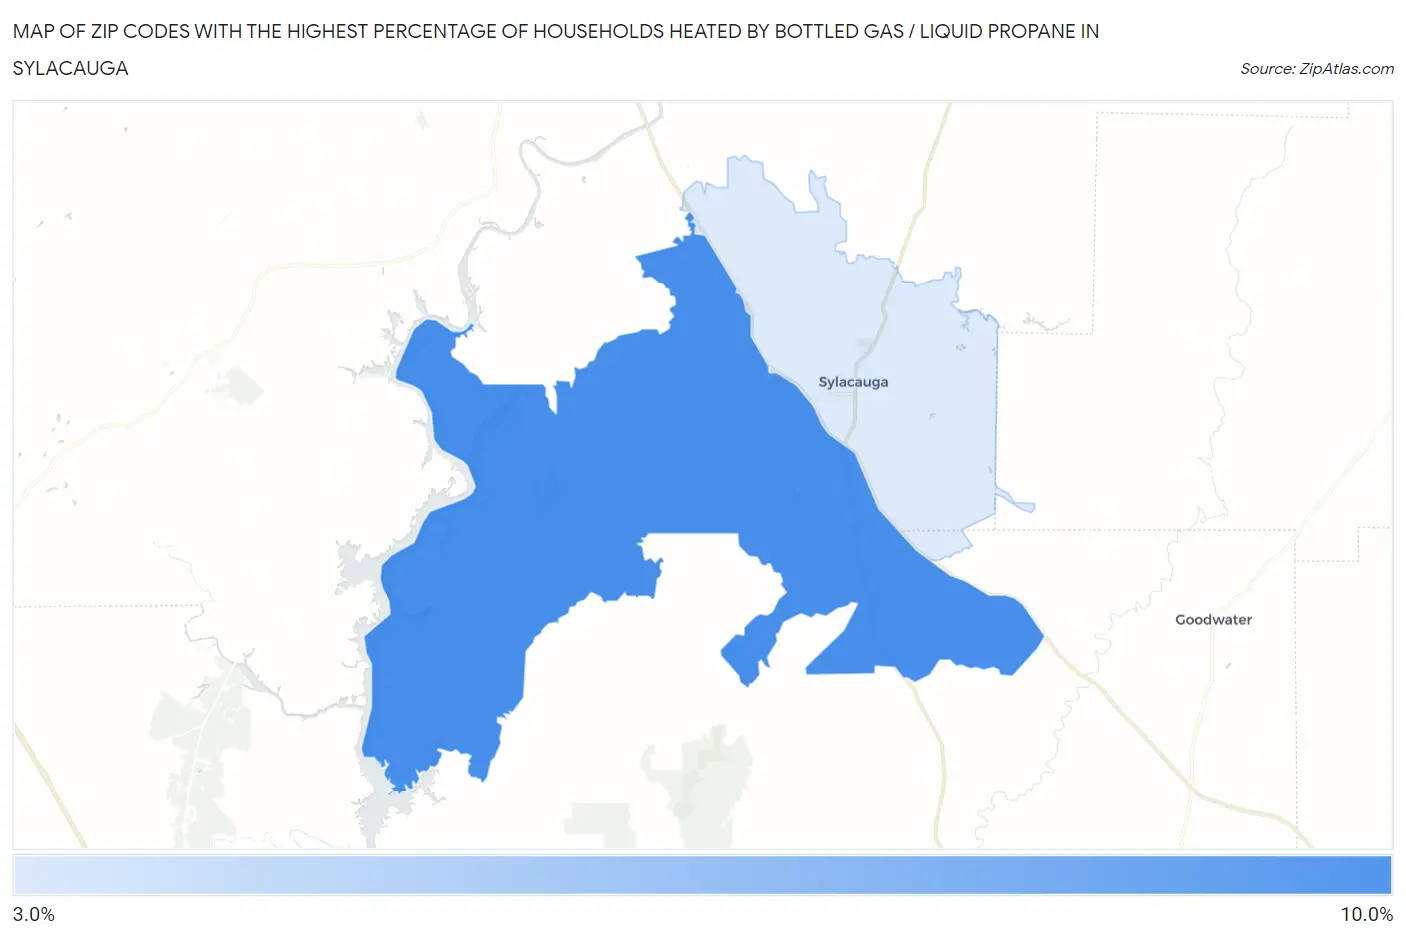
Map of Zip Codes with the Highest Percentage of Households Heated by Bottled Gas / Liquid Propane in Sylacauga
4.0%
9.7%
Zip Codes with the Highest Percentage of Households Heated by Bottled Gas / Liquid Propane in Sylacauga, AL
| Zip Code | Bottled Gas / LP Heating | vs State | vs National | |
| 1. | 35151 | 9.7% | 5.4%(+4.30)#266 | 4.9%(+4.80)#14,678 |
| 2. | 35150 | 4.0% | 5.4%(-1.40)#389 | 4.9%(-0.900)#19,641 |
1
Common Questions
What are the Top Zip Codes with the Highest Percentage of Households Heated by Bottled Gas / Liquid Propane in Sylacauga, AL?
Top Zip Codes with the Highest Percentage of Households Heated by Bottled Gas / Liquid Propane in Sylacauga, AL are:
What zip code has the Highest Percentage of Households Heated by Bottled Gas / Liquid Propane in Sylacauga, AL?
35151 has the Highest Percentage of Households Heated by Bottled Gas / Liquid Propane in Sylacauga, AL with 9.7%.
What is the Percentage of Households Heated by Bottled Gas / Liquid Propane in Sylacauga, AL?
Percentage of Households Heated by Bottled Gas / Liquid Propane in Sylacauga is 2.0%.
What is the Percentage of Households Heated by Bottled Gas / Liquid Propane in Alabama?
Percentage of Households Heated by Bottled Gas / Liquid Propane in Alabama is 5.4%.
What is the Percentage of Households Heated by Bottled Gas / Liquid Propane in the United States?
Percentage of Households Heated by Bottled Gas / Liquid Propane in the United States is 4.9%.