Zip Codes with the Highest Percentage of Households with Income Above $200,000 in Mobile, AL
RELATED REPORTS & OPTIONS
Household Income | $200k+
Mobile
Compare Zip Codes
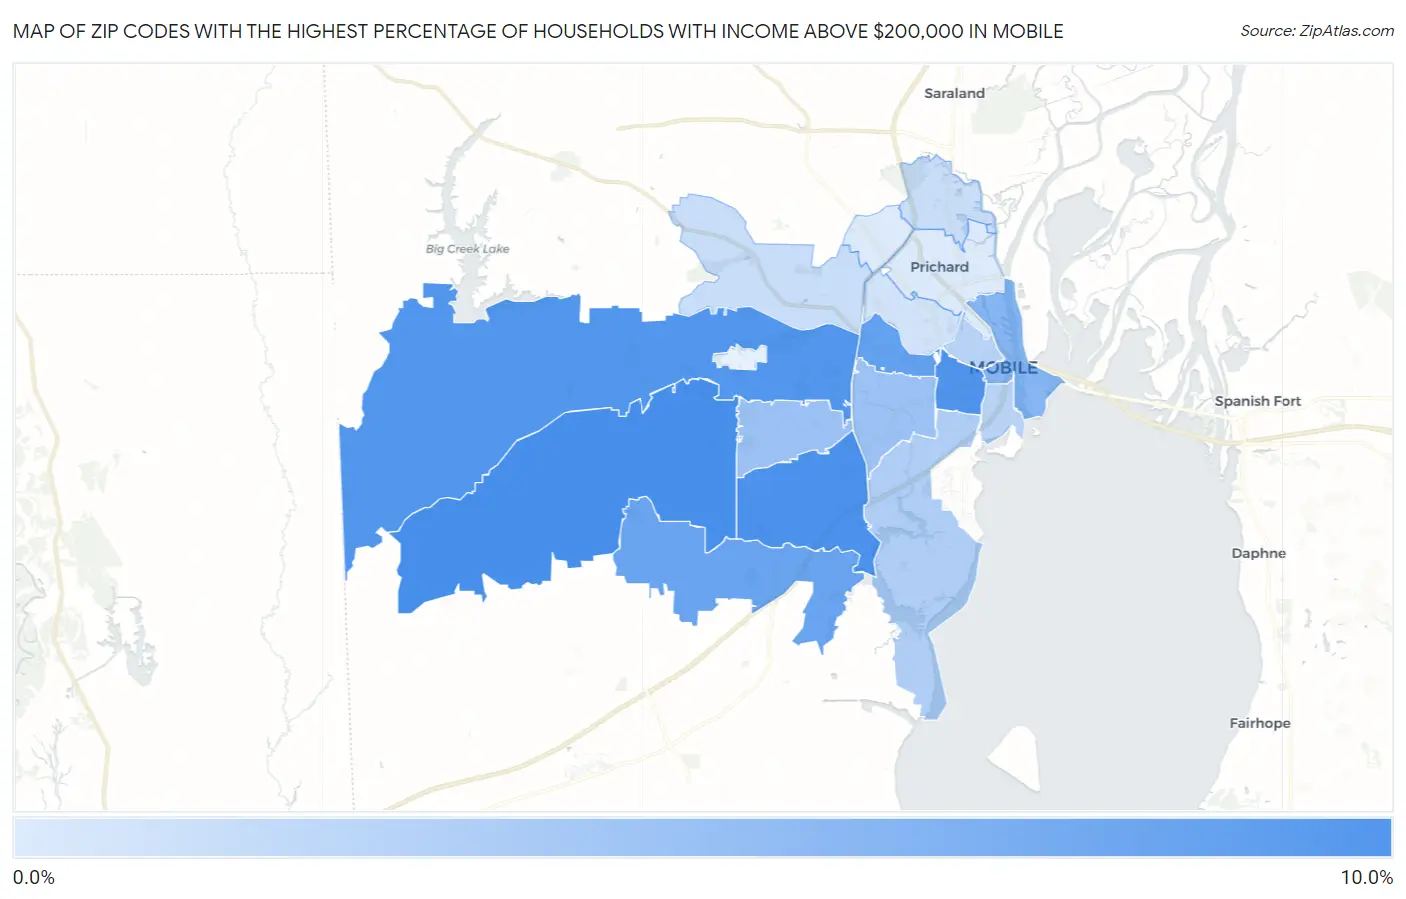
Map of Zip Codes with the Highest Percentage of Households with Income Above $200,000 in Mobile
0.70%
8.1%
Zip Codes with the Highest Percentage of Households with Income Above $200,000 in Mobile, AL
| Zip Code | Households with Income > $200k | vs State | vs National | |
| 1. | 36695 | 8.1% | 6.5%(+1.60)#94 | 11.4%(-3.30)#10,215 |
| 2. | 36693 | 7.9% | 6.5%(+1.40)#98 | 11.4%(-3.50)#10,505 |
| 3. | 36604 | 7.8% | 6.5%(+1.30)#102 | 11.4%(-3.60)#10,655 |
| 4. | 36608 | 7.5% | 6.5%(+1.000)#106 | 11.4%(-3.90)#11,038 |
| 5. | 36607 | 6.7% | 6.5%(+0.200)#138 | 11.4%(-4.70)#12,272 |
| 6. | 36619 | 6.3% | 6.5%(-0.200)#150 | 11.4%(-5.10)#12,935 |
| 7. | 36602 | 5.0% | 6.5%(-1.50)#200 | 11.4%(-6.40)#15,761 |
| 8. | 36606 | 3.9% | 6.5%(-2.60)#261 | 11.4%(-7.50)#18,369 |
| 9. | 36609 | 3.8% | 6.5%(-2.70)#268 | 11.4%(-7.60)#18,611 |
| 10. | 36605 | 2.9% | 6.5%(-3.60)#331 | 11.4%(-8.50)#21,160 |
| 11. | 36603 | 2.5% | 6.5%(-4.00)#378 | 11.4%(-8.90)#22,402 |
| 12. | 36618 | 1.7% | 6.5%(-4.80)#426 | 11.4%(-9.70)#24,562 |
| 13. | 36611 | 1.7% | 6.5%(-4.80)#431 | 11.4%(-9.70)#24,615 |
| 14. | 36617 | 1.2% | 6.5%(-5.30)#470 | 11.4%(-10.2)#25,770 |
| 15. | 36610 | 0.70% | 6.5%(-5.80)#503 | 11.4%(-10.7)#26,749 |
| 16. | 36612 | 0.70% | 6.5%(-5.80)#504 | 11.4%(-10.7)#26,781 |
1
Common Questions
What are the Top 10 Zip Codes with the Highest Percentage of Households with Income Above $200,000 in Mobile, AL?
Top 10 Zip Codes with the Highest Percentage of Households with Income Above $200,000 in Mobile, AL are:
What zip code has the Highest Percentage of Households with Income Above $200,000 in Mobile, AL?
36695 has the Highest Percentage of Households with Income Above $200,000 in Mobile, AL with 8.1%.
What is the Percentage of Households with Income Above $200,000 in Mobile, AL?
Percentage of Households with Income Above $200,000 in Mobile is 5.1%.
What is the Percentage of Households with Income Above $200,000 in Alabama?
Percentage of Households with Income Above $200,000 in Alabama is 6.5%.
What is the Percentage of Households with Income Above $200,000 in the United States?
Percentage of Households with Income Above $200,000 in the United States is 11.4%.