Zip Codes with the Highest Percentage of Population with a Degree in Communications in Mobile, AL
RELATED REPORTS & OPTIONS
Communications
Mobile
Compare Zip Codes
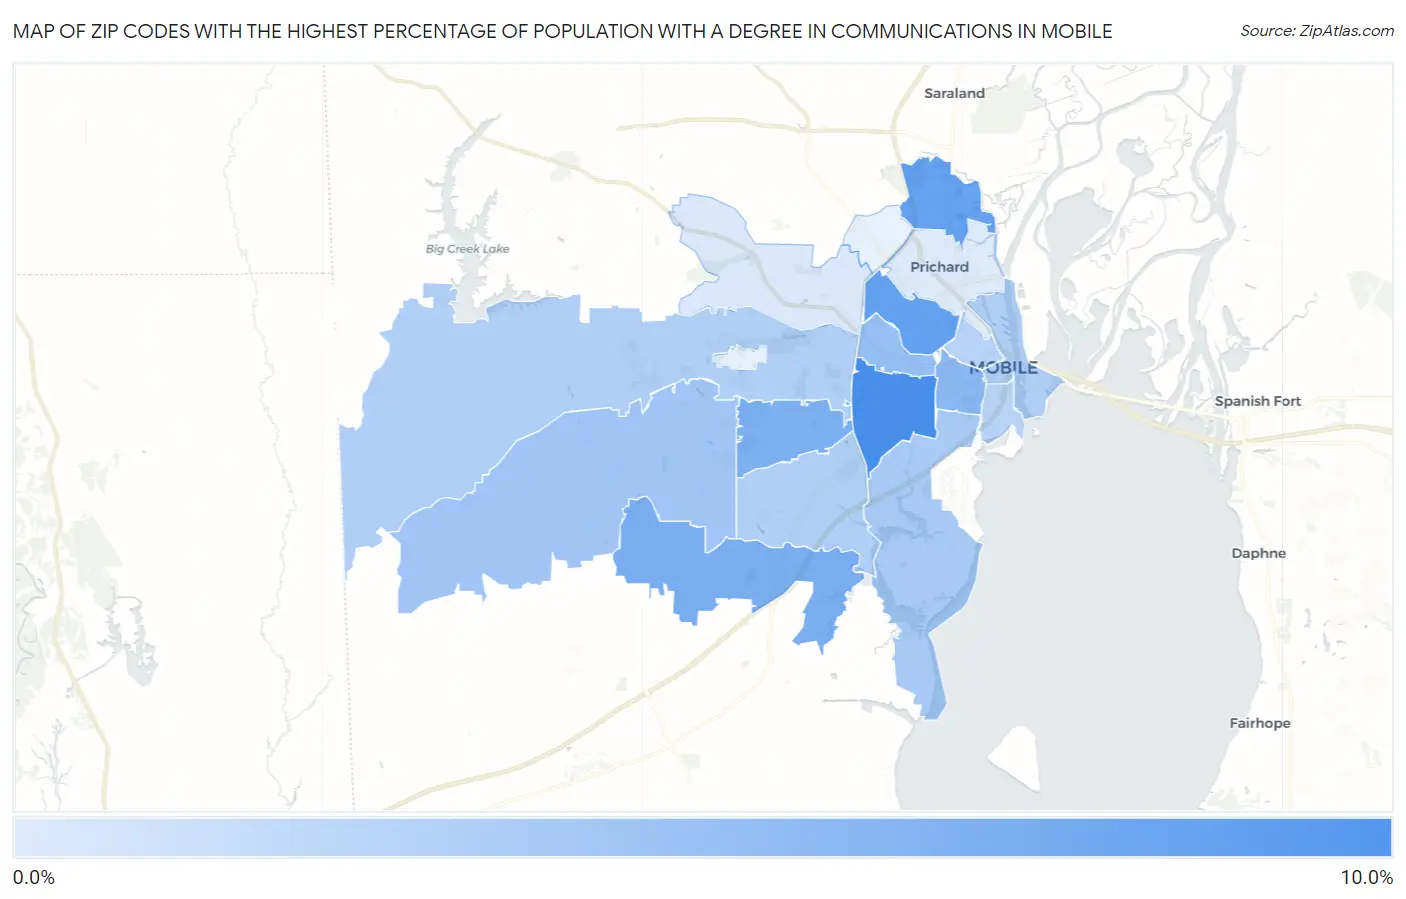
Map of Zip Codes with the Highest Percentage of Population with a Degree in Communications in Mobile
1.2%
8.6%
Zip Codes with the Highest Percentage of Population with a Degree in Communications in Mobile, AL
| Zip Code | % Graduates | vs State | vs National | |
| 1. | 36606 | 8.6% | 3.2%(+5.41)#20 | 4.1%(+4.45)#1,602 |
| 2. | 36617 | 7.2% | 3.2%(+4.03)#29 | 4.1%(+3.07)#2,431 |
| 3. | 36611 | 7.1% | 3.2%(+3.89)#31 | 4.1%(+2.93)#2,544 |
| 4. | 36619 | 6.0% | 3.2%(+2.87)#35 | 4.1%(+1.91)#3,713 |
| 5. | 36609 | 6.0% | 3.2%(+2.78)#39 | 4.1%(+1.82)#3,848 |
| 6. | 36604 | 5.2% | 3.2%(+2.03)#68 | 4.1%(+1.07)#5,241 |
| 7. | 36607 | 4.7% | 3.2%(+1.53)#81 | 4.1%(+0.566)#6,405 |
| 8. | 36695 | 4.1% | 3.2%(+0.946)#103 | 4.1%(-0.017)#8,166 |
| 9. | 36605 | 3.8% | 3.2%(+0.610)#119 | 4.1%(-0.353)#9,343 |
| 10. | 36602 | 3.4% | 3.2%(+0.266)#135 | 4.1%(-0.697)#10,568 |
| 11. | 36608 | 3.3% | 3.2%(+0.166)#141 | 4.1%(-0.797)#10,920 |
| 12. | 36693 | 3.3% | 3.2%(+0.125)#145 | 4.1%(-0.838)#11,073 |
| 13. | 36603 | 2.9% | 3.2%(-0.227)#173 | 4.1%(-1.19)#12,407 |
| 14. | 36618 | 1.3% | 3.2%(-1.89)#279 | 4.1%(-2.85)#18,168 |
| 15. | 36610 | 1.2% | 3.2%(-1.99)#290 | 4.1%(-2.95)#18,461 |
1
Common Questions
What are the Top 10 Zip Codes with the Highest Percentage of Population with a Degree in Communications in Mobile, AL?
Top 10 Zip Codes with the Highest Percentage of Population with a Degree in Communications in Mobile, AL are:
What zip code has the Highest Percentage of Population with a Degree in Communications in Mobile, AL?
36606 has the Highest Percentage of Population with a Degree in Communications in Mobile, AL with 8.6%.
What is the Percentage of Population with a Degree in Communications in Mobile, AL?
Percentage of Population with a Degree in Communications in Mobile is 4.6%.
What is the Percentage of Population with a Degree in Communications in Alabama?
Percentage of Population with a Degree in Communications in Alabama is 3.2%.
What is the Percentage of Population with a Degree in Communications in the United States?
Percentage of Population with a Degree in Communications in the United States is 4.1%.