Somali Female Disability
COMPARE
Somali
Select to Compare
Female Disability
Somali Female Disability
12.3%
DISABILITY | FEMALES
21.5/ 100
METRIC RATING
202nd/ 347
METRIC RANK
Somali Female Disability Correlation Chart
The statistical analysis conducted on geographies consisting of 99,314,959 people shows a mild positive correlation between the proportion of Somalis and percentage of females with a disability in the United States with a correlation coefficient (R) of 0.325 and weighted average of 12.3%. On average, for every 1% (one percent) increase in Somalis within a typical geography, there is an increase of 0.11% in percentage of females with a disability.
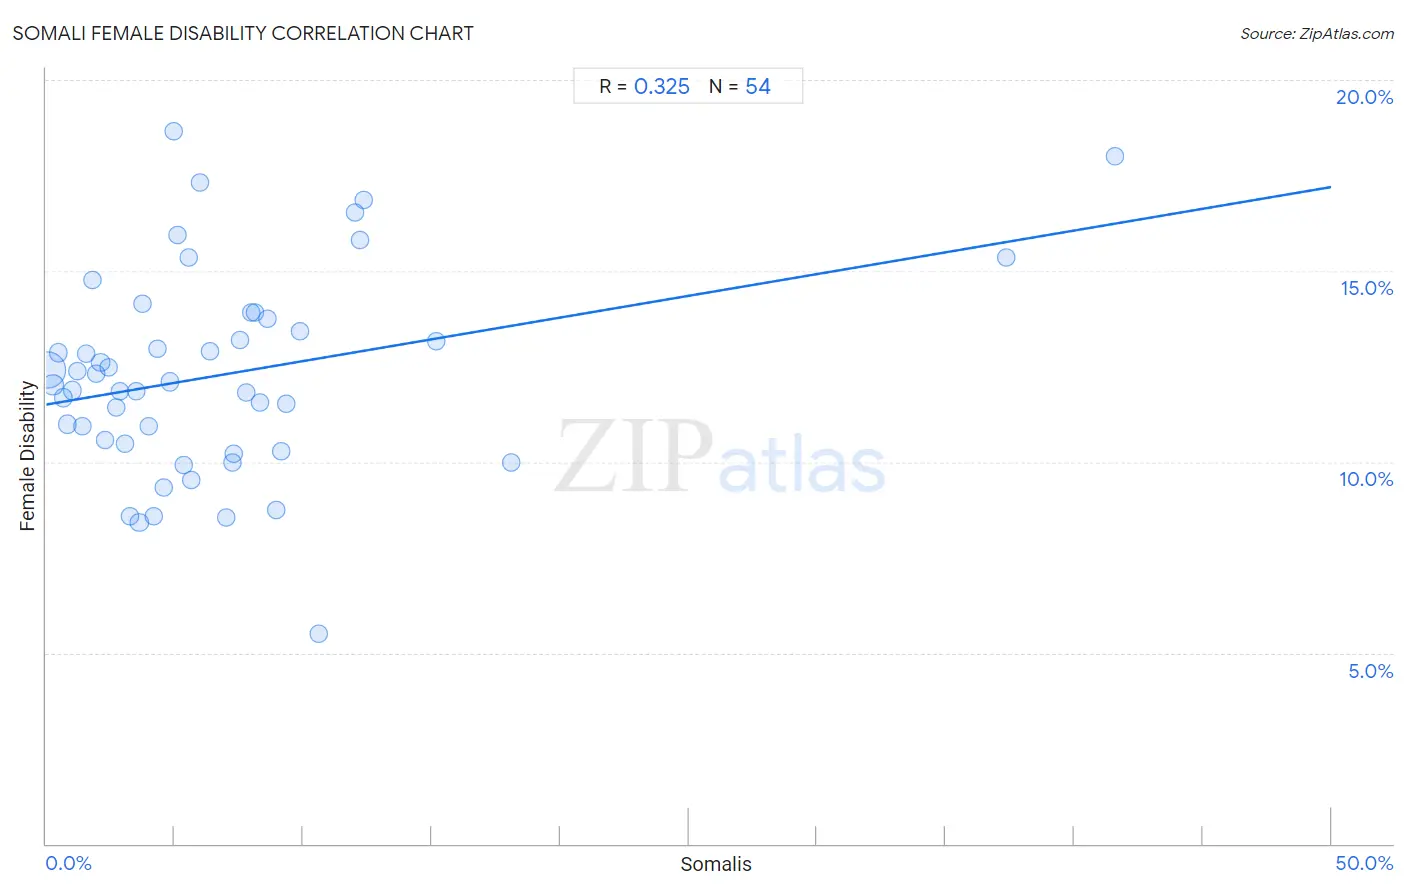
It is essential to understand that the correlation between the percentage of Somalis and percentage of females with a disability does not imply a direct cause-and-effect relationship. It remains uncertain whether the presence of Somalis influences an upward or downward trend in the level of percentage of females with a disability within an area, or if Somalis simply ended up residing in those areas with higher or lower levels of percentage of females with a disability due to other factors.
Demographics Similar to Somalis by Female Disability
In terms of female disability, the demographic groups most similar to Somalis are Immigrants from Barbados (12.3%, a difference of 0.020%), Chinese (12.3%, a difference of 0.030%), Trinidadian and Tobagonian (12.3%, a difference of 0.040%), Immigrants from Zaire (12.3%, a difference of 0.040%), and Immigrants from Grenada (12.4%, a difference of 0.060%).
| Demographics | Rating | Rank | Female Disability |
| Swedes | 26.6 /100 | #195 | Fair 12.3% |
| Immigrants from Panama | 25.5 /100 | #196 | Fair 12.3% |
| Hondurans | 25.4 /100 | #197 | Fair 12.3% |
| Mexican American Indians | 24.9 /100 | #198 | Fair 12.3% |
| Immigrants from Trinidad and Tobago | 24.7 /100 | #199 | Fair 12.3% |
| Trinidadians and Tobagonians | 22.4 /100 | #200 | Fair 12.3% |
| Chinese | 22.1 /100 | #201 | Fair 12.3% |
| Somalis | 21.5 /100 | #202 | Fair 12.3% |
| Immigrants from Barbados | 21.1 /100 | #203 | Fair 12.3% |
| Immigrants from Zaire | 20.9 /100 | #204 | Fair 12.3% |
| Immigrants from Grenada | 20.5 /100 | #205 | Fair 12.4% |
| Immigrants from Cuba | 20.2 /100 | #206 | Fair 12.4% |
| Croatians | 20.2 /100 | #207 | Fair 12.4% |
| Basques | 17.5 /100 | #208 | Poor 12.4% |
| Mexicans | 15.7 /100 | #209 | Poor 12.4% |
Somali Female Disability Correlation Summary
| Measurement | Somali Data | Female Disability Data |
| Minimum | 0.041% | 5.5% |
| Maximum | 41.6% | 18.6% |
| Range | 41.5% | 13.1% |
| Mean | 6.8% | 12.3% |
| Median | 5.0% | 12.1% |
| Interquartile 25% (IQ1) | 2.4% | 10.5% |
| Interquartile 75% (IQ3) | 8.3% | 13.7% |
| Interquartile Range (IQR) | 5.9% | 3.3% |
| Standard Deviation (Sample) | 7.6% | 2.7% |
| Standard Deviation (Population) | 7.5% | 2.6% |
Correlation Details
| Somali Percentile | Sample Size | Female Disability |
[ 0.0% - 0.5% ] 0.041% | 72,710,999 | 12.4% |
[ 0.0% - 0.5% ] 0.26% | 10,925,443 | 12.0% |
[ 0.0% - 0.5% ] 0.47% | 3,174,233 | 12.9% |
[ 0.5% - 1.0% ] 0.66% | 3,144,581 | 11.7% |
[ 0.5% - 1.0% ] 0.82% | 1,266,200 | 11.0% |
[ 1.0% - 1.5% ] 1.04% | 1,007,768 | 11.9% |
[ 1.0% - 1.5% ] 1.20% | 1,112,008 | 12.4% |
[ 1.0% - 1.5% ] 1.40% | 451,040 | 10.9% |
[ 1.5% - 2.0% ] 1.57% | 659,255 | 12.8% |
[ 1.5% - 2.0% ] 1.78% | 187,013 | 14.8% |
[ 1.5% - 2.0% ] 1.95% | 580,421 | 12.3% |
[ 2.0% - 2.5% ] 2.11% | 250,869 | 12.6% |
[ 2.0% - 2.5% ] 2.28% | 145,784 | 10.6% |
[ 2.0% - 2.5% ] 2.44% | 970,275 | 12.5% |
[ 2.5% - 3.0% ] 2.72% | 220,129 | 11.4% |
[ 2.5% - 3.0% ] 2.86% | 236,661 | 11.9% |
[ 3.0% - 3.5% ] 3.06% | 186,812 | 10.5% |
[ 3.0% - 3.5% ] 3.24% | 143,512 | 8.6% |
[ 3.5% - 4.0% ] 3.51% | 172,840 | 11.9% |
[ 3.5% - 4.0% ] 3.62% | 104,916 | 8.4% |
[ 3.5% - 4.0% ] 3.74% | 17,641 | 14.1% |
[ 3.5% - 4.0% ] 3.99% | 205,658 | 10.9% |
[ 4.0% - 4.5% ] 4.17% | 3,548 | 8.6% |
[ 4.0% - 4.5% ] 4.33% | 54,028 | 12.9% |
[ 4.5% - 5.0% ] 4.58% | 21,569 | 9.3% |
[ 4.5% - 5.0% ] 4.80% | 510,556 | 12.1% |
[ 4.5% - 5.0% ] 4.95% | 122,965 | 18.6% |
[ 5.0% - 5.5% ] 5.11% | 17,532 | 15.9% |
[ 5.0% - 5.5% ] 5.36% | 30,641 | 9.9% |
[ 5.5% - 6.0% ] 5.57% | 88,768 | 15.4% |
[ 5.5% - 6.0% ] 5.65% | 177 | 9.5% |
[ 5.5% - 6.0% ] 5.97% | 23,433 | 17.3% |
[ 6.0% - 6.5% ] 6.37% | 68,910 | 12.9% |
[ 7.0% - 7.5% ] 7.01% | 67,999 | 8.5% |
[ 7.0% - 7.5% ] 7.23% | 42,581 | 10.0% |
[ 7.0% - 7.5% ] 7.31% | 26,760 | 10.2% |
[ 7.5% - 8.0% ] 7.53% | 32,681 | 13.2% |
[ 7.5% - 8.0% ] 7.77% | 30,973 | 11.8% |
[ 7.5% - 8.0% ] 7.98% | 61,423 | 13.9% |
[ 8.0% - 8.5% ] 8.11% | 13,956 | 13.9% |
[ 8.0% - 8.5% ] 8.30% | 24,067 | 11.6% |
[ 8.5% - 9.0% ] 8.63% | 22,827 | 13.7% |
[ 8.5% - 9.0% ] 8.95% | 14,759 | 8.7% |
[ 9.0% - 9.5% ] 9.13% | 23,110 | 10.3% |
[ 9.0% - 9.5% ] 9.36% | 5,984 | 11.5% |
[ 9.5% - 10.0% ] 9.85% | 24,418 | 13.4% |
[ 10.5% - 11.0% ] 10.62% | 631 | 5.5% |
[ 12.0% - 12.5% ] 12.03% | 32,136 | 16.5% |
[ 12.0% - 12.5% ] 12.22% | 30,625 | 15.8% |
[ 12.0% - 12.5% ] 12.34% | 28,172 | 16.9% |
[ 15.0% - 15.5% ] 15.16% | 3,693 | 13.2% |
[ 18.0% - 18.5% ] 18.08% | 1,930 | 10.0% |
[ 37.0% - 37.5% ] 37.34% | 1,157 | 15.4% |
[ 41.5% - 42.0% ] 41.59% | 8,892 | 18.0% |