Laotian Male Disability

COMPARE

Laotian
Race
Ancestry
AfghanAfricanAlaska NativeAlaskan AthabascanAlbanianAleutAlsatianAmericanApacheArabArapahoArgentineanArmenianAssyrian/Chaldean/SyriacAustralianAustrianBahamianBangladeshiBarbadianBasqueBelgianBelizeanBermudanBhutaneseBlackfeetBolivianBrazilianBritishBritish West IndianBulgarianBurmeseCajunCambodianCanadianCape VerdeanCarpatho RusynCelticCentral AmericanCentral American IndianCherokeeCheyenneChickasawChileanChineseChippewaChoctawColombianColvilleComancheCosta RicanCreeCreekCroatianCrowCubanCypriotCzechCzechoslovakianDanishDelawareDominicanDutchDutch West IndianEastern EuropeanEcuadorianEgyptianEnglishEstonianEthiopianEuropeanFijianFilipinoFinnishFrenchFrench American IndianFrench CanadianGermanGerman RussianGhanaianGreekGuamanian/ChamorroGuatemalanGuyaneseHaitianHmongHonduranHopiHoumaHungarianIcelanderIndian (Asian)IndonesianInupiatIranianIraqiIrishIroquoisIsraeliItalianJamaicanJapaneseJordanianKenyanKiowaKoreanLaotianLatvianLebaneseLiberianLithuanianLumbeeLuxembourgerMacedonianMalaysianMalteseMarshalleseMenomineeMexicanMexican American IndianMongolianMoroccanNative HawaiianNavajoNepaleseNew ZealanderNicaraguanNigerianNorthern EuropeanNorwegianOkinawanOsageOttawaPaiutePakistaniPalestinianPanamanianParaguayanPennsylvania GermanPeruvianPimaPolishPortuguesePotawatomiPuebloPuerto RicanPuget Sound SalishRomanianRussianSalvadoranSamoanScandinavianScotch-IrishScottishSeminoleSenegaleseSerbianShoshoneSierra LeoneanSiouxSlavicSlovakSloveneSomaliSouth AfricanSouth AmericanSouth American IndianSoviet UnionSpaniardSpanishSpanish AmericanSpanish American IndianSri LankanSubsaharan AfricanSudaneseSwedishSwissSyrianTaiwaneseThaiTlingit-HaidaTohono O'OdhamTonganTrinidadian and TobagonianTsimshianTurkishU.S. Virgin IslanderUgandanUkrainianUruguayanUteVenezuelanVietnameseWelshWest IndianYakamaYaquiYugoslavianYumanYup'ikZimbabwean
Immigration
NonimmigrantsImmigrantsAfghanistanAfricaAlbaniaArgentinaArmeniaAsiaAustraliaAustriaBahamasBangladeshBarbadosBelarusBelgiumBelizeBoliviaBosnia and HerzegovinaBrazilBulgariaBurma/MyanmarCabo VerdeCambodiaCameroonCanadaCaribbeanCentral AmericaChileChinaColombiaCongoCosta RicaCroatiaCubaCzechoslovakiaDenmarkDominicaDominican RepublicEastern AfricaEastern AsiaEastern EuropeEcuadorEgyptEl SalvadorEnglandEritreaEthiopiaEuropeFijiFranceGermanyGhanaGreeceGrenadaGuatemalaGuyanaHaitiHondurasHong KongHungaryIndiaIndonesiaIranIraqIrelandIsraelItalyJamaicaJapanJordanKazakhstanKenyaKoreaKuwaitLaosLatin AmericaLatviaLebanonLiberiaLithuaniaMalaysiaMexicoMicronesiaMiddle AfricaMoldovaMoroccoNepalNetherlandsNicaraguaNigeriaNorth AmericaNorth MacedoniaNorthern AfricaNorthern EuropeNorwayOceaniaPakistanPanamaPeruPhilippinesPolandPortugalRomaniaRussiaSaudi ArabiaScotlandSenegalSerbiaSierra LeoneSingaporeSomaliaSouth AfricaSouth AmericaSouth Central AsiaSouth Eastern AsiaSouthern EuropeSpainSri LankaSt. Vincent and the GrenadinesSudanSwedenSwitzerlandSyriaTaiwanThailandTrinidad and TobagoTurkeyUgandaUkraineUruguayUzbekistanVenezuelaVietnamWest IndiesWestern AfricaWestern AsiaWestern EuropeYemenZaireZimbabweAzores
Select to Compare
Race
Ancestry
AfghanAfricanAlaska NativeAlaskan AthabascanAlbanianAleutAlsatianAmericanApacheArabArapahoArgentineanArmenianAssyrian/Chaldean/SyriacAustralianAustrianBahamianBangladeshiBarbadianBasqueBelgianBelizeanBermudanBhutaneseBlackfeetBolivianBrazilianBritishBritish West IndianBulgarianBurmeseCajunCambodianCanadianCape VerdeanCarpatho RusynCelticCentral AmericanCentral American IndianCherokeeCheyenneChickasawChileanChineseChippewaChoctawColombianColvilleComancheCosta RicanCreeCreekCroatianCrowCubanCypriotCzechCzechoslovakianDanishDelawareDominicanDutchDutch West IndianEastern EuropeanEcuadorianEgyptianEnglishEstonianEthiopianEuropeanFijianFilipinoFinnishFrenchFrench American IndianFrench CanadianGermanGerman RussianGhanaianGreekGuamanian/ChamorroGuatemalanGuyaneseHaitianHmongHonduranHopiHoumaHungarianIcelanderIndian (Asian)IndonesianInupiatIranianIraqiIrishIroquoisIsraeliItalianJamaicanJapaneseJordanianKenyanKiowaKoreanLatvianLebaneseLiberianLithuanianLumbeeLuxembourgerMacedonianMalaysianMalteseMarshalleseMenomineeMexicanMexican American IndianMongolianMoroccanNative HawaiianNavajoNepaleseNew ZealanderNicaraguanNigerianNorthern EuropeanNorwegianOkinawanOsageOttawaPaiutePakistaniPalestinianPanamanianParaguayanPennsylvania GermanPeruvianPimaPolishPortuguesePotawatomiPuebloPuerto RicanPuget Sound SalishRomanianRussianSalvadoranSamoanScandinavianScotch-IrishScottishSeminoleSenegaleseSerbianShoshoneSierra LeoneanSiouxSlavicSlovakSloveneSomaliSouth AfricanSouth AmericanSouth American IndianSoviet UnionSpaniardSpanishSpanish AmericanSpanish American IndianSri LankanSubsaharan AfricanSudaneseSwedishSwissSyrianTaiwaneseThaiTlingit-HaidaTohono O'OdhamTonganTrinidadian and TobagonianTsimshianTurkishU.S. Virgin IslanderUgandanUkrainianUruguayanUteVenezuelanVietnameseWelshWest IndianYakamaYaquiYugoslavianYumanYup'ikZimbabwean
Immigration
NonimmigrantsImmigrantsAfghanistanAfricaAlbaniaArgentinaArmeniaAsiaAustraliaAustriaBahamasBangladeshBarbadosBelarusBelgiumBelizeBoliviaBosnia and HerzegovinaBrazilBulgariaBurma/MyanmarCabo VerdeCambodiaCameroonCanadaCaribbeanCentral AmericaChileChinaColombiaCongoCosta RicaCroatiaCubaCzechoslovakiaDenmarkDominicaDominican RepublicEastern AfricaEastern AsiaEastern EuropeEcuadorEgyptEl SalvadorEnglandEritreaEthiopiaEuropeFijiFranceGermanyGhanaGreeceGrenadaGuatemalaGuyanaHaitiHondurasHong KongHungaryIndiaIndonesiaIranIraqIrelandIsraelItalyJamaicaJapanJordanKazakhstanKenyaKoreaKuwaitLaosLatin AmericaLatviaLebanonLiberiaLithuaniaMalaysiaMexicoMicronesiaMiddle AfricaMoldovaMoroccoNepalNetherlandsNicaraguaNigeriaNorth AmericaNorth MacedoniaNorthern AfricaNorthern EuropeNorwayOceaniaPakistanPanamaPeruPhilippinesPolandPortugalRomaniaRussiaSaudi ArabiaScotlandSenegalSerbiaSierra LeoneSingaporeSomaliaSouth AfricaSouth AmericaSouth Central AsiaSouth Eastern AsiaSouthern EuropeSpainSri LankaSt. Vincent and the GrenadinesSudanSwedenSwitzerlandSyriaTaiwanThailandTrinidad and TobagoTurkeyUgandaUkraineUruguayUzbekistanVenezuelaVietnamWest IndiesWestern AfricaWestern AsiaWestern EuropeYemenZaireZimbabweAzores
Male Disability
Income
Poverty
Unemployment
Labor Participation
Family Structure
Vehicle Availability
Education Level
Disability

Laotian Male Disability
Exceptional

10.6%
DISABILITY | MALES
98.6/ 100
METRIC RATING
77th/ 347
METRIC RANK

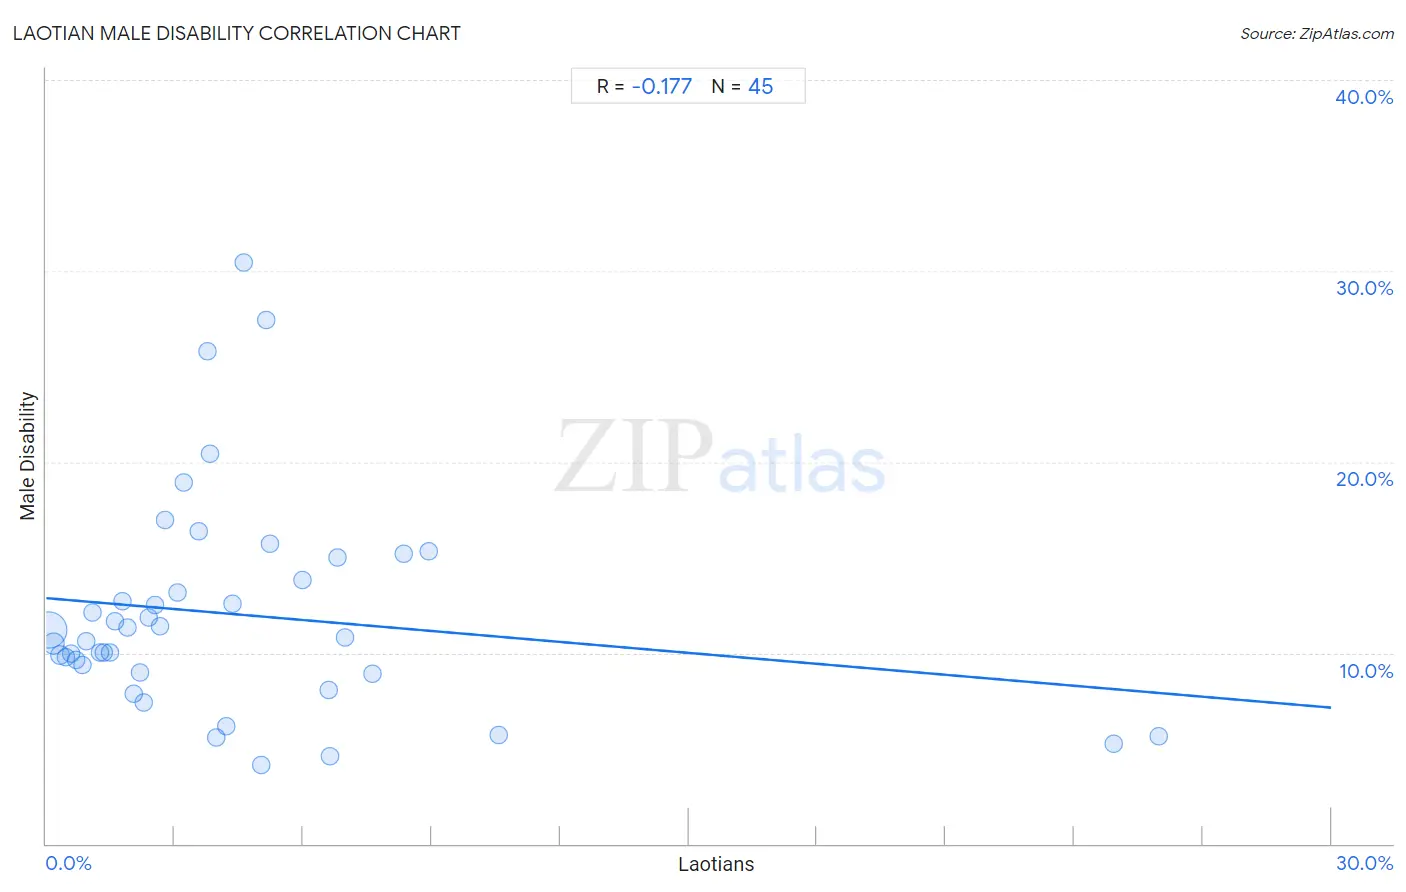
Laotian Male Disability Correlation Chart

The statistical analysis conducted on geographies consisting of 224,854,560 people shows a poor negative correlation between the proportion of Laotians and percentage of males with a disability in the United States with a correlation coefficient (R) of -0.177 and weighted average of 10.6%. On average, for every 1% (one percent) increase in Laotians within a typical geography, there is a decrease of 0.19% in percentage of males with a disability.
Laotian Male Disability
It is essential to understand that the correlation between the percentage of Laotians and percentage of males with a disability does not imply a direct cause-and-effect relationship. It remains uncertain whether the presence of Laotians influences an upward or downward trend in the level of percentage of males with a disability within an area, or if Laotians simply ended up residing in those areas with higher or lower levels of percentage of males with a disability due to other factors.

Demographics Similar to Laotians by Male Disability

In terms of male disability, the demographic groups most similar to Laotians are Immigrants from Russia (10.6%, a difference of 0.020%), Immigrants from Sierra Leone (10.5%, a difference of 0.060%), Sierra Leonean (10.5%, a difference of 0.10%), Immigrants from Lebanon (10.5%, a difference of 0.21%), and Zimbabwean (10.6%, a difference of 0.25%).
DemographicsRating | RankMale Disability
Immigrants from Bulgaria
99.1
/100
|
#70
Exceptional
10.5%
Immigrants from Cameroon
99.0
/100
|
#71
Exceptional
10.5%
Immigrants from Serbia
99.0
/100
|
#72
Exceptional
10.5%
Immigrants from Lithuania
98.9
/100
|
#73
Exceptional
10.5%
Immigrants from Lebanon
98.8
/100
|
#74
Exceptional
10.5%
Sierra Leoneans
98.7
/100
|
#75
Exceptional
10.5%
Immigrants from Sierra Leone
98.7
/100
|
#76
Exceptional
10.5%
Laotians
98.6
/100
|
#77
Exceptional
10.6%
Immigrants from Russia
98.6
/100
|
#78
Exceptional
10.6%
Zimbabweans
98.4
/100
|
#79
Exceptional
10.6%
Immigrants from Jordan
98.4
/100
|
#80
Exceptional
10.6%
Immigrants from Chile
98.3
/100
|
#81
Exceptional
10.6%
Immigrants from Guyana
98.2
/100
|
#82
Exceptional
10.6%
Immigrants from Poland
98.1
/100
|
#83
Exceptional
10.6%
Bulgarians
98.1
/100
|
#84
Exceptional
10.6%

Laotian Male Disability Correlation Summary

MeasurementLaotian DataMale Disability Data
Minimum0.051%4.1%
Maximum26.0%30.4%
Range25.9%26.3%
Mean4.5%12.0%
Median3.1%10.8%
Interquartile 25% (IQ1)1.4%9.0%
Interquartile 75% (IQ3)5.6%14.4%
Interquartile Range (IQR)4.2%5.4%
Standard Deviation (Sample)5.2%5.7%
Standard Deviation (Population)5.2%5.6%

Correlation Details

Laotian PercentileSample SizeMale Disability
[
0.0%
-
0.5%
]
0.051%
165,554,64211.2%
[
0.0%
-
0.5%
]
0.18%
36,395,93210.5%
[
0.0%
-
0.5%
]
0.31%
10,267,5659.9%
[
0.0%
-
0.5%
]
0.45%
5,496,2279.8%
[
0.5%
-
1.0%
]
0.59%
2,241,23510.0%
[
0.5%
-
1.0%
]
0.71%
2,038,8549.6%
[
0.5%
-
1.0%
]
0.85%
813,2439.4%
[
0.5%
-
1.0%
]
0.94%
622,37610.6%
[
1.0%
-
1.5%
]
1.08%
177,32012.1%
[
1.0%
-
1.5%
]
1.26%
217,78610.0%
[
1.0%
-
1.5%
]
1.36%
166,40210.0%
[
1.0%
-
1.5%
]
1.49%
158,71710.0%
[
1.5%
-
2.0%
]
1.61%
18,18411.7%
[
1.5%
-
2.0%
]
1.79%
235,83012.7%
[
1.5%
-
2.0%
]
1.89%
45,93311.3%
[
2.0%
-
2.5%
]
2.05%
112,9797.9%
[
2.0%
-
2.5%
]
2.19%
59,2819.0%
[
2.0%
-
2.5%
]
2.27%
44,0337.4%
[
2.0%
-
2.5%
]
2.38%
19,49811.8%
[
2.5%
-
3.0%
]
2.55%
9,63412.5%
[
2.5%
-
3.0%
]
2.67%
12,80911.4%
[
2.5%
-
3.0%
]
2.77%
51,72017.0%
[
3.0%
-
3.5%
]
3.07%
6,41413.1%
[
3.0%
-
3.5%
]
3.20%
2,46618.9%
[
3.5%
-
4.0%
]
3.56%
12,47816.3%
[
3.5%
-
4.0%
]
3.76%
1,30425.8%
[
3.5%
-
4.0%
]
3.82%
89020.4%
[
3.5%
-
4.0%
]
3.98%
4,1505.6%
[
4.0%
-
4.5%
]
4.19%
2,1236.2%
[
4.0%
-
4.5%
]
4.35%
26,55612.6%
[
4.5%
-
5.0%
]
4.61%
1,69230.4%
[
5.0%
-
5.5%
]
5.03%
1,3924.1%
[
5.0%
-
5.5%
]
5.12%
72227.4%
[
5.0%
-
5.5%
]
5.21%
2,05215.7%
[
5.5%
-
6.0%
]
5.98%
23,84213.8%
[
6.5%
-
7.0%
]
6.58%
3198.0%
[
6.5%
-
7.0%
]
6.62%
3024.6%
[
6.5%
-
7.0%
]
6.79%
61915.0%
[
6.5%
-
7.0%
]
6.97%
2,75610.8%
[
7.5%
-
8.0%
]
7.63%
2368.9%
[
8.0%
-
8.5%
]
8.33%
8415.2%
[
8.5%
-
9.0%
]
8.94%
1,63415.3%
[
10.5%
-
11.0%
]
10.57%
1,2205.7%
[
24.5%
-
25.0%
]
24.91%
5665.2%
[
25.5%
-
26.0%
]
25.97%
5435.6%