Immigrants from Latin America Self-Care Disability
COMPARE
Immigrants from Latin America
Select to Compare
Self-Care Disability
Immigrants from Latin America Self-Care Disability
2.7%
SELF-CARE DISABILITY
0.2/ 100
METRIC RATING
263rd/ 347
METRIC RANK
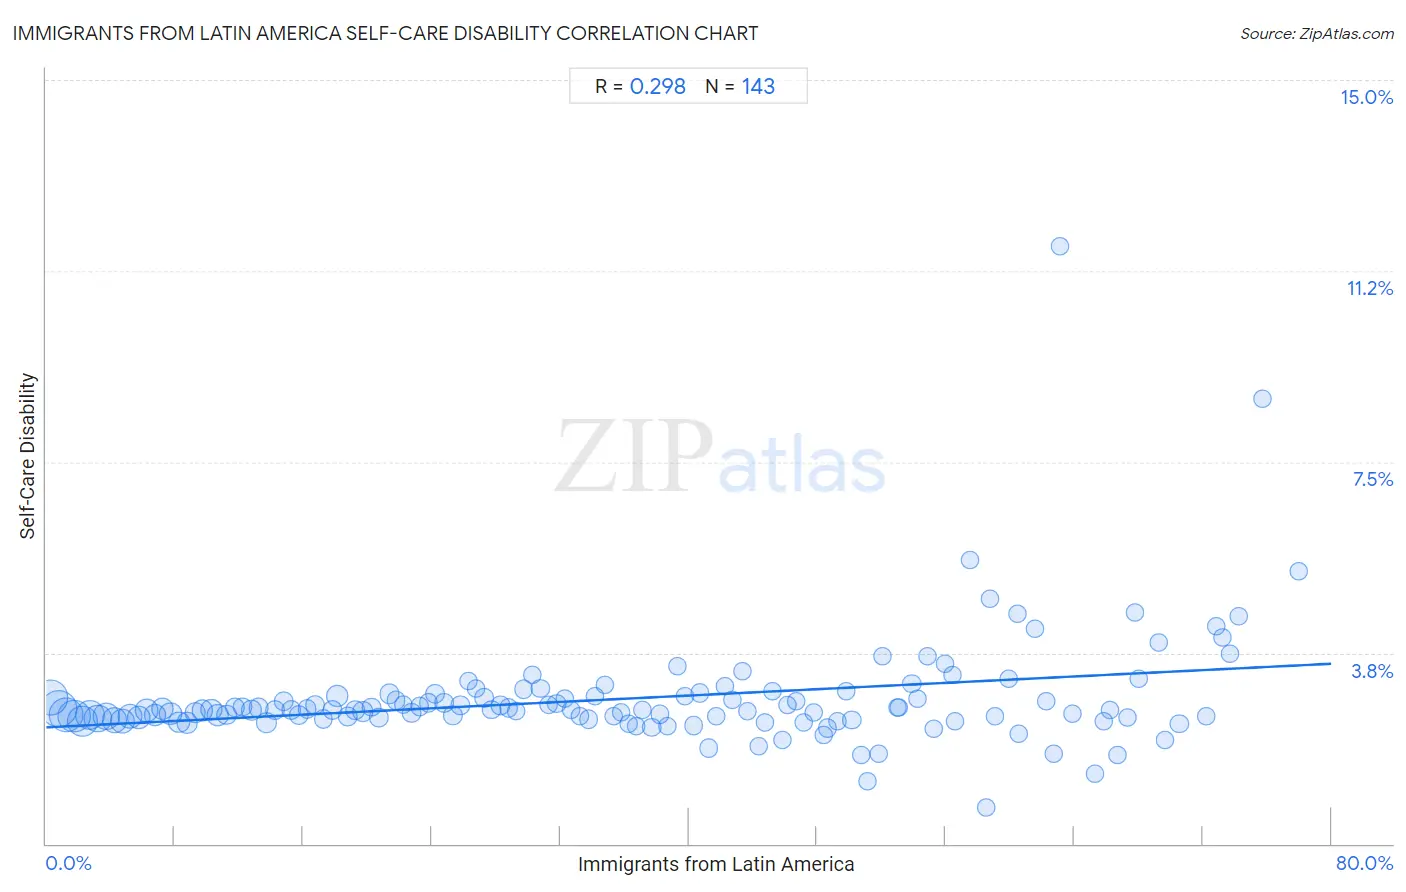
Immigrants from Latin America Self-Care Disability Correlation Chart
The statistical analysis conducted on geographies consisting of 556,721,677 people shows a weak positive correlation between the proportion of Immigrants from Latin America and percentage of population with self-care disability in the United States with a correlation coefficient (R) of 0.298 and weighted average of 2.7%. On average, for every 1% (one percent) increase in Immigrants from Latin America within a typical geography, there is an increase of 0.016% in percentage of population with self-care disability.
It is essential to understand that the correlation between the percentage of Immigrants from Latin America and percentage of population with self-care disability does not imply a direct cause-and-effect relationship. It remains uncertain whether the presence of Immigrants from Latin America influences an upward or downward trend in the level of percentage of population with self-care disability within an area, or if Immigrants from Latin America simply ended up residing in those areas with higher or lower levels of percentage of population with self-care disability due to other factors.
Demographics Similar to Immigrants from Latin America by Self-Care Disability
In terms of self-care disability, the demographic groups most similar to Immigrants from Latin America are Immigrants from Iran (2.7%, a difference of 0.060%), Shoshone (2.7%, a difference of 0.070%), Arapaho (2.6%, a difference of 0.21%), Immigrants from Nicaragua (2.7%, a difference of 0.22%), and Chippewa (2.6%, a difference of 0.23%).
| Demographics | Rating | Rank | Self-Care Disability |
| Immigrants from Central America | 0.3 /100 | #256 | Tragic 2.6% |
| Potawatomi | 0.3 /100 | #257 | Tragic 2.6% |
| Nonimmigrants | 0.3 /100 | #258 | Tragic 2.6% |
| Immigrants from Belarus | 0.2 /100 | #259 | Tragic 2.6% |
| Chippewa | 0.2 /100 | #260 | Tragic 2.6% |
| Arapaho | 0.2 /100 | #261 | Tragic 2.6% |
| Shoshone | 0.2 /100 | #262 | Tragic 2.7% |
| Immigrants from Latin America | 0.2 /100 | #263 | Tragic 2.7% |
| Immigrants from Iran | 0.2 /100 | #264 | Tragic 2.7% |
| Immigrants from Nicaragua | 0.2 /100 | #265 | Tragic 2.7% |
| Immigrants from Cambodia | 0.1 /100 | #266 | Tragic 2.7% |
| Yaqui | 0.1 /100 | #267 | Tragic 2.7% |
| Immigrants from Mexico | 0.1 /100 | #268 | Tragic 2.7% |
| U.S. Virgin Islanders | 0.1 /100 | #269 | Tragic 2.7% |
| Immigrants from Micronesia | 0.1 /100 | #270 | Tragic 2.7% |
Immigrants from Latin America Self-Care Disability Correlation Summary
| Measurement | Immigrants from Latin America Data | Self-Care Disability Data |
| Minimum | 0.27% | 0.71% |
| Maximum | 78.0% | 11.7% |
| Range | 77.7% | 11.0% |
| Mean | 36.2% | 2.9% |
| Median | 35.8% | 2.6% |
| Interquartile 25% (IQ1) | 17.8% | 2.5% |
| Interquartile 75% (IQ3) | 53.9% | 2.9% |
| Interquartile Range (IQR) | 36.1% | 0.45% |
| Standard Deviation (Sample) | 21.4% | 1.1% |
| Standard Deviation (Population) | 21.3% | 1.1% |
Correlation Details
| Immigrants from Latin America Percentile | Sample Size | Self-Care Disability |
[ 0.0% - 0.5% ] 0.27% | 45,094,995 | 2.9% |
[ 0.5% - 1.0% ] 0.75% | 48,582,200 | 2.6% |
[ 1.0% - 1.5% ] 1.24% | 42,898,519 | 2.5% |
[ 1.5% - 2.0% ] 1.75% | 36,427,912 | 2.5% |
[ 2.0% - 2.5% ] 2.25% | 32,578,477 | 2.4% |
[ 2.5% - 3.0% ] 2.75% | 29,392,796 | 2.5% |
[ 3.0% - 3.5% ] 3.22% | 23,756,169 | 2.5% |
[ 3.5% - 4.0% ] 3.75% | 22,315,249 | 2.5% |
[ 4.0% - 4.5% ] 4.25% | 18,535,006 | 2.4% |
[ 4.5% - 5.0% ] 4.75% | 16,739,180 | 2.4% |
[ 5.0% - 5.5% ] 5.23% | 16,082,674 | 2.5% |
[ 5.5% - 6.0% ] 5.74% | 12,970,040 | 2.5% |
[ 6.0% - 6.5% ] 6.24% | 10,807,693 | 2.6% |
[ 6.5% - 7.0% ] 6.74% | 9,540,181 | 2.5% |
[ 7.0% - 7.5% ] 7.24% | 10,011,107 | 2.7% |
[ 7.5% - 8.0% ] 7.74% | 10,115,823 | 2.5% |
[ 8.0% - 8.5% ] 8.26% | 8,087,063 | 2.4% |
[ 8.5% - 9.0% ] 8.77% | 8,025,203 | 2.4% |
[ 9.0% - 9.5% ] 9.25% | 5,418,510 | 2.6% |
[ 9.5% - 10.0% ] 9.71% | 7,218,626 | 2.6% |
[ 10.0% - 10.5% ] 10.29% | 8,816,357 | 2.6% |
[ 10.5% - 11.0% ] 10.68% | 8,925,752 | 2.5% |
[ 11.0% - 11.5% ] 11.23% | 4,320,198 | 2.5% |
[ 11.5% - 12.0% ] 11.77% | 3,771,769 | 2.7% |
[ 12.0% - 12.5% ] 12.23% | 3,105,565 | 2.7% |
[ 12.5% - 13.0% ] 12.77% | 5,398,504 | 2.6% |
[ 13.0% - 13.5% ] 13.25% | 3,834,924 | 2.7% |
[ 13.5% - 14.0% ] 13.70% | 5,394,435 | 2.4% |
[ 14.0% - 14.5% ] 14.25% | 2,795,930 | 2.6% |
[ 14.5% - 15.0% ] 14.77% | 3,183,866 | 2.8% |
[ 15.0% - 15.5% ] 15.26% | 3,402,965 | 2.6% |
[ 15.5% - 16.0% ] 15.72% | 2,905,100 | 2.5% |
[ 16.0% - 16.5% ] 16.24% | 2,140,953 | 2.7% |
[ 16.5% - 17.0% ] 16.74% | 2,946,119 | 2.7% |
[ 17.0% - 17.5% ] 17.24% | 2,144,661 | 2.5% |
[ 17.5% - 18.0% ] 17.80% | 3,371,923 | 2.6% |
[ 18.0% - 18.5% ] 18.12% | 11,264,213 | 2.9% |
[ 18.5% - 19.0% ] 18.78% | 2,070,613 | 2.5% |
[ 19.0% - 19.5% ] 19.24% | 2,207,934 | 2.6% |
[ 19.5% - 20.0% ] 19.71% | 4,713,911 | 2.6% |
[ 20.0% - 20.5% ] 20.25% | 2,022,425 | 2.7% |
[ 20.5% - 21.0% ] 20.71% | 2,718,260 | 2.5% |
[ 21.0% - 21.5% ] 21.37% | 5,955,349 | 3.0% |
[ 21.5% - 22.0% ] 21.77% | 1,385,309 | 2.8% |
[ 22.0% - 22.5% ] 22.24% | 2,004,660 | 2.7% |
[ 22.5% - 23.0% ] 22.74% | 1,573,141 | 2.6% |
[ 23.0% - 23.5% ] 23.24% | 1,823,102 | 2.7% |
[ 23.5% - 24.0% ] 23.78% | 1,493,610 | 2.8% |
[ 24.0% - 24.5% ] 24.24% | 2,963,134 | 2.9% |
[ 24.5% - 25.0% ] 24.76% | 1,185,305 | 2.8% |
[ 25.0% - 25.5% ] 25.31% | 1,254,036 | 2.5% |
[ 25.5% - 26.0% ] 25.77% | 1,401,225 | 2.7% |
[ 26.0% - 26.5% ] 26.30% | 1,355,274 | 3.2% |
[ 26.5% - 27.0% ] 26.73% | 1,222,640 | 3.0% |
[ 27.0% - 27.5% ] 27.25% | 1,199,984 | 2.9% |
[ 27.5% - 28.0% ] 27.73% | 1,385,457 | 2.6% |
[ 28.0% - 28.5% ] 28.29% | 1,052,594 | 2.7% |
[ 28.5% - 29.0% ] 28.79% | 966,354 | 2.7% |
[ 29.0% - 29.5% ] 29.27% | 828,752 | 2.6% |
[ 29.5% - 30.0% ] 29.74% | 776,103 | 3.0% |
[ 30.0% - 30.5% ] 30.25% | 869,105 | 3.3% |
[ 30.5% - 31.0% ] 30.76% | 1,335,753 | 3.0% |
[ 31.0% - 31.5% ] 31.26% | 835,287 | 2.7% |
[ 31.5% - 32.0% ] 31.78% | 763,476 | 2.8% |
[ 32.0% - 32.5% ] 32.30% | 1,089,388 | 2.8% |
[ 32.5% - 33.0% ] 32.70% | 854,950 | 2.6% |
[ 33.0% - 33.5% ] 33.25% | 673,238 | 2.5% |
[ 33.5% - 34.0% ] 33.75% | 622,943 | 2.4% |
[ 34.0% - 34.5% ] 34.19% | 357,315 | 2.9% |
[ 34.5% - 35.0% ] 34.77% | 709,981 | 3.1% |
[ 35.0% - 35.5% ] 35.30% | 502,366 | 2.5% |
[ 35.5% - 36.0% ] 35.81% | 724,485 | 2.6% |
[ 36.0% - 36.5% ] 36.23% | 318,053 | 2.4% |
[ 36.5% - 37.0% ] 36.71% | 448,688 | 2.3% |
[ 37.0% - 37.5% ] 37.13% | 503,720 | 2.6% |
[ 37.5% - 38.0% ] 37.70% | 694,435 | 2.3% |
[ 38.0% - 38.5% ] 38.21% | 506,380 | 2.5% |
[ 38.5% - 39.0% ] 38.69% | 508,003 | 2.3% |
[ 39.0% - 39.5% ] 39.27% | 290,776 | 3.5% |
[ 39.5% - 40.0% ] 39.77% | 407,888 | 2.9% |
[ 40.0% - 40.5% ] 40.27% | 521,102 | 2.3% |
[ 40.5% - 41.0% ] 40.67% | 735,982 | 3.0% |
[ 41.0% - 41.5% ] 41.21% | 178,755 | 1.9% |
[ 41.5% - 42.0% ] 41.73% | 166,617 | 2.5% |
[ 42.0% - 42.5% ] 42.24% | 433,200 | 3.1% |
[ 42.5% - 43.0% ] 42.73% | 420,134 | 2.8% |
[ 43.0% - 43.5% ] 43.31% | 238,058 | 3.4% |
[ 43.5% - 44.0% ] 43.69% | 206,861 | 2.6% |
[ 44.0% - 44.5% ] 44.34% | 328,097 | 1.9% |
[ 44.5% - 45.0% ] 44.72% | 288,389 | 2.4% |
[ 45.0% - 45.5% ] 45.24% | 127,677 | 3.0% |
[ 45.5% - 46.0% ] 45.87% | 155,584 | 2.0% |
[ 46.0% - 46.5% ] 46.17% | 106,067 | 2.7% |
[ 46.5% - 47.0% ] 46.72% | 226,282 | 2.8% |
[ 47.0% - 47.5% ] 47.16% | 201,590 | 2.4% |
[ 47.5% - 48.0% ] 47.81% | 156,830 | 2.6% |
[ 48.0% - 48.5% ] 48.38% | 47,500 | 2.1% |
[ 48.5% - 49.0% ] 48.65% | 270,648 | 2.3% |
[ 49.0% - 49.5% ] 49.22% | 96,524 | 2.4% |
[ 49.5% - 50.0% ] 49.81% | 249,318 | 3.0% |
[ 50.0% - 50.5% ] 50.15% | 86,921 | 2.4% |
[ 50.5% - 51.0% ] 50.72% | 111,398 | 1.7% |
[ 51.0% - 51.5% ] 51.11% | 21,106 | 1.2% |
[ 51.5% - 52.0% ] 51.81% | 133,698 | 1.8% |
[ 52.0% - 52.5% ] 52.07% | 44,546 | 3.7% |
[ 52.5% - 53.0% ] 52.98% | 13,877 | 2.7% |
[ 53.0% - 53.5% ] 53.08% | 51,948 | 2.7% |
[ 53.5% - 54.0% ] 53.89% | 443,665 | 3.2% |
[ 54.0% - 54.5% ] 54.26% | 33,642 | 2.9% |
[ 54.5% - 55.0% ] 54.90% | 37,977 | 3.7% |
[ 55.0% - 55.5% ] 55.24% | 13,787 | 2.3% |
[ 55.5% - 56.0% ] 55.93% | 55,613 | 3.5% |
[ 56.0% - 56.5% ] 56.46% | 13,137 | 3.3% |
[ 56.5% - 57.0% ] 56.59% | 68,833 | 2.4% |
[ 57.0% - 57.5% ] 57.49% | 7,104 | 5.6% |
[ 58.0% - 58.5% ] 58.49% | 25,154 | 0.71% |
[ 58.5% - 59.0% ] 58.77% | 7,689 | 4.8% |
[ 59.0% - 59.5% ] 59.08% | 50,975 | 2.5% |
[ 59.5% - 60.0% ] 59.91% | 95,797 | 3.2% |
[ 60.0% - 60.5% ] 60.44% | 25,128 | 4.5% |
[ 60.5% - 61.0% ] 60.52% | 83,916 | 2.2% |
[ 61.5% - 62.0% ] 61.54% | 11,244 | 4.2% |
[ 62.0% - 62.5% ] 62.24% | 107,902 | 2.8% |
[ 62.5% - 63.0% ] 62.72% | 14,733 | 1.8% |
[ 63.0% - 63.5% ] 63.13% | 358 | 11.7% |
[ 63.5% - 64.0% ] 63.90% | 167,279 | 2.6% |
[ 65.0% - 65.5% ] 65.32% | 109,226 | 1.4% |
[ 65.5% - 66.0% ] 65.81% | 52,851 | 2.4% |
[ 66.0% - 66.5% ] 66.26% | 44,595 | 2.6% |
[ 66.5% - 67.0% ] 66.67% | 114 | 1.8% |
[ 67.0% - 67.5% ] 67.28% | 40,278 | 2.5% |
[ 67.5% - 68.0% ] 67.74% | 54,873 | 4.6% |
[ 68.0% - 68.5% ] 68.02% | 20,850 | 3.2% |
[ 69.0% - 69.5% ] 69.27% | 26,596 | 4.0% |
[ 69.5% - 70.0% ] 69.67% | 57,066 | 2.0% |
[ 70.5% - 71.0% ] 70.54% | 68,575 | 2.4% |
[ 72.0% - 72.5% ] 72.20% | 19,399 | 2.5% |
[ 72.5% - 73.0% ] 72.82% | 64,572 | 4.3% |
[ 73.0% - 73.5% ] 73.24% | 222,996 | 4.1% |
[ 73.5% - 74.0% ] 73.72% | 46,798 | 3.7% |
[ 74.0% - 74.5% ] 74.26% | 71,088 | 4.5% |
[ 75.5% - 76.0% ] 75.74% | 1,018 | 8.7% |
[ 78.0% - 78.5% ] 78.01% | 42,081 | 5.4% |