Immigrants from Kuwait vs English 1 or more Vehicles in Household

COMPARE

Immigrants from Kuwait
Race
Ancestry
AfghanAfricanAlaska NativeAlaskan AthabascanAlbanianAleutAlsatianAmericanApacheArabArapahoArgentineanArmenianAssyrian/Chaldean/SyriacAustralianAustrianBahamianBangladeshiBarbadianBasqueBelgianBelizeanBermudanBhutaneseBlackfeetBolivianBrazilianBritishBritish West IndianBulgarianBurmeseCajunCambodianCanadianCape VerdeanCarpatho RusynCelticCentral AmericanCentral American IndianCherokeeCheyenneChickasawChileanChineseChippewaChoctawColombianColvilleComancheCosta RicanCreeCreekCroatianCrowCubanCypriotCzechCzechoslovakianDanishDelawareDominicanDutchDutch West IndianEastern EuropeanEcuadorianEgyptianEstonianEthiopianEuropeanFijianFilipinoFinnishFrenchFrench American IndianFrench CanadianGermanGerman RussianGhanaianGreekGuamanian/ChamorroGuatemalanGuyaneseHaitianHmongHonduranHopiHoumaHungarianIcelanderIndian (Asian)IndonesianInupiatIranianIraqiIrishIroquoisIsraeliItalianJamaicanJapaneseJordanianKenyanKiowaKoreanLaotianLatvianLebaneseLiberianLithuanianLumbeeLuxembourgerMacedonianMalaysianMalteseMarshalleseMenomineeMexicanMexican American IndianMongolianMoroccanNative HawaiianNavajoNepaleseNew ZealanderNicaraguanNigerianNorthern EuropeanNorwegianOkinawanOsageOttawaPaiutePakistaniPalestinianPanamanianParaguayanPennsylvania GermanPeruvianPimaPolishPortuguesePotawatomiPuebloPuerto RicanPuget Sound SalishRomanianRussianSalvadoranSamoanScandinavianScotch-IrishScottishSeminoleSenegaleseSerbianShoshoneSierra LeoneanSiouxSlavicSlovakSloveneSomaliSouth AfricanSouth AmericanSouth American IndianSoviet UnionSpaniardSpanishSpanish AmericanSpanish American IndianSri LankanSubsaharan AfricanSudaneseSwedishSwissSyrianTaiwaneseThaiTlingit-HaidaTohono O'OdhamTonganTrinidadian and TobagonianTsimshianTurkishU.S. Virgin IslanderUgandanUkrainianUruguayanUteVenezuelanVietnameseWelshWest IndianYakamaYaquiYugoslavianYumanYup'ikZimbabwean
Immigration
NonimmigrantsImmigrantsAfghanistanAfricaAlbaniaArgentinaArmeniaAsiaAustraliaAustriaBahamasBangladeshBarbadosBelarusBelgiumBelizeBoliviaBosnia and HerzegovinaBrazilBulgariaBurma/MyanmarCabo VerdeCambodiaCameroonCanadaCaribbeanCentral AmericaChileChinaColombiaCongoCosta RicaCroatiaCubaCzechoslovakiaDenmarkDominicaDominican RepublicEastern AfricaEastern AsiaEastern EuropeEcuadorEgyptEl SalvadorEnglandEritreaEthiopiaEuropeFijiFranceGermanyGhanaGreeceGrenadaGuatemalaGuyanaHaitiHondurasHong KongHungaryIndiaIndonesiaIranIraqIrelandIsraelItalyJamaicaJapanJordanKazakhstanKenyaKoreaKuwaitLaosLatin AmericaLatviaLebanonLiberiaLithuaniaMalaysiaMexicoMicronesiaMiddle AfricaMoldovaMoroccoNepalNetherlandsNicaraguaNigeriaNorth AmericaNorth MacedoniaNorthern AfricaNorthern EuropeNorwayOceaniaPakistanPanamaPeruPhilippinesPolandPortugalRomaniaRussiaSaudi ArabiaScotlandSenegalSerbiaSierra LeoneSingaporeSomaliaSouth AfricaSouth AmericaSouth Central AsiaSouth Eastern AsiaSouthern EuropeSpainSri LankaSt. Vincent and the GrenadinesSudanSwedenSwitzerlandSyriaTaiwanThailandTrinidad and TobagoTurkeyUgandaUkraineUruguayUzbekistanVenezuelaVietnamWest IndiesWestern AfricaWestern AsiaWestern EuropeYemenZaireZimbabweAzores
English
Race
Ancestry
AfghanAfricanAlaska NativeAlaskan AthabascanAlbanianAleutAlsatianAmericanApacheArabArapahoArgentineanArmenianAssyrian/Chaldean/SyriacAustralianAustrianBahamianBangladeshiBarbadianBasqueBelgianBelizeanBermudanBhutaneseBlackfeetBolivianBrazilianBritishBritish West IndianBulgarianBurmeseCajunCambodianCanadianCape VerdeanCarpatho RusynCelticCentral AmericanCentral American IndianCherokeeCheyenneChickasawChileanChineseChippewaChoctawColombianColvilleComancheCosta RicanCreeCreekCroatianCrowCubanCypriotCzechCzechoslovakianDanishDelawareDominicanDutchDutch West IndianEastern EuropeanEcuadorianEgyptianEnglishEstonianEthiopianEuropeanFijianFilipinoFinnishFrenchFrench American IndianFrench CanadianGermanGerman RussianGhanaianGreekGuamanian/ChamorroGuatemalanGuyaneseHaitianHmongHonduranHopiHoumaHungarianIcelanderIndian (Asian)IndonesianInupiatIranianIraqiIrishIroquoisIsraeliItalianJamaicanJapaneseJordanianKenyanKiowaKoreanLaotianLatvianLebaneseLiberianLithuanianLumbeeLuxembourgerMacedonianMalaysianMalteseMarshalleseMenomineeMexicanMexican American IndianMongolianMoroccanNative HawaiianNavajoNepaleseNew ZealanderNicaraguanNigerianNorthern EuropeanNorwegianOkinawanOsageOttawaPaiutePakistaniPalestinianPanamanianParaguayanPennsylvania GermanPeruvianPimaPolishPortuguesePotawatomiPuebloPuerto RicanPuget Sound SalishRomanianRussianSalvadoranSamoanScandinavianScotch-IrishScottishSeminoleSenegaleseSerbianShoshoneSierra LeoneanSiouxSlavicSlovakSloveneSomaliSouth AfricanSouth AmericanSouth American IndianSoviet UnionSpaniardSpanishSpanish AmericanSpanish American IndianSri LankanSubsaharan AfricanSudaneseSwedishSwissSyrianTaiwaneseThaiTlingit-HaidaTohono O'OdhamTonganTrinidadian and TobagonianTsimshianTurkishU.S. Virgin IslanderUgandanUkrainianUruguayanUteVenezuelanVietnameseWelshWest IndianYakamaYaquiYugoslavianYumanYup'ikZimbabwean
Immigration
NonimmigrantsImmigrantsAfghanistanAfricaAlbaniaArgentinaArmeniaAsiaAustraliaAustriaBahamasBangladeshBarbadosBelarusBelgiumBelizeBoliviaBosnia and HerzegovinaBrazilBulgariaBurma/MyanmarCabo VerdeCambodiaCameroonCanadaCaribbeanCentral AmericaChileChinaColombiaCongoCosta RicaCroatiaCubaCzechoslovakiaDenmarkDominicaDominican RepublicEastern AfricaEastern AsiaEastern EuropeEcuadorEgyptEl SalvadorEnglandEritreaEthiopiaEuropeFijiFranceGermanyGhanaGreeceGrenadaGuatemalaGuyanaHaitiHondurasHong KongHungaryIndiaIndonesiaIranIraqIrelandIsraelItalyJamaicaJapanJordanKazakhstanKenyaKoreaLaosLatin AmericaLatviaLebanonLiberiaLithuaniaMalaysiaMexicoMicronesiaMiddle AfricaMoldovaMoroccoNepalNetherlandsNicaraguaNigeriaNorth AmericaNorth MacedoniaNorthern AfricaNorthern EuropeNorwayOceaniaPakistanPanamaPeruPhilippinesPolandPortugalRomaniaRussiaSaudi ArabiaScotlandSenegalSerbiaSierra LeoneSingaporeSomaliaSouth AfricaSouth AmericaSouth Central AsiaSouth Eastern AsiaSouthern EuropeSpainSri LankaSt. Vincent and the GrenadinesSudanSwedenSwitzerlandSyriaTaiwanThailandTrinidad and TobagoTurkeyUgandaUkraineUruguayUzbekistanVenezuelaVietnamWest IndiesWestern AfricaWestern AsiaWestern EuropeYemenZaireZimbabweAzores
1 or more Vehicles in Household
Income
Poverty
Unemployment
Labor Participation
Family Structure
Vehicle Availability
Education Level
Disability

1 or more Vehicles in Household Comparison

Immigrants from Kuwait

English

Exceptional
Exceptional
90.7%
1 OR MORE VEHICLES IN HOUSEHOLD
94.7/ 100
METRIC RATING
113th/ 347
METRIC RANK
93.8%
1 OR MORE VEHICLES IN HOUSEHOLD
100.0/ 100
METRIC RATING
2nd/ 347
METRIC RANK

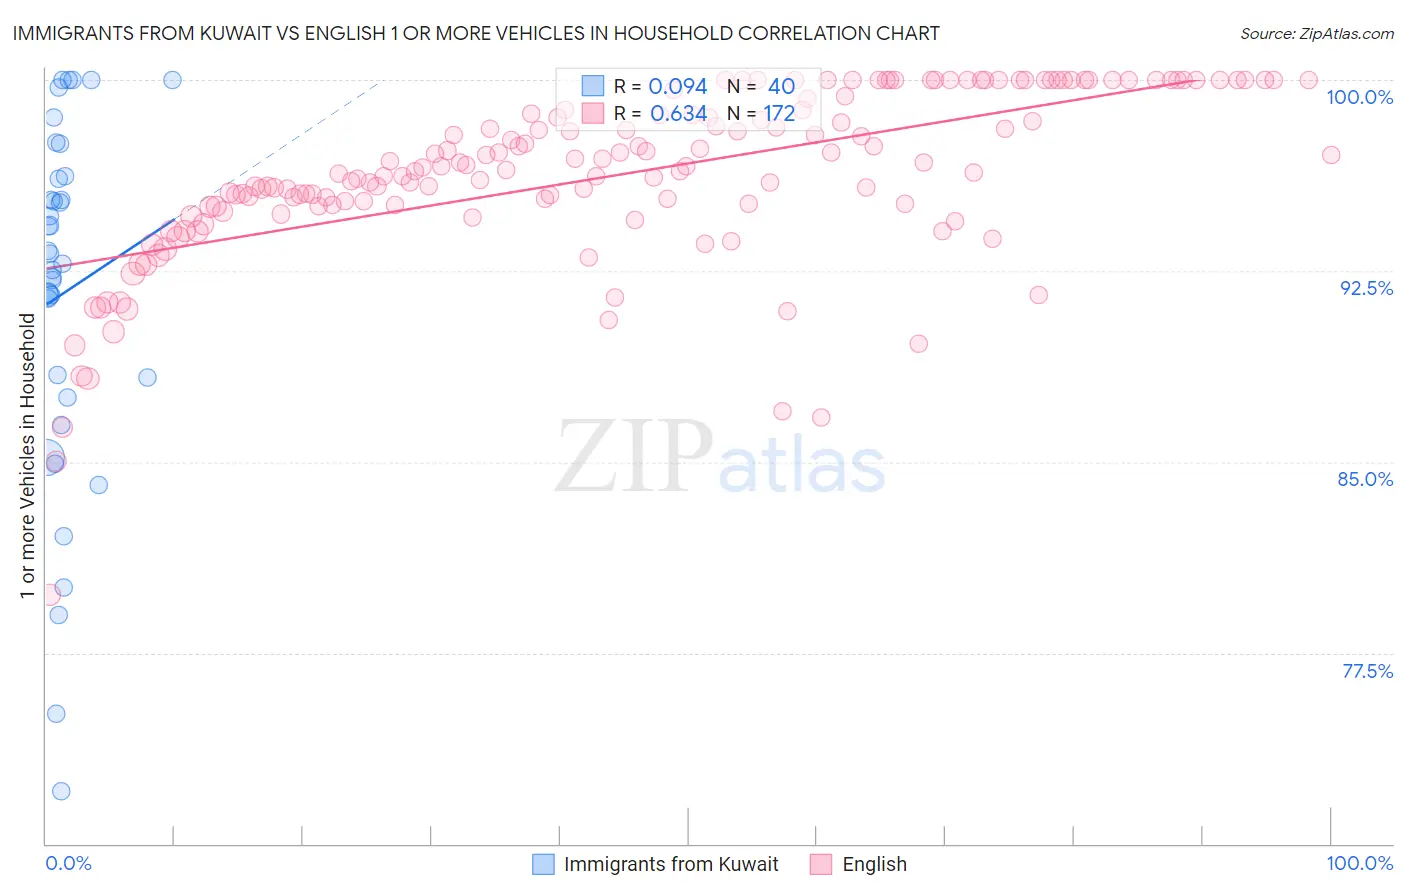
Immigrants from Kuwait vs English 1 or more Vehicles in Household Correlation Chart

The statistical analysis conducted on geographies consisting of 136,852,839 people shows a slight positive correlation between the proportion of Immigrants from Kuwait and percentage of households with 1 or more vehicles available in the United States with a correlation coefficient (R) of 0.094 and weighted average of 90.7%. Similarly, the statistical analysis conducted on geographies consisting of 556,750,813 people shows a significant positive correlation between the proportion of English and percentage of households with 1 or more vehicles available in the United States with a correlation coefficient (R) of 0.634 and weighted average of 93.8%, a difference of 3.4%.
Immigrants from Kuwait vs English 1 or more Vehicles in Household

1 or more Vehicles in Household Correlation Summary

MeasurementImmigrants from KuwaitEnglish
Minimum72.1%79.8%
Maximum100.0%100.0%
Range27.9%20.2%
Mean91.6%96.3%
Median93.0%96.5%
Interquartile 25% (IQ1)87.9%95.1%
Interquartile 75% (IQ3)96.2%98.8%
Interquartile Range (IQR)8.3%3.8%
Standard Deviation (Sample)7.0%3.4%
Standard Deviation (Population)6.9%3.4%

Similar Demographics by 1 or more Vehicles in Household

Demographics Similar to Immigrants from Kuwait by 1 or more Vehicles in Household

In terms of 1 or more vehicles in household, the demographic groups most similar to Immigrants from Kuwait are Armenian (90.7%, a difference of 0.020%), Serbian (90.7%, a difference of 0.030%), Chippewa (90.7%, a difference of 0.030%), Immigrants from Netherlands (90.8%, a difference of 0.080%), and Navajo (90.8%, a difference of 0.090%).
DemographicsRating | Rank1 or more Vehicles in Household
Zimbabweans
97.7
/100
|
#106
Exceptional
91.0%
Maltese
97.7
/100
|
#107
Exceptional
91.0%
Hispanics or Latinos
97.6
/100
|
#108
Exceptional
91.0%
Delaware
97.6
/100
|
#109
Exceptional
91.0%
Mexican American Indians
97.4
/100
|
#110
Exceptional
91.0%
Navajo
95.8
/100
|
#111
Exceptional
90.8%
Immigrants | Netherlands
95.7
/100
|
#112
Exceptional
90.8%
Immigrants | Kuwait
94.7
/100
|
#113
Exceptional
90.7%
Armenians
94.5
/100
|
#114
Exceptional
90.7%
Serbians
94.3
/100
|
#115
Exceptional
90.7%
Chippewa
94.3
/100
|
#116
Exceptional
90.7%
Greeks
93.5
/100
|
#117
Exceptional
90.6%
Japanese
93.4
/100
|
#118
Exceptional
90.6%
Blackfeet
92.6
/100
|
#119
Exceptional
90.6%
Immigrants | Thailand
92.3
/100
|
#120
Exceptional
90.6%

Demographics Similar to English by 1 or more Vehicles in Household

In terms of 1 or more vehicles in household, the demographic groups most similar to English are Norwegian (93.7%, a difference of 0.13%), German (93.6%, a difference of 0.17%), Yakama (93.6%, a difference of 0.27%), Danish (93.5%, a difference of 0.29%), and Scottish (93.4%, a difference of 0.48%).
DemographicsRating | Rank1 or more Vehicles in Household
Luxembourgers
100.0
/100
|
#1
Exceptional
94.8%
English
100.0
/100
|
#2
Exceptional
93.8%
Norwegians
100.0
/100
|
#3
Exceptional
93.7%
Germans
100.0
/100
|
#4
Exceptional
93.6%
Yakama
100.0
/100
|
#5
Exceptional
93.6%
Danes
100.0
/100
|
#6
Exceptional
93.5%
Scottish
100.0
/100
|
#7
Exceptional
93.4%
Swedes
100.0
/100
|
#8
Exceptional
93.3%
Scotch-Irish
100.0
/100
|
#9
Exceptional
93.3%
Dutch
100.0
/100
|
#10
Exceptional
93.3%
Czechs
100.0
/100
|
#11
Exceptional
93.3%
Scandinavians
100.0
/100
|
#12
Exceptional
93.1%
Whites/Caucasians
100.0
/100
|
#13
Exceptional
93.1%
Irish
100.0
/100
|
#14
Exceptional
93.1%
Mexicans
100.0
/100
|
#15
Exceptional
93.0%