Icelander Female Disability

COMPARE

Icelander
Race
Ancestry
AfghanAfricanAlaska NativeAlaskan AthabascanAlbanianAleutAlsatianAmericanApacheArabArapahoArgentineanArmenianAssyrian/Chaldean/SyriacAustralianAustrianBahamianBangladeshiBarbadianBasqueBelgianBelizeanBermudanBhutaneseBlackfeetBolivianBrazilianBritishBritish West IndianBulgarianBurmeseCajunCambodianCanadianCape VerdeanCarpatho RusynCelticCentral AmericanCentral American IndianCherokeeCheyenneChickasawChileanChineseChippewaChoctawColombianColvilleComancheCosta RicanCreeCreekCroatianCrowCubanCypriotCzechCzechoslovakianDanishDelawareDominicanDutchDutch West IndianEastern EuropeanEcuadorianEgyptianEnglishEstonianEthiopianEuropeanFijianFilipinoFinnishFrenchFrench American IndianFrench CanadianGermanGerman RussianGhanaianGreekGuamanian/ChamorroGuatemalanGuyaneseHaitianHmongHonduranHopiHoumaHungarianIcelanderIndian (Asian)IndonesianInupiatIranianIraqiIrishIroquoisIsraeliItalianJamaicanJapaneseJordanianKenyanKiowaKoreanLaotianLatvianLebaneseLiberianLithuanianLumbeeLuxembourgerMacedonianMalaysianMalteseMarshalleseMenomineeMexicanMexican American IndianMongolianMoroccanNative HawaiianNavajoNepaleseNew ZealanderNicaraguanNigerianNorthern EuropeanNorwegianOkinawanOsageOttawaPaiutePakistaniPalestinianPanamanianParaguayanPennsylvania GermanPeruvianPimaPolishPortuguesePotawatomiPuebloPuerto RicanPuget Sound SalishRomanianRussianSalvadoranSamoanScandinavianScotch-IrishScottishSeminoleSenegaleseSerbianShoshoneSierra LeoneanSiouxSlavicSlovakSloveneSomaliSouth AfricanSouth AmericanSouth American IndianSoviet UnionSpaniardSpanishSpanish AmericanSpanish American IndianSri LankanSubsaharan AfricanSudaneseSwedishSwissSyrianTaiwaneseThaiTlingit-HaidaTohono O'OdhamTonganTrinidadian and TobagonianTsimshianTurkishU.S. Virgin IslanderUgandanUkrainianUruguayanUteVenezuelanVietnameseWelshWest IndianYakamaYaquiYugoslavianYumanYup'ikZimbabwean
Immigration
NonimmigrantsImmigrantsAfghanistanAfricaAlbaniaArgentinaArmeniaAsiaAustraliaAustriaBahamasBangladeshBarbadosBelarusBelgiumBelizeBoliviaBosnia and HerzegovinaBrazilBulgariaBurma/MyanmarCabo VerdeCambodiaCameroonCanadaCaribbeanCentral AmericaChileChinaColombiaCongoCosta RicaCroatiaCubaCzechoslovakiaDenmarkDominicaDominican RepublicEastern AfricaEastern AsiaEastern EuropeEcuadorEgyptEl SalvadorEnglandEritreaEthiopiaEuropeFijiFranceGermanyGhanaGreeceGrenadaGuatemalaGuyanaHaitiHondurasHong KongHungaryIndiaIndonesiaIranIraqIrelandIsraelItalyJamaicaJapanJordanKazakhstanKenyaKoreaKuwaitLaosLatin AmericaLatviaLebanonLiberiaLithuaniaMalaysiaMexicoMicronesiaMiddle AfricaMoldovaMoroccoNepalNetherlandsNicaraguaNigeriaNorth AmericaNorth MacedoniaNorthern AfricaNorthern EuropeNorwayOceaniaPakistanPanamaPeruPhilippinesPolandPortugalRomaniaRussiaSaudi ArabiaScotlandSenegalSerbiaSierra LeoneSingaporeSomaliaSouth AfricaSouth AmericaSouth Central AsiaSouth Eastern AsiaSouthern EuropeSpainSri LankaSt. Vincent and the GrenadinesSudanSwedenSwitzerlandSyriaTaiwanThailandTrinidad and TobagoTurkeyUgandaUkraineUruguayUzbekistanVenezuelaVietnamWest IndiesWestern AfricaWestern AsiaWestern EuropeYemenZaireZimbabweAzores
Select to Compare
Race
Ancestry
AfghanAfricanAlaska NativeAlaskan AthabascanAlbanianAleutAlsatianAmericanApacheArabArapahoArgentineanArmenianAssyrian/Chaldean/SyriacAustralianAustrianBahamianBangladeshiBarbadianBasqueBelgianBelizeanBermudanBhutaneseBlackfeetBolivianBrazilianBritishBritish West IndianBulgarianBurmeseCajunCambodianCanadianCape VerdeanCarpatho RusynCelticCentral AmericanCentral American IndianCherokeeCheyenneChickasawChileanChineseChippewaChoctawColombianColvilleComancheCosta RicanCreeCreekCroatianCrowCubanCypriotCzechCzechoslovakianDanishDelawareDominicanDutchDutch West IndianEastern EuropeanEcuadorianEgyptianEnglishEstonianEthiopianEuropeanFijianFilipinoFinnishFrenchFrench American IndianFrench CanadianGermanGerman RussianGhanaianGreekGuamanian/ChamorroGuatemalanGuyaneseHaitianHmongHonduranHopiHoumaHungarianIndian (Asian)IndonesianInupiatIranianIraqiIrishIroquoisIsraeliItalianJamaicanJapaneseJordanianKenyanKiowaKoreanLaotianLatvianLebaneseLiberianLithuanianLumbeeLuxembourgerMacedonianMalaysianMalteseMarshalleseMenomineeMexicanMexican American IndianMongolianMoroccanNative HawaiianNavajoNepaleseNew ZealanderNicaraguanNigerianNorthern EuropeanNorwegianOkinawanOsageOttawaPaiutePakistaniPalestinianPanamanianParaguayanPennsylvania GermanPeruvianPimaPolishPortuguesePotawatomiPuebloPuerto RicanPuget Sound SalishRomanianRussianSalvadoranSamoanScandinavianScotch-IrishScottishSeminoleSenegaleseSerbianShoshoneSierra LeoneanSiouxSlavicSlovakSloveneSomaliSouth AfricanSouth AmericanSouth American IndianSoviet UnionSpaniardSpanishSpanish AmericanSpanish American IndianSri LankanSubsaharan AfricanSudaneseSwedishSwissSyrianTaiwaneseThaiTlingit-HaidaTohono O'OdhamTonganTrinidadian and TobagonianTsimshianTurkishU.S. Virgin IslanderUgandanUkrainianUruguayanUteVenezuelanVietnameseWelshWest IndianYakamaYaquiYugoslavianYumanYup'ikZimbabwean
Immigration
NonimmigrantsImmigrantsAfghanistanAfricaAlbaniaArgentinaArmeniaAsiaAustraliaAustriaBahamasBangladeshBarbadosBelarusBelgiumBelizeBoliviaBosnia and HerzegovinaBrazilBulgariaBurma/MyanmarCabo VerdeCambodiaCameroonCanadaCaribbeanCentral AmericaChileChinaColombiaCongoCosta RicaCroatiaCubaCzechoslovakiaDenmarkDominicaDominican RepublicEastern AfricaEastern AsiaEastern EuropeEcuadorEgyptEl SalvadorEnglandEritreaEthiopiaEuropeFijiFranceGermanyGhanaGreeceGrenadaGuatemalaGuyanaHaitiHondurasHong KongHungaryIndiaIndonesiaIranIraqIrelandIsraelItalyJamaicaJapanJordanKazakhstanKenyaKoreaKuwaitLaosLatin AmericaLatviaLebanonLiberiaLithuaniaMalaysiaMexicoMicronesiaMiddle AfricaMoldovaMoroccoNepalNetherlandsNicaraguaNigeriaNorth AmericaNorth MacedoniaNorthern AfricaNorthern EuropeNorwayOceaniaPakistanPanamaPeruPhilippinesPolandPortugalRomaniaRussiaSaudi ArabiaScotlandSenegalSerbiaSierra LeoneSingaporeSomaliaSouth AfricaSouth AmericaSouth Central AsiaSouth Eastern AsiaSouthern EuropeSpainSri LankaSt. Vincent and the GrenadinesSudanSwedenSwitzerlandSyriaTaiwanThailandTrinidad and TobagoTurkeyUgandaUkraineUruguayUzbekistanVenezuelaVietnamWest IndiesWestern AfricaWestern AsiaWestern EuropeYemenZaireZimbabweAzores
Female Disability
Income
Poverty
Unemployment
Labor Participation
Family Structure
Vehicle Availability
Education Level
Disability

Icelander Female Disability
Excellent

12.0%
DISABILITY | FEMALES
80.7/ 100
METRIC RATING
151st/ 347
METRIC RANK

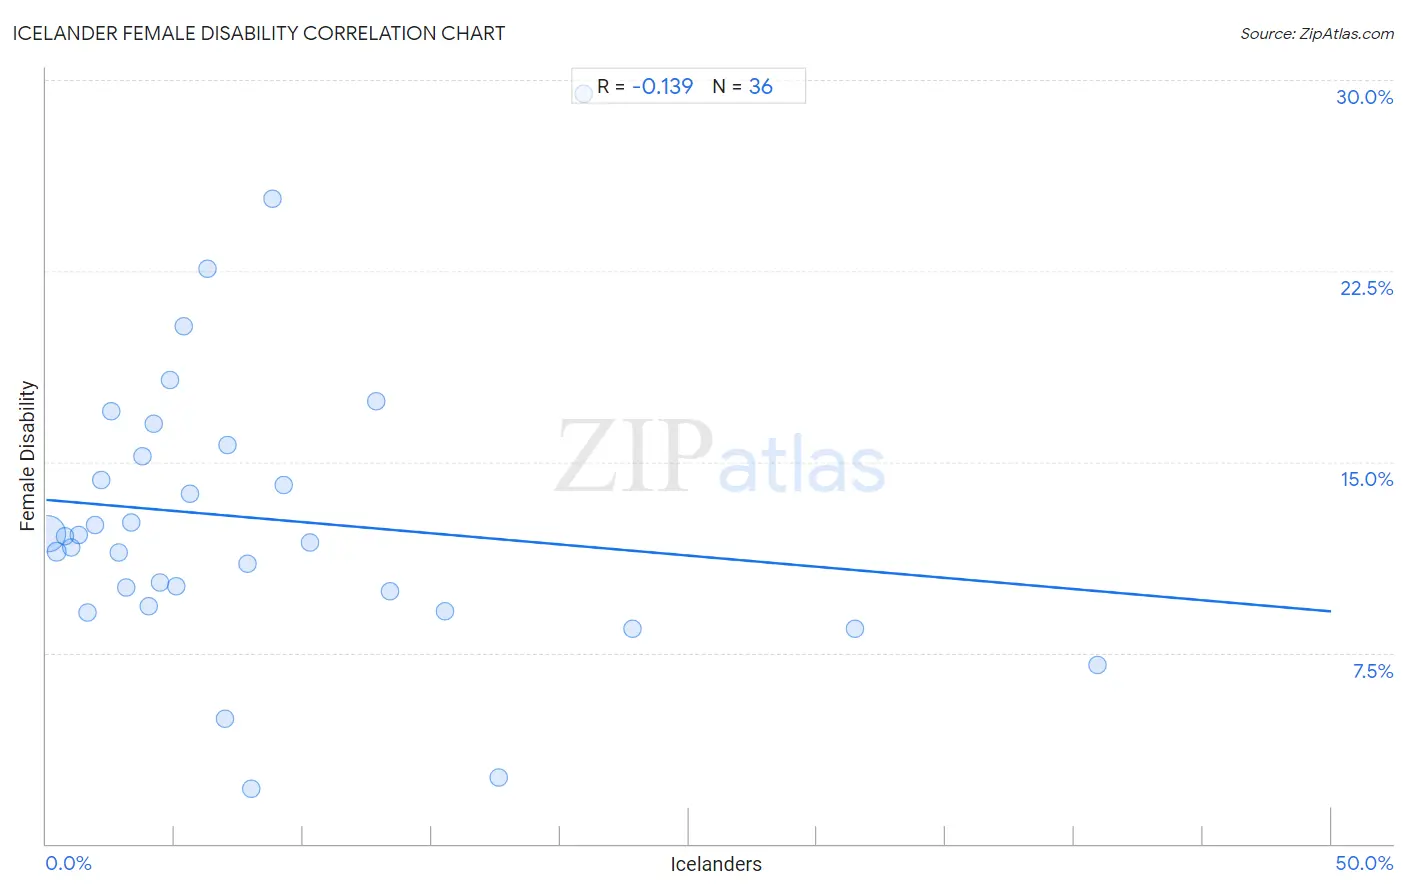
Icelander Female Disability Correlation Chart

The statistical analysis conducted on geographies consisting of 159,642,732 people shows a poor negative correlation between the proportion of Icelanders and percentage of females with a disability in the United States with a correlation coefficient (R) of -0.139 and weighted average of 12.0%. On average, for every 1% (one percent) increase in Icelanders within a typical geography, there is a decrease of 0.088% in percentage of females with a disability.
Icelander Female Disability
It is essential to understand that the correlation between the percentage of Icelanders and percentage of females with a disability does not imply a direct cause-and-effect relationship. It remains uncertain whether the presence of Icelanders influences an upward or downward trend in the level of percentage of females with a disability within an area, or if Icelanders simply ended up residing in those areas with higher or lower levels of percentage of females with a disability due to other factors.

Demographics Similar to Icelanders by Female Disability

In terms of female disability, the demographic groups most similar to Icelanders are Immigrants from Moldova (12.0%, a difference of 0.040%), Greek (12.0%, a difference of 0.080%), Immigrants from Scotland (12.0%, a difference of 0.090%), Sudanese (12.0%, a difference of 0.090%), and Immigrants from Kenya (12.0%, a difference of 0.15%).
DemographicsRating | RankFemale Disability
Immigrants from Austria
87.9
/100
|
#144
Excellent
12.0%
Estonians
87.8
/100
|
#145
Excellent
12.0%
Pakistanis
84.6
/100
|
#146
Excellent
12.0%
Nigerians
84.0
/100
|
#147
Excellent
12.0%
Immigrants from Kenya
83.1
/100
|
#148
Excellent
12.0%
Greeks
82.0
/100
|
#149
Excellent
12.0%
Immigrants from Moldova
81.4
/100
|
#150
Excellent
12.0%
Icelanders
80.7
/100
|
#151
Excellent
12.0%
Immigrants from Scotland
79.3
/100
|
#152
Good
12.0%
Sudanese
79.1
/100
|
#153
Good
12.0%
Syrians
76.9
/100
|
#154
Good
12.1%
Ghanaians
76.6
/100
|
#155
Good
12.1%
Moroccans
72.9
/100
|
#156
Good
12.1%
Danes
72.5
/100
|
#157
Good
12.1%
Immigrants from Middle Africa
72.4
/100
|
#158
Good
12.1%

Icelander Female Disability Correlation Summary

MeasurementIcelander DataFemale Disability Data
Minimum0.041%2.2%
Maximum40.9%29.5%
Range40.9%27.3%
Mean8.3%12.8%
Median5.2%12.0%
Interquartile 25% (IQ1)2.7%9.6%
Interquartile 75% (IQ3)9.8%15.4%
Interquartile Range (IQR)7.1%5.8%
Standard Deviation (Sample)9.0%5.7%
Standard Deviation (Population)8.8%5.6%

Correlation Details

Icelander PercentileSample SizeFemale Disability
[
0.0%
-
0.5%
]
0.041%
155,065,39012.2%
[
0.0%
-
0.5%
]
0.41%
3,268,44111.5%
[
0.5%
-
1.0%
]
0.74%
704,75112.1%
[
0.5%
-
1.0%
]
1.00%
326,68411.7%
[
1.0%
-
1.5%
]
1.29%
103,35212.1%
[
1.5%
-
2.0%
]
1.59%
63,5609.1%
[
1.5%
-
2.0%
]
1.89%
31,40112.5%
[
2.0%
-
2.5%
]
2.13%
23,20914.3%
[
2.5%
-
3.0%
]
2.51%
7,69917.0%
[
2.5%
-
3.0%
]
2.83%
13,03411.4%
[
3.0%
-
3.5%
]
3.10%
6,03310.0%
[
3.0%
-
3.5%
]
3.30%
1,91112.6%
[
3.5%
-
4.0%
]
3.74%
88215.2%
[
3.5%
-
4.0%
]
3.98%
4,6209.3%
[
4.0%
-
4.5%
]
4.18%
1,43616.5%
[
4.0%
-
4.5%
]
4.45%
2,11310.2%
[
4.5%
-
5.0%
]
4.82%
58118.2%
[
5.0%
-
5.5%
]
5.06%
15810.1%
[
5.0%
-
5.5%
]
5.33%
58220.3%
[
5.5%
-
6.0%
]
5.60%
5,71113.8%
[
6.0%
-
6.5%
]
6.28%
2,35722.6%
[
6.5%
-
7.0%
]
6.95%
5614.9%
[
7.0%
-
7.5%
]
7.05%
22715.7%
[
7.5%
-
8.0%
]
7.82%
99711.0%
[
7.5%
-
8.0%
]
7.97%
2512.2%
[
8.5%
-
9.0%
]
8.81%
15925.3%
[
9.0%
-
9.5%
]
9.26%
1,36014.1%
[
10.0%
-
10.5%
]
10.27%
2,44311.8%
[
12.5%
-
13.0%
]
12.82%
19517.4%
[
13.0%
-
13.5%
]
13.40%
2099.9%
[
15.5%
-
16.0%
]
15.51%
1879.2%
[
17.5%
-
18.0%
]
17.61%
3522.6%
[
20.5%
-
21.0%
]
20.90%
24429.5%
[
22.5%
-
23.0%
]
22.80%
5358.5%
[
31.0%
-
31.5%
]
31.48%
9538.4%
[
40.5%
-
41.0%
]
40.91%
1547.0%