Houma vs Iranian 1 or more Vehicles in Household

COMPARE

Houma
Race
Ancestry
AfghanAfricanAlaska NativeAlaskan AthabascanAlbanianAleutAlsatianAmericanApacheArabArapahoArgentineanArmenianAssyrian/Chaldean/SyriacAustralianAustrianBahamianBangladeshiBarbadianBasqueBelgianBelizeanBermudanBhutaneseBlackfeetBolivianBrazilianBritishBritish West IndianBulgarianBurmeseCajunCambodianCanadianCape VerdeanCarpatho RusynCelticCentral AmericanCentral American IndianCherokeeCheyenneChickasawChileanChineseChippewaChoctawColombianColvilleComancheCosta RicanCreeCreekCroatianCrowCubanCypriotCzechCzechoslovakianDanishDelawareDominicanDutchDutch West IndianEastern EuropeanEcuadorianEgyptianEnglishEstonianEthiopianEuropeanFijianFilipinoFinnishFrenchFrench American IndianFrench CanadianGermanGerman RussianGhanaianGreekGuamanian/ChamorroGuatemalanGuyaneseHaitianHmongHonduranHopiHoumaHungarianIcelanderIndian (Asian)IndonesianInupiatIraqiIrishIroquoisIsraeliItalianJamaicanJapaneseJordanianKenyanKiowaKoreanLaotianLatvianLebaneseLiberianLithuanianLumbeeLuxembourgerMacedonianMalaysianMalteseMarshalleseMenomineeMexicanMexican American IndianMongolianMoroccanNative HawaiianNavajoNepaleseNew ZealanderNicaraguanNigerianNorthern EuropeanNorwegianOkinawanOsageOttawaPaiutePakistaniPalestinianPanamanianParaguayanPennsylvania GermanPeruvianPimaPolishPortuguesePotawatomiPuebloPuerto RicanPuget Sound SalishRomanianRussianSalvadoranSamoanScandinavianScotch-IrishScottishSeminoleSenegaleseSerbianShoshoneSierra LeoneanSiouxSlavicSlovakSloveneSomaliSouth AfricanSouth AmericanSouth American IndianSoviet UnionSpaniardSpanishSpanish AmericanSpanish American IndianSri LankanSubsaharan AfricanSudaneseSwedishSwissSyrianTaiwaneseThaiTlingit-HaidaTohono O'OdhamTonganTrinidadian and TobagonianTsimshianTurkishU.S. Virgin IslanderUgandanUkrainianUruguayanUteVenezuelanVietnameseWelshWest IndianYakamaYaquiYugoslavianYumanYup'ikZimbabwean
Immigration
NonimmigrantsImmigrantsAfghanistanAfricaAlbaniaArgentinaArmeniaAsiaAustraliaAustriaBahamasBangladeshBarbadosBelarusBelgiumBelizeBoliviaBosnia and HerzegovinaBrazilBulgariaBurma/MyanmarCabo VerdeCambodiaCameroonCanadaCaribbeanCentral AmericaChileChinaColombiaCongoCosta RicaCroatiaCubaCzechoslovakiaDenmarkDominicaDominican RepublicEastern AfricaEastern AsiaEastern EuropeEcuadorEgyptEl SalvadorEnglandEritreaEthiopiaEuropeFijiFranceGermanyGhanaGreeceGrenadaGuatemalaGuyanaHaitiHondurasHong KongHungaryIndiaIndonesiaIranIraqIrelandIsraelItalyJamaicaJapanJordanKazakhstanKenyaKoreaKuwaitLaosLatin AmericaLatviaLebanonLiberiaLithuaniaMalaysiaMexicoMicronesiaMiddle AfricaMoldovaMoroccoNepalNetherlandsNicaraguaNigeriaNorth AmericaNorth MacedoniaNorthern AfricaNorthern EuropeNorwayOceaniaPakistanPanamaPeruPhilippinesPolandPortugalRomaniaRussiaSaudi ArabiaScotlandSenegalSerbiaSierra LeoneSingaporeSomaliaSouth AfricaSouth AmericaSouth Central AsiaSouth Eastern AsiaSouthern EuropeSpainSri LankaSt. Vincent and the GrenadinesSudanSwedenSwitzerlandSyriaTaiwanThailandTrinidad and TobagoTurkeyUgandaUkraineUruguayUzbekistanVenezuelaVietnamWest IndiesWestern AfricaWestern AsiaWestern EuropeYemenZaireZimbabweAzores
Iranian
Race
Ancestry
AfghanAfricanAlaska NativeAlaskan AthabascanAlbanianAleutAlsatianAmericanApacheArabArapahoArgentineanArmenianAssyrian/Chaldean/SyriacAustralianAustrianBahamianBangladeshiBarbadianBasqueBelgianBelizeanBermudanBhutaneseBlackfeetBolivianBrazilianBritishBritish West IndianBulgarianBurmeseCajunCambodianCanadianCape VerdeanCarpatho RusynCelticCentral AmericanCentral American IndianCherokeeCheyenneChickasawChileanChineseChippewaChoctawColombianColvilleComancheCosta RicanCreeCreekCroatianCrowCubanCypriotCzechCzechoslovakianDanishDelawareDominicanDutchDutch West IndianEastern EuropeanEcuadorianEgyptianEnglishEstonianEthiopianEuropeanFijianFilipinoFinnishFrenchFrench American IndianFrench CanadianGermanGerman RussianGhanaianGreekGuamanian/ChamorroGuatemalanGuyaneseHaitianHmongHonduranHopiHungarianIcelanderIndian (Asian)IndonesianInupiatIranianIraqiIrishIroquoisIsraeliItalianJamaicanJapaneseJordanianKenyanKiowaKoreanLaotianLatvianLebaneseLiberianLithuanianLumbeeLuxembourgerMacedonianMalaysianMalteseMarshalleseMenomineeMexicanMexican American IndianMongolianMoroccanNative HawaiianNavajoNepaleseNew ZealanderNicaraguanNigerianNorthern EuropeanNorwegianOkinawanOsageOttawaPaiutePakistaniPalestinianPanamanianParaguayanPennsylvania GermanPeruvianPimaPolishPortuguesePotawatomiPuebloPuerto RicanPuget Sound SalishRomanianRussianSalvadoranSamoanScandinavianScotch-IrishScottishSeminoleSenegaleseSerbianShoshoneSierra LeoneanSiouxSlavicSlovakSloveneSomaliSouth AfricanSouth AmericanSouth American IndianSoviet UnionSpaniardSpanishSpanish AmericanSpanish American IndianSri LankanSubsaharan AfricanSudaneseSwedishSwissSyrianTaiwaneseThaiTlingit-HaidaTohono O'OdhamTonganTrinidadian and TobagonianTsimshianTurkishU.S. Virgin IslanderUgandanUkrainianUruguayanUteVenezuelanVietnameseWelshWest IndianYakamaYaquiYugoslavianYumanYup'ikZimbabwean
Immigration
NonimmigrantsImmigrantsAfghanistanAfricaAlbaniaArgentinaArmeniaAsiaAustraliaAustriaBahamasBangladeshBarbadosBelarusBelgiumBelizeBoliviaBosnia and HerzegovinaBrazilBulgariaBurma/MyanmarCabo VerdeCambodiaCameroonCanadaCaribbeanCentral AmericaChileChinaColombiaCongoCosta RicaCroatiaCubaCzechoslovakiaDenmarkDominicaDominican RepublicEastern AfricaEastern AsiaEastern EuropeEcuadorEgyptEl SalvadorEnglandEritreaEthiopiaEuropeFijiFranceGermanyGhanaGreeceGrenadaGuatemalaGuyanaHaitiHondurasHong KongHungaryIndiaIndonesiaIranIraqIrelandIsraelItalyJamaicaJapanJordanKazakhstanKenyaKoreaKuwaitLaosLatin AmericaLatviaLebanonLiberiaLithuaniaMalaysiaMexicoMicronesiaMiddle AfricaMoldovaMoroccoNepalNetherlandsNicaraguaNigeriaNorth AmericaNorth MacedoniaNorthern AfricaNorthern EuropeNorwayOceaniaPakistanPanamaPeruPhilippinesPolandPortugalRomaniaRussiaSaudi ArabiaScotlandSenegalSerbiaSierra LeoneSingaporeSomaliaSouth AfricaSouth AmericaSouth Central AsiaSouth Eastern AsiaSouthern EuropeSpainSri LankaSt. Vincent and the GrenadinesSudanSwedenSwitzerlandSyriaTaiwanThailandTrinidad and TobagoTurkeyUgandaUkraineUruguayUzbekistanVenezuelaVietnamWest IndiesWestern AfricaWestern AsiaWestern EuropeYemenZaireZimbabweAzores
1 or more Vehicles in Household
Income
Poverty
Unemployment
Labor Participation
Family Structure
Vehicle Availability
Education Level
Disability

1 or more Vehicles in Household Comparison

Houma

Iranians

Tragic
Exceptional
88.6%
1 OR MORE VEHICLES IN HOUSEHOLD
4.8/ 100
METRIC RATING
233rd/ 347
METRIC RANK
91.5%
1 OR MORE VEHICLES IN HOUSEHOLD
99.4/ 100
METRIC RATING
78th/ 347
METRIC RANK

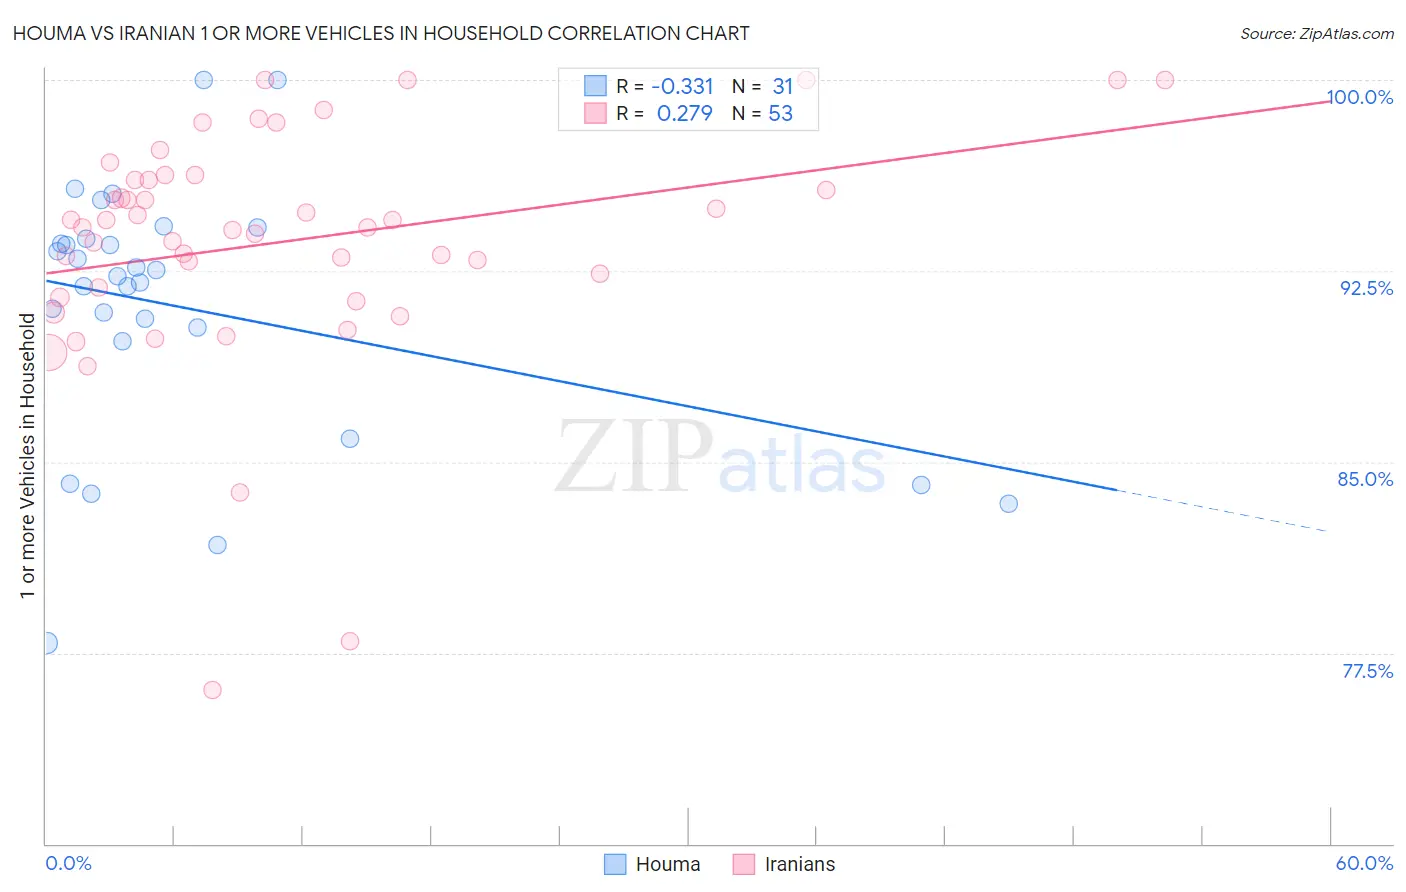
Houma vs Iranian 1 or more Vehicles in Household Correlation Chart

The statistical analysis conducted on geographies consisting of 36,796,778 people shows a mild negative correlation between the proportion of Houma and percentage of households with 1 or more vehicles available in the United States with a correlation coefficient (R) of -0.331 and weighted average of 88.6%. Similarly, the statistical analysis conducted on geographies consisting of 316,682,996 people shows a weak positive correlation between the proportion of Iranians and percentage of households with 1 or more vehicles available in the United States with a correlation coefficient (R) of 0.279 and weighted average of 91.5%, a difference of 3.2%.
Houma vs Iranian 1 or more Vehicles in Household

1 or more Vehicles in Household Correlation Summary

MeasurementHoumaIranian
Minimum77.9%76.0%
Maximum100.0%100.0%
Range22.1%24.0%
Mean91.0%93.6%
Median92.3%94.2%
Interquartile 25% (IQ1)89.7%91.6%
Interquartile 75% (IQ3)93.8%96.2%
Interquartile Range (IQR)4.0%4.5%
Standard Deviation (Sample)5.1%4.7%
Standard Deviation (Population)5.0%4.7%

Similar Demographics by 1 or more Vehicles in Household

Demographics Similar to Houma by 1 or more Vehicles in Household

In terms of 1 or more vehicles in household, the demographic groups most similar to Houma are Immigrants from Japan (88.7%, a difference of 0.010%), Immigrants from Peru (88.6%, a difference of 0.010%), Paiute (88.6%, a difference of 0.010%), Russian (88.7%, a difference of 0.020%), and Immigrants from Pakistan (88.6%, a difference of 0.030%).
DemographicsRating | Rank1 or more Vehicles in Household
Cheyenne
5.7
/100
|
#226
Tragic
88.7%
Ute
5.6
/100
|
#227
Tragic
88.7%
Immigrants | Norway
5.5
/100
|
#228
Tragic
88.7%
Immigrants | Romania
5.4
/100
|
#229
Tragic
88.7%
Immigrants | Sierra Leone
5.2
/100
|
#230
Tragic
88.7%
Russians
5.0
/100
|
#231
Tragic
88.7%
Immigrants | Japan
4.9
/100
|
#232
Tragic
88.7%
Houma
4.8
/100
|
#233
Tragic
88.6%
Immigrants | Peru
4.7
/100
|
#234
Tragic
88.6%
Paiute
4.6
/100
|
#235
Tragic
88.6%
Immigrants | Pakistan
4.5
/100
|
#236
Tragic
88.6%
Immigrants | Turkey
4.4
/100
|
#237
Tragic
88.6%
Immigrants | Somalia
4.2
/100
|
#238
Tragic
88.6%
Kiowa
3.8
/100
|
#239
Tragic
88.6%
Eastern Europeans
3.0
/100
|
#240
Tragic
88.5%

Demographics Similar to Iranians by 1 or more Vehicles in Household

In terms of 1 or more vehicles in household, the demographic groups most similar to Iranians are Immigrants from Philippines (91.5%, a difference of 0.0%), Immigrants from South Central Asia (91.5%, a difference of 0.020%), Bolivian (91.5%, a difference of 0.020%), Cuban (91.5%, a difference of 0.040%), and Immigrants from South Eastern Asia (91.4%, a difference of 0.050%).
DemographicsRating | Rank1 or more Vehicles in Household
Poles
99.7
/100
|
#71
Exceptional
91.7%
Cajuns
99.7
/100
|
#72
Exceptional
91.7%
Immigrants | Iran
99.7
/100
|
#73
Exceptional
91.7%
Immigrants | Lebanon
99.6
/100
|
#74
Exceptional
91.6%
Portuguese
99.5
/100
|
#75
Exceptional
91.6%
Cubans
99.5
/100
|
#76
Exceptional
91.5%
Immigrants | Philippines
99.4
/100
|
#77
Exceptional
91.5%
Iranians
99.4
/100
|
#78
Exceptional
91.5%
Immigrants | South Central Asia
99.4
/100
|
#79
Exceptional
91.5%
Bolivians
99.4
/100
|
#80
Exceptional
91.5%
Immigrants | South Eastern Asia
99.3
/100
|
#81
Exceptional
91.4%
Lebanese
99.3
/100
|
#82
Exceptional
91.4%
Immigrants | England
99.3
/100
|
#83
Exceptional
91.4%
Jordanians
99.3
/100
|
#84
Exceptional
91.4%
Tsimshian
99.3
/100
|
#85
Exceptional
91.4%