Asian Female Disability
COMPARE
Asian
Select to Compare
Female Disability
Asian Female Disability
10.9%
DISABILITY | FEMALES
100.0/ 100
METRIC RATING
21st/ 347
METRIC RANK
Asian Female Disability Correlation Chart
The statistical analysis conducted on geographies consisting of 550,713,500 people shows a mild negative correlation between the proportion of Asians and percentage of females with a disability in the United States with a correlation coefficient (R) of -0.363 and weighted average of 10.9%. On average, for every 1% (one percent) increase in Asians within a typical geography, there is a decrease of 0.036% in percentage of females with a disability.
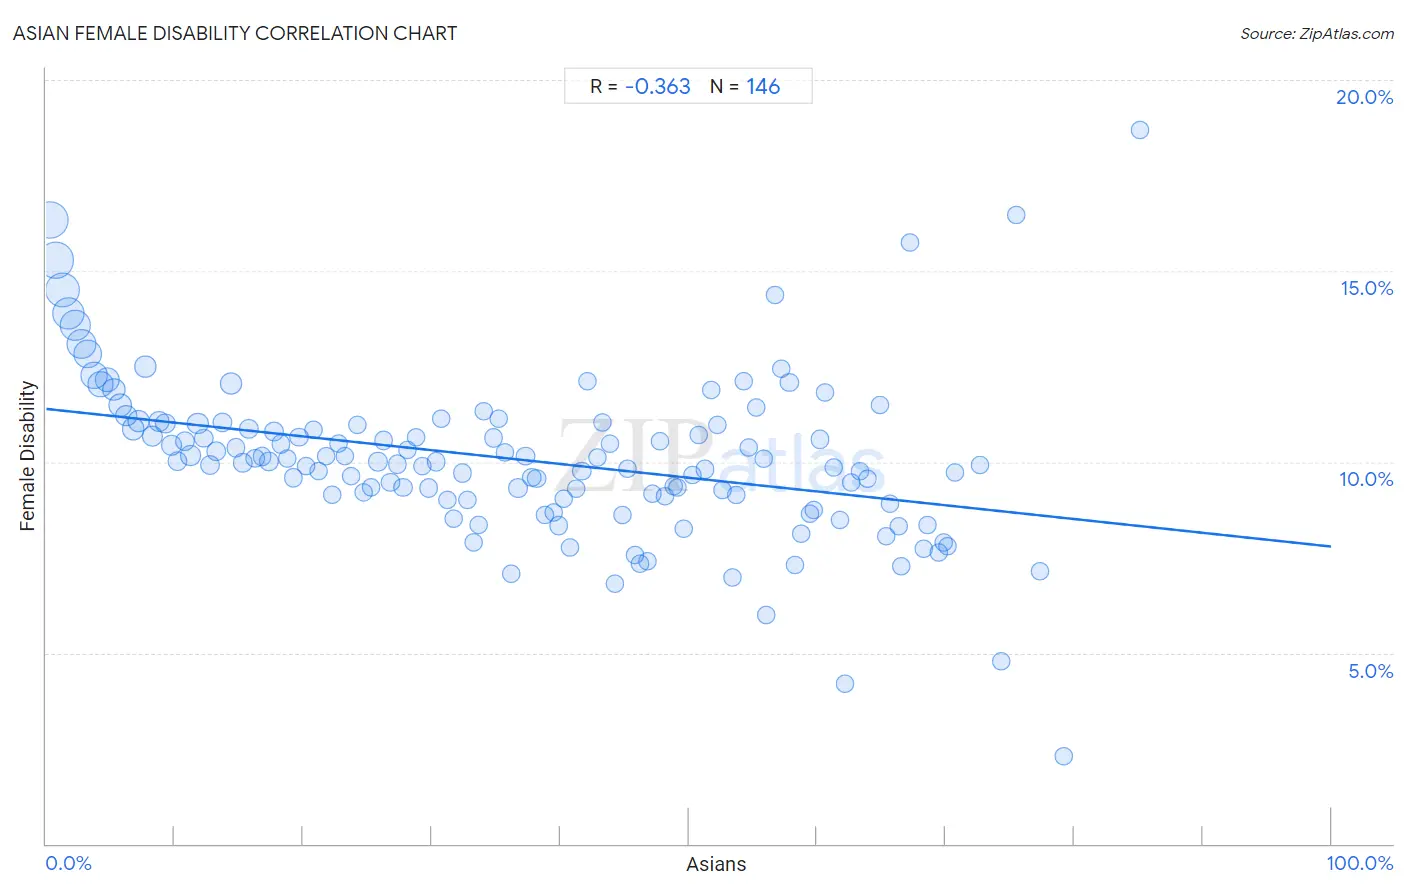
It is essential to understand that the correlation between the percentage of Asians and percentage of females with a disability does not imply a direct cause-and-effect relationship. It remains uncertain whether the presence of Asians influences an upward or downward trend in the level of percentage of females with a disability within an area, or if Asians simply ended up residing in those areas with higher or lower levels of percentage of females with a disability due to other factors.
Demographics Similar to Asians by Female Disability
In terms of female disability, the demographic groups most similar to Asians are Immigrants from Sri Lanka (10.9%, a difference of 0.13%), Venezuelan (11.0%, a difference of 0.35%), Immigrants from Pakistan (10.9%, a difference of 0.36%), Immigrants from Venezuela (10.9%, a difference of 0.54%), and Immigrants from Iran (10.8%, a difference of 0.75%).
| Demographics | Rating | Rank | Female Disability |
| Immigrants from China | 100.0 /100 | #14 | Exceptional 10.7% |
| Burmese | 100.0 /100 | #15 | Exceptional 10.7% |
| Okinawans | 100.0 /100 | #16 | Exceptional 10.8% |
| Indians (Asian) | 100.0 /100 | #17 | Exceptional 10.8% |
| Immigrants from Iran | 100.0 /100 | #18 | Exceptional 10.8% |
| Immigrants from Venezuela | 100.0 /100 | #19 | Exceptional 10.9% |
| Immigrants from Pakistan | 100.0 /100 | #20 | Exceptional 10.9% |
| Asians | 100.0 /100 | #21 | Exceptional 10.9% |
| Immigrants from Sri Lanka | 100.0 /100 | #22 | Exceptional 10.9% |
| Venezuelans | 100.0 /100 | #23 | Exceptional 11.0% |
| Immigrants from Argentina | 100.0 /100 | #24 | Exceptional 11.0% |
| Immigrants from Asia | 100.0 /100 | #25 | Exceptional 11.0% |
| Argentineans | 100.0 /100 | #26 | Exceptional 11.0% |
| Immigrants from Turkey | 100.0 /100 | #27 | Exceptional 11.1% |
| Egyptians | 100.0 /100 | #28 | Exceptional 11.1% |
Asian Female Disability Correlation Summary
| Measurement | Asian Data | Female Disability Data |
| Minimum | 0.26% | 2.3% |
| Maximum | 85.1% | 18.7% |
| Range | 84.9% | 16.4% |
| Mean | 36.8% | 10.1% |
| Median | 36.4% | 10.0% |
| Interquartile 25% (IQ1) | 18.3% | 9.0% |
| Interquartile 75% (IQ3) | 54.7% | 11.0% |
| Interquartile Range (IQR) | 36.4% | 1.9% |
| Standard Deviation (Sample) | 21.7% | 2.2% |
| Standard Deviation (Population) | 21.6% | 2.1% |
Correlation Details
| Asian Percentile | Sample Size | Female Disability |
[ 0.0% - 0.5% ] 0.26% | 53,791,026 | 16.3% |
[ 0.5% - 1.0% ] 0.74% | 52,432,589 | 15.3% |
[ 1.0% - 1.5% ] 1.25% | 46,674,458 | 14.5% |
[ 1.5% - 2.0% ] 1.74% | 41,566,377 | 13.9% |
[ 2.0% - 2.5% ] 2.25% | 34,191,856 | 13.6% |
[ 2.5% - 3.0% ] 2.73% | 31,092,588 | 13.1% |
[ 3.0% - 3.5% ] 3.24% | 27,642,701 | 12.8% |
[ 3.5% - 4.0% ] 3.73% | 23,001,052 | 12.3% |
[ 4.0% - 4.5% ] 4.21% | 18,705,233 | 12.0% |
[ 4.5% - 5.0% ] 4.73% | 19,040,420 | 12.1% |
[ 5.0% - 5.5% ] 5.26% | 13,508,253 | 11.9% |
[ 5.5% - 6.0% ] 5.75% | 13,301,593 | 11.5% |
[ 6.0% - 6.5% ] 6.23% | 10,576,574 | 11.2% |
[ 6.5% - 7.0% ] 6.76% | 14,163,384 | 10.9% |
[ 7.0% - 7.5% ] 7.18% | 11,640,430 | 11.1% |
[ 7.5% - 8.0% ] 7.71% | 8,606,254 | 12.5% |
[ 8.0% - 8.5% ] 8.27% | 7,560,800 | 10.7% |
[ 8.5% - 9.0% ] 8.76% | 5,661,917 | 11.1% |
[ 9.0% - 9.5% ] 9.25% | 5,231,987 | 11.0% |
[ 9.5% - 10.0% ] 9.75% | 5,640,087 | 10.4% |
[ 10.0% - 10.5% ] 10.25% | 3,933,633 | 10.0% |
[ 10.5% - 11.0% ] 10.76% | 3,963,134 | 10.5% |
[ 11.0% - 11.5% ] 11.24% | 4,234,036 | 10.2% |
[ 11.5% - 12.0% ] 11.79% | 8,675,831 | 11.0% |
[ 12.0% - 12.5% ] 12.27% | 3,120,289 | 10.6% |
[ 12.5% - 13.0% ] 12.72% | 3,390,651 | 9.9% |
[ 13.0% - 13.5% ] 13.26% | 3,637,328 | 10.3% |
[ 13.5% - 14.0% ] 13.74% | 4,012,687 | 11.0% |
[ 14.0% - 14.5% ] 14.40% | 12,099,747 | 12.1% |
[ 14.5% - 15.0% ] 14.77% | 2,109,145 | 10.4% |
[ 15.0% - 15.5% ] 15.27% | 2,023,324 | 10.0% |
[ 15.5% - 16.0% ] 15.78% | 3,039,819 | 10.9% |
[ 16.0% - 16.5% ] 16.23% | 2,379,961 | 10.1% |
[ 16.5% - 17.0% ] 16.79% | 2,265,977 | 10.1% |
[ 17.0% - 17.5% ] 17.31% | 2,607,878 | 10.0% |
[ 17.5% - 18.0% ] 17.71% | 2,018,248 | 10.8% |
[ 18.0% - 18.5% ] 18.28% | 2,038,653 | 10.5% |
[ 18.5% - 19.0% ] 18.74% | 1,276,906 | 10.1% |
[ 19.0% - 19.5% ] 19.25% | 2,085,819 | 9.6% |
[ 19.5% - 20.0% ] 19.68% | 1,861,971 | 10.6% |
[ 20.0% - 20.5% ] 20.25% | 957,945 | 9.9% |
[ 20.5% - 21.0% ] 20.80% | 1,157,027 | 10.8% |
[ 21.0% - 21.5% ] 21.20% | 1,003,848 | 9.8% |
[ 21.5% - 22.0% ] 21.75% | 500,723 | 10.1% |
[ 22.0% - 22.5% ] 22.26% | 1,515,413 | 9.1% |
[ 22.5% - 23.0% ] 22.73% | 1,218,721 | 10.5% |
[ 23.0% - 23.5% ] 23.26% | 801,117 | 10.1% |
[ 23.5% - 24.0% ] 23.75% | 726,353 | 9.6% |
[ 24.0% - 24.5% ] 24.25% | 783,046 | 11.0% |
[ 24.5% - 25.0% ] 24.70% | 696,705 | 9.2% |
[ 25.0% - 25.5% ] 25.28% | 976,942 | 9.3% |
[ 25.5% - 26.0% ] 25.80% | 1,136,503 | 10.0% |
[ 26.0% - 26.5% ] 26.26% | 1,025,589 | 10.6% |
[ 26.5% - 27.0% ] 26.78% | 898,024 | 9.5% |
[ 27.0% - 27.5% ] 27.30% | 800,577 | 9.9% |
[ 27.5% - 28.0% ] 27.76% | 459,490 | 9.3% |
[ 28.0% - 28.5% ] 28.15% | 399,530 | 10.3% |
[ 28.5% - 29.0% ] 28.77% | 848,541 | 10.6% |
[ 29.0% - 29.5% ] 29.25% | 632,025 | 9.9% |
[ 29.5% - 30.0% ] 29.75% | 875,991 | 9.3% |
[ 30.0% - 30.5% ] 30.33% | 681,741 | 10.0% |
[ 30.5% - 31.0% ] 30.69% | 316,638 | 11.1% |
[ 31.0% - 31.5% ] 31.25% | 435,356 | 9.0% |
[ 31.5% - 32.0% ] 31.70% | 354,290 | 8.5% |
[ 32.0% - 32.5% ] 32.36% | 283,079 | 9.7% |
[ 32.5% - 33.0% ] 32.75% | 379,325 | 9.0% |
[ 33.0% - 33.5% ] 33.24% | 510,629 | 7.9% |
[ 33.5% - 34.0% ] 33.68% | 515,682 | 8.3% |
[ 34.0% - 34.5% ] 34.06% | 110,076 | 11.3% |
[ 34.5% - 35.0% ] 34.79% | 1,325,296 | 10.6% |
[ 35.0% - 35.5% ] 35.24% | 335,763 | 11.1% |
[ 35.5% - 36.0% ] 35.71% | 538,620 | 10.3% |
[ 36.0% - 36.5% ] 36.17% | 140,910 | 7.1% |
[ 36.5% - 37.0% ] 36.72% | 483,172 | 9.3% |
[ 37.0% - 37.5% ] 37.30% | 562,602 | 10.2% |
[ 37.5% - 38.0% ] 37.79% | 446,356 | 9.6% |
[ 38.0% - 38.5% ] 38.17% | 1,332,443 | 9.6% |
[ 38.5% - 39.0% ] 38.79% | 217,104 | 8.6% |
[ 39.0% - 39.5% ] 39.47% | 244,274 | 8.7% |
[ 39.5% - 40.0% ] 39.89% | 299,306 | 8.3% |
[ 40.0% - 40.5% ] 40.27% | 156,576 | 9.0% |
[ 40.5% - 41.0% ] 40.75% | 143,246 | 7.8% |
[ 41.0% - 41.5% ] 41.20% | 211,734 | 9.3% |
[ 41.5% - 42.0% ] 41.68% | 558,620 | 9.8% |
[ 42.0% - 42.5% ] 42.12% | 123,436 | 12.1% |
[ 42.5% - 43.0% ] 42.85% | 178,995 | 10.1% |
[ 43.0% - 43.5% ] 43.29% | 292,241 | 11.0% |
[ 43.5% - 44.0% ] 43.84% | 213,582 | 10.5% |
[ 44.0% - 44.5% ] 44.29% | 406,566 | 6.8% |
[ 44.5% - 45.0% ] 44.80% | 142,721 | 8.6% |
[ 45.0% - 45.5% ] 45.20% | 70,333 | 9.8% |
[ 45.5% - 46.0% ] 45.82% | 31,342 | 7.6% |
[ 46.0% - 46.5% ] 46.23% | 74,176 | 7.3% |
[ 46.5% - 47.0% ] 46.76% | 188,178 | 7.4% |
[ 47.0% - 47.5% ] 47.19% | 195,881 | 9.2% |
[ 47.5% - 48.0% ] 47.75% | 135,081 | 10.5% |
[ 48.0% - 48.5% ] 48.13% | 228,738 | 9.1% |
[ 48.5% - 49.0% ] 48.80% | 149,383 | 9.4% |
[ 49.0% - 49.5% ] 49.17% | 268,981 | 9.3% |
[ 49.5% - 50.0% ] 49.63% | 209,622 | 8.2% |
[ 50.0% - 50.5% ] 50.33% | 156,457 | 9.6% |
[ 50.5% - 51.0% ] 50.75% | 223,066 | 10.7% |
[ 51.0% - 51.5% ] 51.31% | 193,613 | 9.8% |
[ 51.5% - 52.0% ] 51.77% | 120,112 | 11.9% |
[ 52.0% - 52.5% ] 52.26% | 550,031 | 11.0% |
[ 52.5% - 53.0% ] 52.62% | 86,202 | 9.2% |
[ 53.0% - 53.5% ] 53.39% | 179,366 | 7.0% |
[ 53.5% - 54.0% ] 53.74% | 168,493 | 9.1% |
[ 54.0% - 54.5% ] 54.31% | 156,175 | 12.1% |
[ 54.5% - 55.0% ] 54.70% | 178,510 | 10.4% |
[ 55.0% - 55.5% ] 55.23% | 68,476 | 11.4% |
[ 55.5% - 56.0% ] 55.87% | 196,316 | 10.1% |
[ 56.0% - 56.5% ] 56.01% | 16,722 | 6.0% |
[ 56.5% - 57.0% ] 56.73% | 21,402 | 14.4% |
[ 57.0% - 57.5% ] 57.17% | 94,153 | 12.5% |
[ 57.5% - 58.0% ] 57.83% | 68,032 | 12.1% |
[ 58.0% - 58.5% ] 58.24% | 134,842 | 7.3% |
[ 58.5% - 59.0% ] 58.79% | 229,316 | 8.1% |
[ 59.0% - 59.5% ] 59.41% | 93,745 | 8.6% |
[ 59.5% - 60.0% ] 59.77% | 43,851 | 8.7% |
[ 60.0% - 60.5% ] 60.23% | 187,009 | 10.6% |
[ 60.5% - 61.0% ] 60.60% | 153,666 | 11.8% |
[ 61.0% - 61.5% ] 61.27% | 132,470 | 9.9% |
[ 61.5% - 62.0% ] 61.81% | 265,452 | 8.5% |
[ 62.0% - 62.5% ] 62.16% | 21,929 | 4.2% |
[ 62.5% - 63.0% ] 62.67% | 166,706 | 9.5% |
[ 63.0% - 63.5% ] 63.32% | 59,151 | 9.8% |
[ 63.5% - 64.0% ] 63.93% | 59,410 | 9.6% |
[ 64.5% - 65.0% ] 64.88% | 101,367 | 11.5% |
[ 65.0% - 65.5% ] 65.39% | 117,012 | 8.1% |
[ 65.5% - 66.0% ] 65.67% | 64,377 | 8.9% |
[ 66.0% - 66.5% ] 66.31% | 4,185 | 8.3% |
[ 66.5% - 67.0% ] 66.58% | 54,137 | 7.3% |
[ 67.0% - 67.5% ] 67.23% | 40,134 | 15.7% |
[ 68.0% - 68.5% ] 68.31% | 25,001 | 7.7% |
[ 68.5% - 69.0% ] 68.56% | 39,565 | 8.3% |
[ 69.0% - 69.5% ] 69.44% | 8,835 | 7.6% |
[ 69.5% - 70.0% ] 69.85% | 219,899 | 7.9% |
[ 70.0% - 70.5% ] 70.18% | 68,613 | 7.8% |
[ 70.5% - 71.0% ] 70.74% | 57,753 | 9.7% |
[ 72.5% - 73.0% ] 72.64% | 79,495 | 9.9% |
[ 74.0% - 74.5% ] 74.33% | 37,671 | 4.8% |
[ 75.5% - 76.0% ] 75.52% | 2,549 | 16.5% |
[ 77.0% - 77.5% ] 77.32% | 53,464 | 7.1% |
[ 79.0% - 79.5% ] 79.14% | 954 | 2.3% |
[ 85.0% - 85.5% ] 85.11% | 2,996 | 18.7% |