Hoffman, NC Map & Demographics
Hoffman Map
Hoffman Overview
$22,093
PER CAPITA INCOME
$45,114
AVG FAMILY INCOME
$35,781
AVG HOUSEHOLD INCOME
44.3%
WAGE / INCOME GAP [ % ]
55.7¢/ $1
WAGE / INCOME GAP [ $ ]
0.58
INEQUALITY / GINI INDEX
829
TOTAL POPULATION
379
MALE POPULATION
450
FEMALE POPULATION
84.22
MALES / 100 FEMALES
118.73
FEMALES / 100 MALES
29.6
MEDIAN AGE
4.8
AVG FAMILY SIZE
4.1
AVG HOUSEHOLD SIZE
284
LABOR FORCE [ PEOPLE ]
40.9%
PERCENT IN LABOR FORCE
Hoffman Zip Codes
Hoffman Area Codes
Income in Hoffman
Income Overview in Hoffman
Per Capita Income in Hoffman is $22,093, while median incomes of families and households are $45,114 and $35,781 respectively.
| Characteristic | Number | Measure |
| Per Capita Income | 829 | $22,093 |
| Median Family Income | 131 | $45,114 |
| Mean Family Income | 131 | $78,085 |
| Median Household Income | 201 | $35,781 |
| Mean Household Income | 201 | $57,672 |
| Income Deficit | 131 | $0 |
| Wage / Income Gap (%) | 829 | 44.31% |
| Wage / Income Gap ($) | 829 | 55.69¢ per $1 |
| Gini / Inequality Index | 829 | 0.58 |
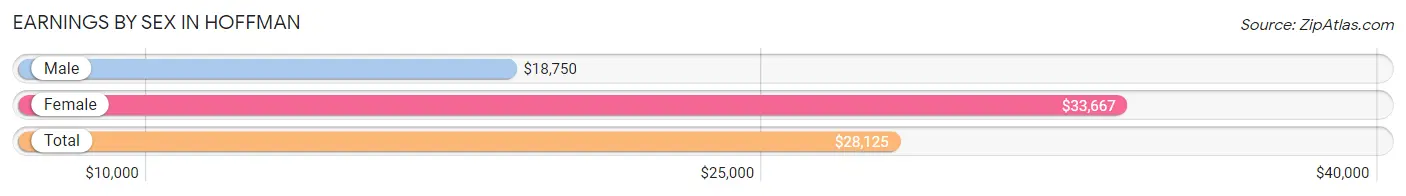
Earnings by Sex in Hoffman
Average Earnings in Hoffman are $28,125, $18,750 for men and $33,667 for women, a difference of 44.3%.
| Sex | Number | Average Earnings |
| Male | 188 (64.4%) | $18,750 |
| Female | 104 (35.6%) | $33,667 |
| Total | 292 (100.0%) | $28,125 |
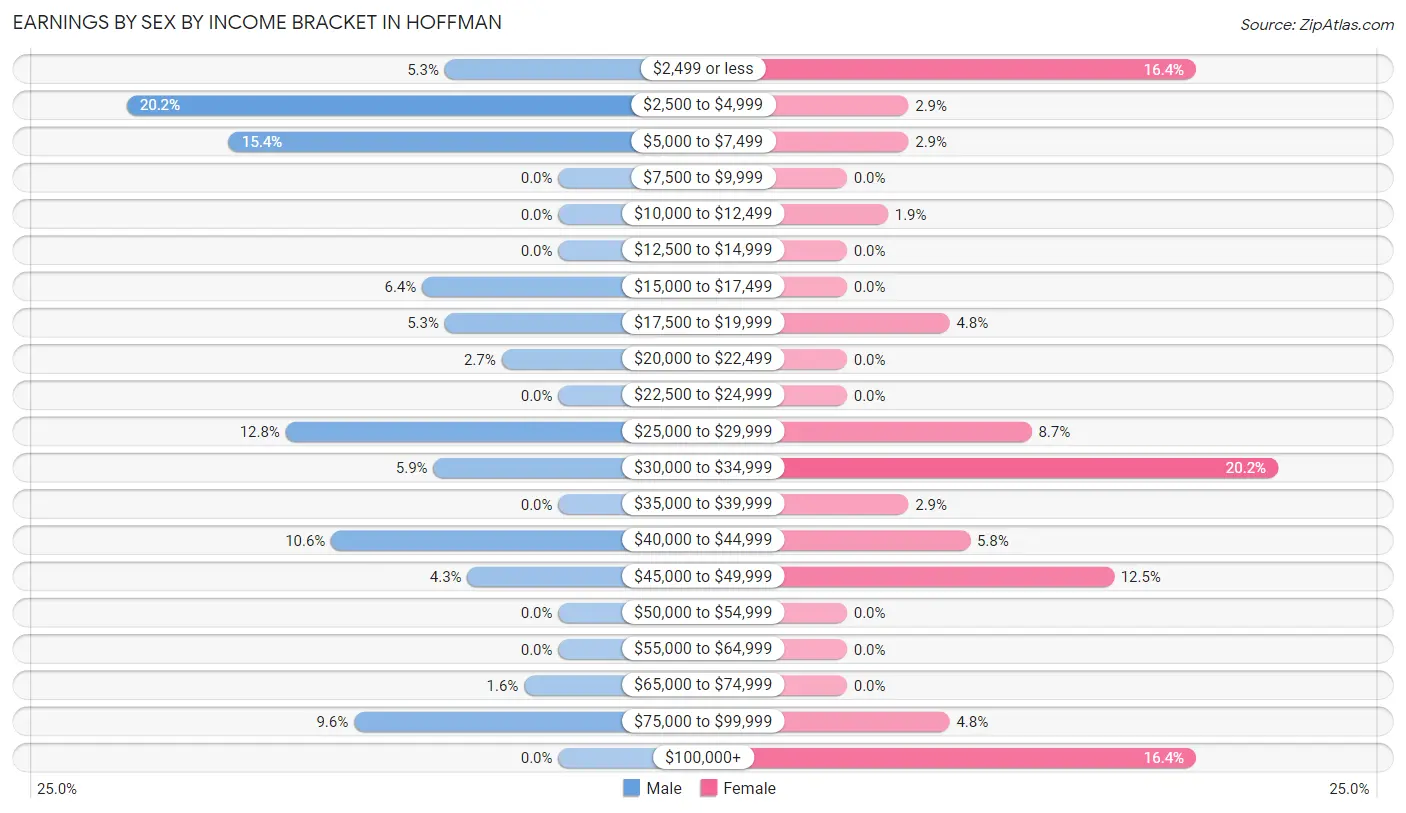
Earnings by Sex by Income Bracket in Hoffman
The most common earnings brackets in Hoffman are $2,500 to $4,999 for men (38 | 20.2%) and $30,000 to $34,999 for women (21 | 20.2%).
| Income | Male | Female |
| $2,499 or less | 10 (5.3%) | 17 (16.4%) |
| $2,500 to $4,999 | 38 (20.2%) | 3 (2.9%) |
| $5,000 to $7,499 | 29 (15.4%) | 3 (2.9%) |
| $7,500 to $9,999 | 0 (0.0%) | 0 (0.0%) |
| $10,000 to $12,499 | 0 (0.0%) | 2 (1.9%) |
| $12,500 to $14,999 | 0 (0.0%) | 0 (0.0%) |
| $15,000 to $17,499 | 12 (6.4%) | 0 (0.0%) |
| $17,500 to $19,999 | 10 (5.3%) | 5 (4.8%) |
| $20,000 to $22,499 | 5 (2.7%) | 0 (0.0%) |
| $22,500 to $24,999 | 0 (0.0%) | 0 (0.0%) |
| $25,000 to $29,999 | 24 (12.8%) | 9 (8.6%) |
| $30,000 to $34,999 | 11 (5.9%) | 21 (20.2%) |
| $35,000 to $39,999 | 0 (0.0%) | 3 (2.9%) |
| $40,000 to $44,999 | 20 (10.6%) | 6 (5.8%) |
| $45,000 to $49,999 | 8 (4.3%) | 13 (12.5%) |
| $50,000 to $54,999 | 0 (0.0%) | 0 (0.0%) |
| $55,000 to $64,999 | 0 (0.0%) | 0 (0.0%) |
| $65,000 to $74,999 | 3 (1.6%) | 0 (0.0%) |
| $75,000 to $99,999 | 18 (9.6%) | 5 (4.8%) |
| $100,000+ | 0 (0.0%) | 17 (16.4%) |
| Total | 188 (100.0%) | 104 (100.0%) |
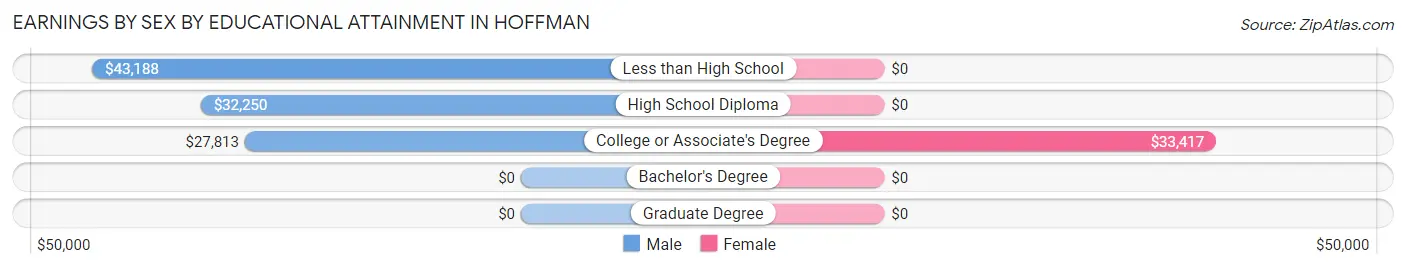
Earnings by Sex by Educational Attainment in Hoffman
Average earnings in Hoffman are $29,125 for men and $33,917 for women, a difference of 14.1%. Men with an educational attainment of less than high school enjoy the highest average annual earnings of $43,188, while those with college or associate's degree education earn the least with $27,813. Women with an educational attainment of college or associate's degree earn the most with the average annual earnings of $33,417, while those with college or associate's degree education have the smallest earnings of $33,417.
| Educational Attainment | Male Income | Female Income |
| Less than High School | $43,188 | $0 |
| High School Diploma | $32,250 | $0 |
| College or Associate's Degree | $27,813 | $33,417 |
| Bachelor's Degree | - | - |
| Graduate Degree | - | - |
| Total | $29,125 | $33,917 |
Family Income in Hoffman
Family Income Brackets in Hoffman
According to the Hoffman family income data, there are 38 families falling into the $35,000 to $49,999 income range, which is the most common income bracket and makes up 29.0% of all families.
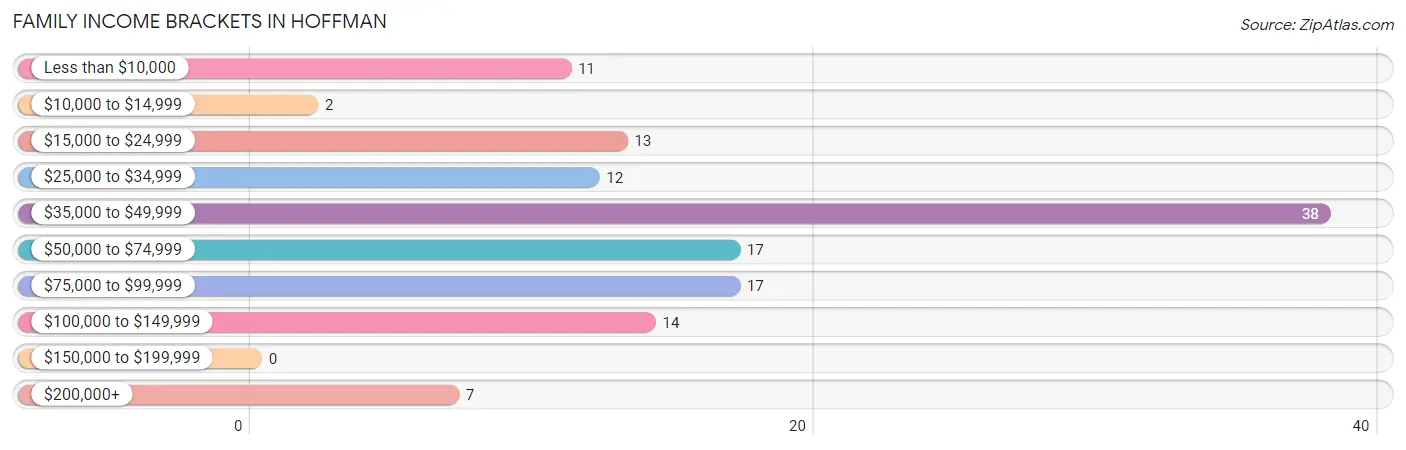
| Income Bracket | # Families | % Families |
| Less than $10,000 | 11 | 8.4% |
| $10,000 to $14,999 | 2 | 1.5% |
| $15,000 to $24,999 | 13 | 9.9% |
| $25,000 to $34,999 | 12 | 9.2% |
| $35,000 to $49,999 | 38 | 29.0% |
| $50,000 to $74,999 | 17 | 13.0% |
| $75,000 to $99,999 | 17 | 13.0% |
| $100,000 to $149,999 | 14 | 10.7% |
| $150,000 to $199,999 | 0 | 0.0% |
| $200,000+ | 7 | 5.3% |
Family Income by Famaliy Size in Hoffman
3-person families (50 | 38.2%) account for the highest median family income in Hoffman with $51,071 per family, while 2-person families (55 | 42.0%) have the highest median income of $19,688 per family member.
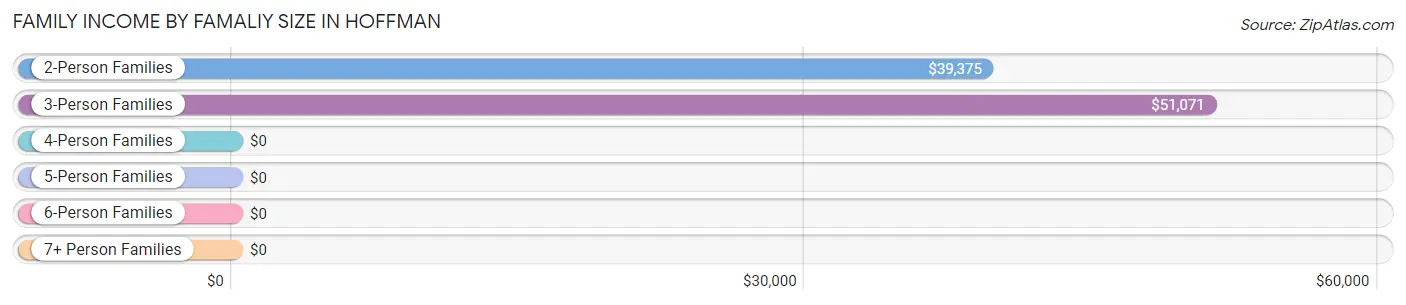
| Income Bracket | # Families | Median Income |
| 2-Person Families | 55 (42.0%) | $39,375 |
| 3-Person Families | 50 (38.2%) | $51,071 |
| 4-Person Families | 11 (8.4%) | $0 |
| 5-Person Families | 8 (6.1%) | $0 |
| 6-Person Families | 0 (0.0%) | $0 |
| 7+ Person Families | 7 (5.3%) | $0 |
| Total | 131 (100.0%) | $45,114 |
Family Income by Number of Earners in Hoffman
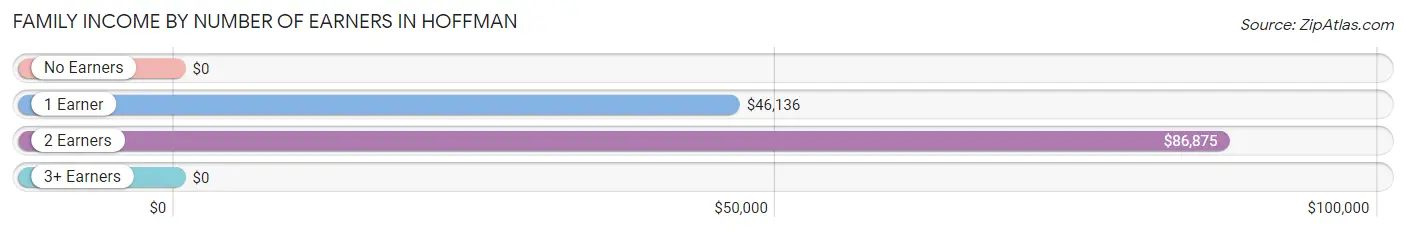
| Number of Earners | # Families | Median Income |
| No Earners | 33 (25.2%) | $0 |
| 1 Earner | 58 (44.3%) | $46,136 |
| 2 Earners | 33 (25.2%) | $86,875 |
| 3+ Earners | 7 (5.3%) | $0 |
| Total | 131 (100.0%) | $45,114 |
Household Income in Hoffman
Household Income Brackets in Hoffman
With 46 households falling in the category, the $35,000 to $49,999 income range is the most frequent in Hoffman, accounting for 22.9% of all households.
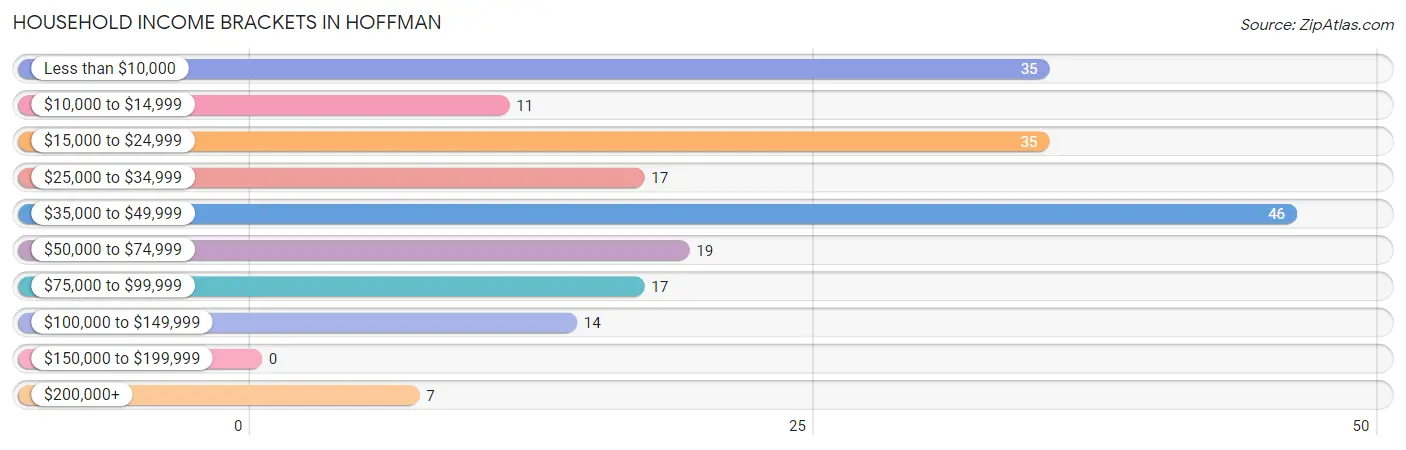
| Income Bracket | # Households | % Households |
| Less than $10,000 | 35 | 17.4% |
| $10,000 to $14,999 | 11 | 5.5% |
| $15,000 to $24,999 | 35 | 17.4% |
| $25,000 to $34,999 | 17 | 8.5% |
| $35,000 to $49,999 | 46 | 22.9% |
| $50,000 to $74,999 | 19 | 9.5% |
| $75,000 to $99,999 | 17 | 8.5% |
| $100,000 to $149,999 | 14 | 7.0% |
| $150,000 to $199,999 | 0 | 0.0% |
| $200,000+ | 7 | 3.5% |
Household Income by Householder Age in Hoffman
The median household income in Hoffman is $35,781, with the highest median household income of $35,938 found in the 45 to 64 years age bracket for the primary householder. A total of 114 households (56.7%) fall into this category. Meanwhile, the 15 to 24 years age bracket for the primary householder has the lowest median household income of $0, with 3 households (1.5%) in this group.
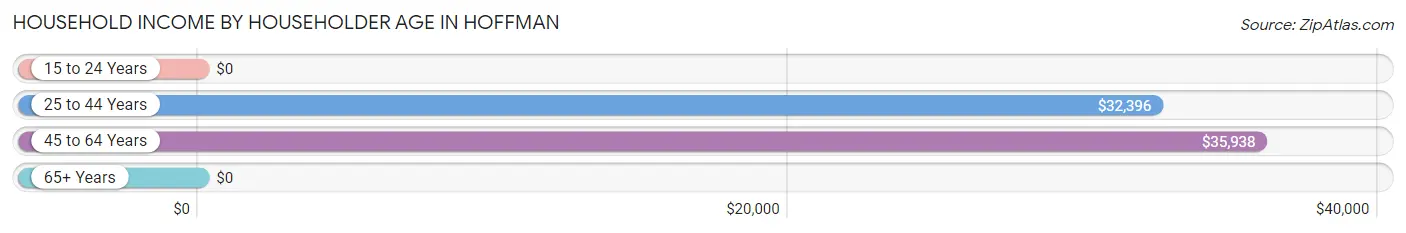
| Income Bracket | # Households | Median Income |
| 15 to 24 Years | 3 (1.5%) | $0 |
| 25 to 44 Years | 53 (26.4%) | $32,396 |
| 45 to 64 Years | 114 (56.7%) | $35,938 |
| 65+ Years | 31 (15.4%) | $0 |
| Total | 201 (100.0%) | $35,781 |
Poverty in Hoffman
Income Below Poverty by Sex and Age in Hoffman
With 20.8% poverty level for males and 47.1% for females among the residents of Hoffman, under 5 year old males and 25 to 34 year old females are the most vulnerable to poverty, with 3 males (100.0%) and 118 females (81.9%) in their respective age groups living below the poverty level.
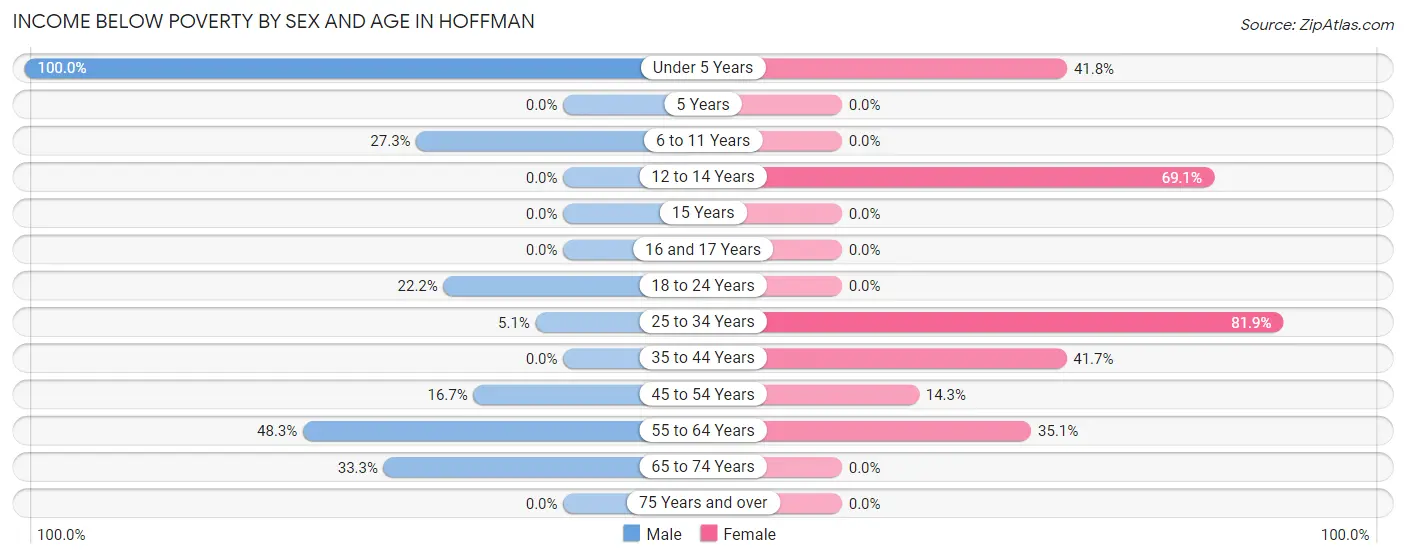
| Age Bracket | Male | Female |
| Under 5 Years | 3 (100.0%) | 28 (41.8%) |
| 5 Years | 0 (0.0%) | 0 (0.0%) |
| 6 to 11 Years | 3 (27.3%) | 0 (0.0%) |
| 12 to 14 Years | 0 (0.0%) | 29 (69.1%) |
| 15 Years | 0 (0.0%) | 0 (0.0%) |
| 16 and 17 Years | 0 (0.0%) | 0 (0.0%) |
| 18 to 24 Years | 22 (22.2%) | 0 (0.0%) |
| 25 to 34 Years | 2 (5.1%) | 118 (81.9%) |
| 35 to 44 Years | 0 (0.0%) | 15 (41.7%) |
| 45 to 54 Years | 3 (16.7%) | 9 (14.3%) |
| 55 to 64 Years | 43 (48.3%) | 13 (35.1%) |
| 65 to 74 Years | 3 (33.3%) | 0 (0.0%) |
| 75 Years and over | 0 (0.0%) | 0 (0.0%) |
| Total | 79 (20.8%) | 212 (47.1%) |
Income Above Poverty by Sex and Age in Hoffman
According to the poverty statistics in Hoffman, males aged 5 years and females aged 6 to 11 years are the age groups that are most secure financially, with 100.0% of males and 100.0% of females in these age groups living above the poverty line.
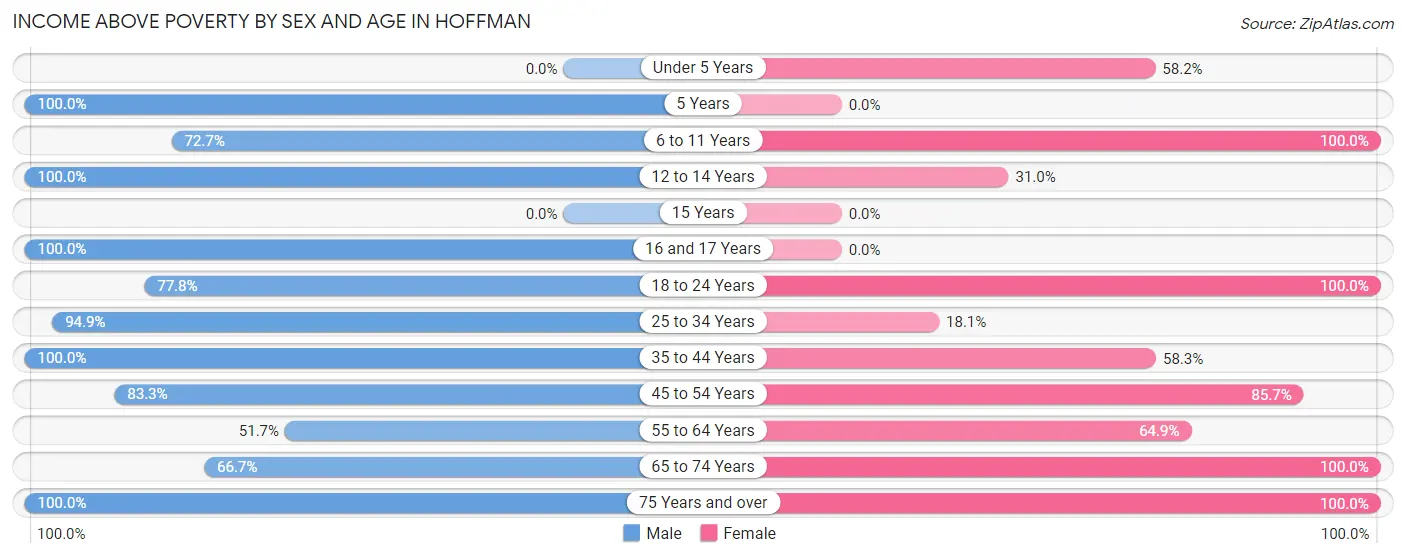
| Age Bracket | Male | Female |
| Under 5 Years | 0 (0.0%) | 39 (58.2%) |
| 5 Years | 3 (100.0%) | 0 (0.0%) |
| 6 to 11 Years | 8 (72.7%) | 7 (100.0%) |
| 12 to 14 Years | 1 (100.0%) | 13 (30.9%) |
| 15 Years | 0 (0.0%) | 0 (0.0%) |
| 16 and 17 Years | 43 (100.0%) | 0 (0.0%) |
| 18 to 24 Years | 77 (77.8%) | 29 (100.0%) |
| 25 to 34 Years | 37 (94.9%) | 26 (18.1%) |
| 35 to 44 Years | 32 (100.0%) | 21 (58.3%) |
| 45 to 54 Years | 15 (83.3%) | 54 (85.7%) |
| 55 to 64 Years | 46 (51.7%) | 24 (64.9%) |
| 65 to 74 Years | 6 (66.7%) | 19 (100.0%) |
| 75 Years and over | 32 (100.0%) | 6 (100.0%) |
| Total | 300 (79.2%) | 238 (52.9%) |
Income Below Poverty Among Married-Couple Families in Hoffman
The poverty statistics for married-couple families in Hoffman show that 3.8% or 2 of the total 52 families live below the poverty line. Families with 1 or 2 children have the highest poverty rate of 8.0%, comprising of 2 families. On the other hand, families with no children have the lowest poverty rate of 0.0%, which includes 0 families.
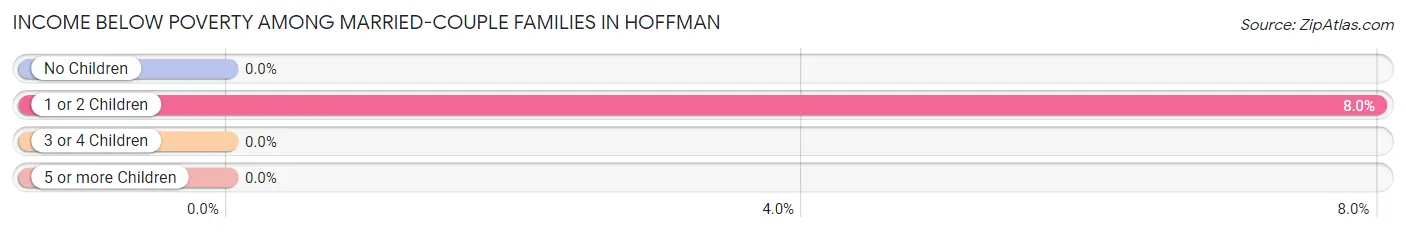
| Children | Above Poverty | Below Poverty |
| No Children | 27 (100.0%) | 0 (0.0%) |
| 1 or 2 Children | 23 (92.0%) | 2 (8.0%) |
| 3 or 4 Children | 0 (0.0%) | 0 (0.0%) |
| 5 or more Children | 0 (0.0%) | 0 (0.0%) |
| Total | 50 (96.2%) | 2 (3.8%) |
Income Below Poverty Among Single-Parent Households in Hoffman
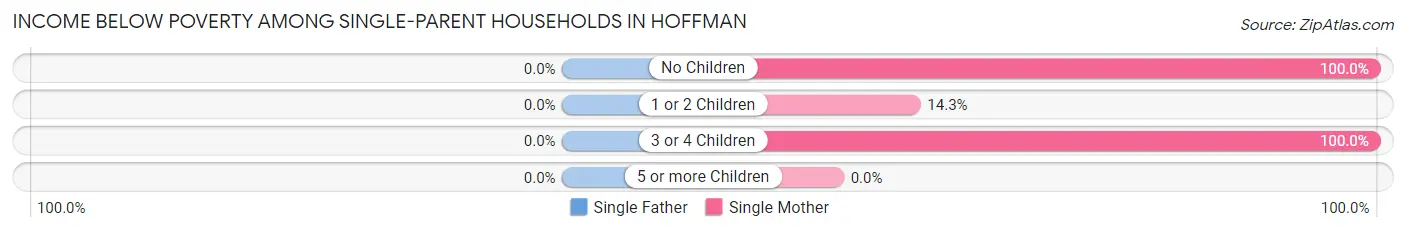
| Children | Single Father | Single Mother |
| No Children | 0 (0.0%) | 10 (100.0%) |
| 1 or 2 Children | 0 (0.0%) | 6 (14.3%) |
| 3 or 4 Children | 0 (0.0%) | 5 (100.0%) |
| 5 or more Children | 0 (0.0%) | 0 (0.0%) |
| Total | 0 (0.0%) | 21 (36.8%) |
Income Below Poverty Among Married-Couple vs Single-Parent Households in Hoffman
The poverty data for Hoffman shows that 2 of the married-couple family households (3.8%) and 21 of the single-parent households (26.6%) are living below the poverty level. Within the married-couple family households, those with 1 or 2 children have the highest poverty rate, with 2 households (8.0%) falling below the poverty line. Among the single-parent households, those with 3 or 4 children have the highest poverty rate, with 5 household (100.0%) living below poverty.
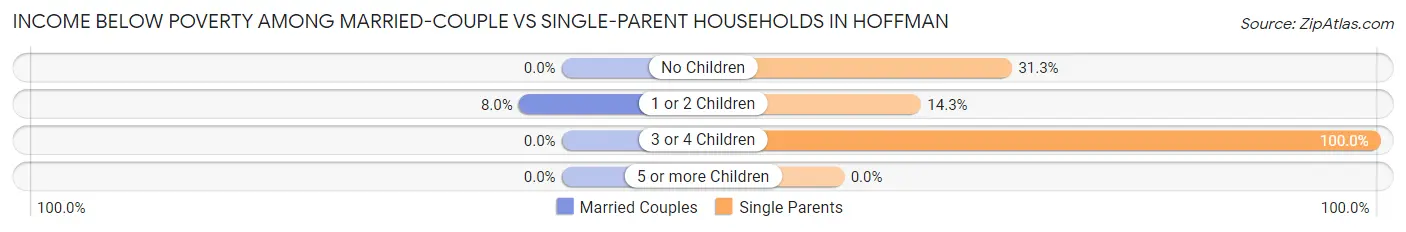
| Children | Married-Couple Families | Single-Parent Households |
| No Children | 0 (0.0%) | 10 (31.2%) |
| 1 or 2 Children | 2 (8.0%) | 6 (14.3%) |
| 3 or 4 Children | 0 (0.0%) | 5 (100.0%) |
| 5 or more Children | 0 (0.0%) | 0 (0.0%) |
| Total | 2 (3.8%) | 21 (26.6%) |
Race in Hoffman
The most populous races in Hoffman are Black / African American (535 | 64.5%), White / Caucasian (169 | 20.4%), and Native / Alaskan (97 | 11.7%).
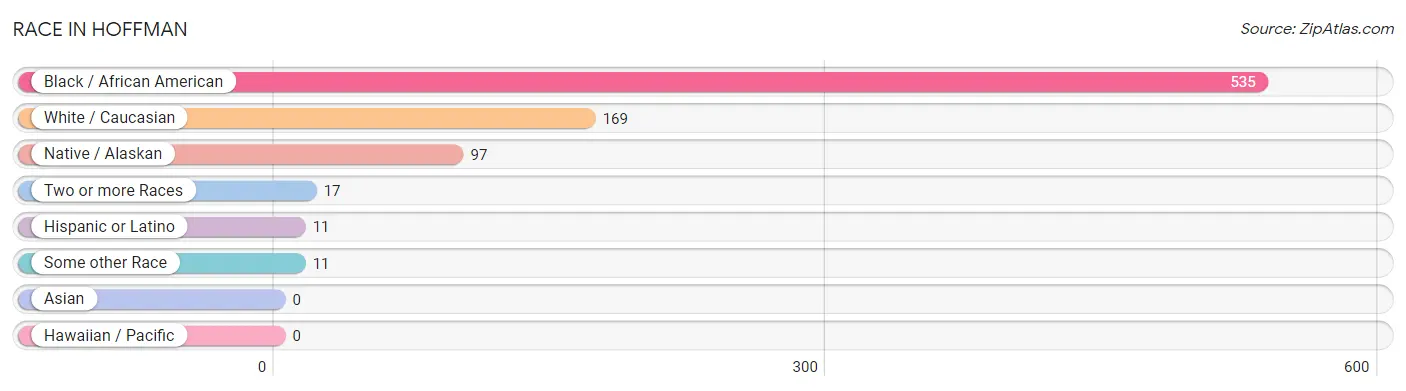
| Race | # Population | % Population |
| Asian | 0 | 0.0% |
| Black / African American | 535 | 64.5% |
| Hawaiian / Pacific | 0 | 0.0% |
| Hispanic or Latino | 11 | 1.3% |
| Native / Alaskan | 97 | 11.7% |
| White / Caucasian | 169 | 20.4% |
| Two or more Races | 17 | 2.1% |
| Some other Race | 11 | 1.3% |
| Total | 829 | 100.0% |
Ancestry in Hoffman
The most populous ancestries reported in Hoffman are Lumbee (105 | 12.7%), English (22 | 2.6%), French (15 | 1.8%), German (15 | 1.8%), and Mexican (11 | 1.3%), together accounting for 20.3% of all Hoffman residents.
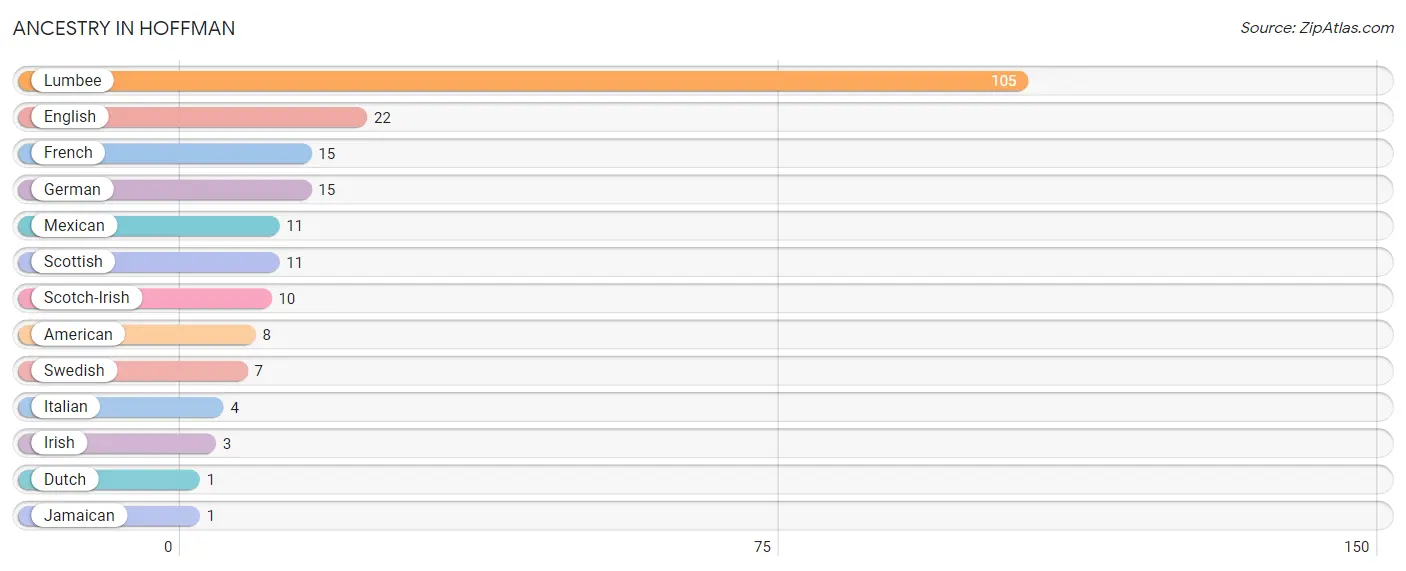
| Ancestry | # Population | % Population |
| American | 8 | 1.0% |
| Dutch | 1 | 0.1% |
| English | 22 | 2.6% |
| French | 15 | 1.8% |
| German | 15 | 1.8% |
| Irish | 3 | 0.4% |
| Italian | 4 | 0.5% |
| Jamaican | 1 | 0.1% |
| Lumbee | 105 | 12.7% |
| Mexican | 11 | 1.3% |
| Scotch-Irish | 10 | 1.2% |
| Scottish | 11 | 1.3% |
| Swedish | 7 | 0.8% | View All 13 Rows |
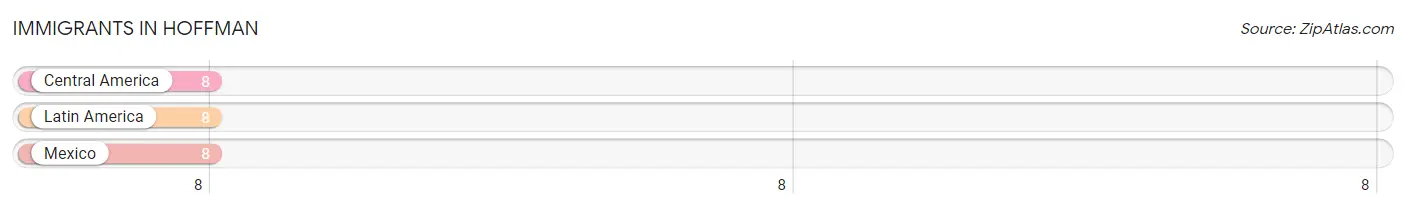
Immigrants in Hoffman
The most numerous immigrant groups reported in Hoffman came from Central America (8 | 1.0%), Latin America (8 | 1.0%), and Mexico (8 | 1.0%), together accounting for 2.9% of all Hoffman residents.
| Immigration Origin | # Population | % Population |
| Central America | 8 | 1.0% |
| Latin America | 8 | 1.0% |
| Mexico | 8 | 1.0% | View All 3 Rows |
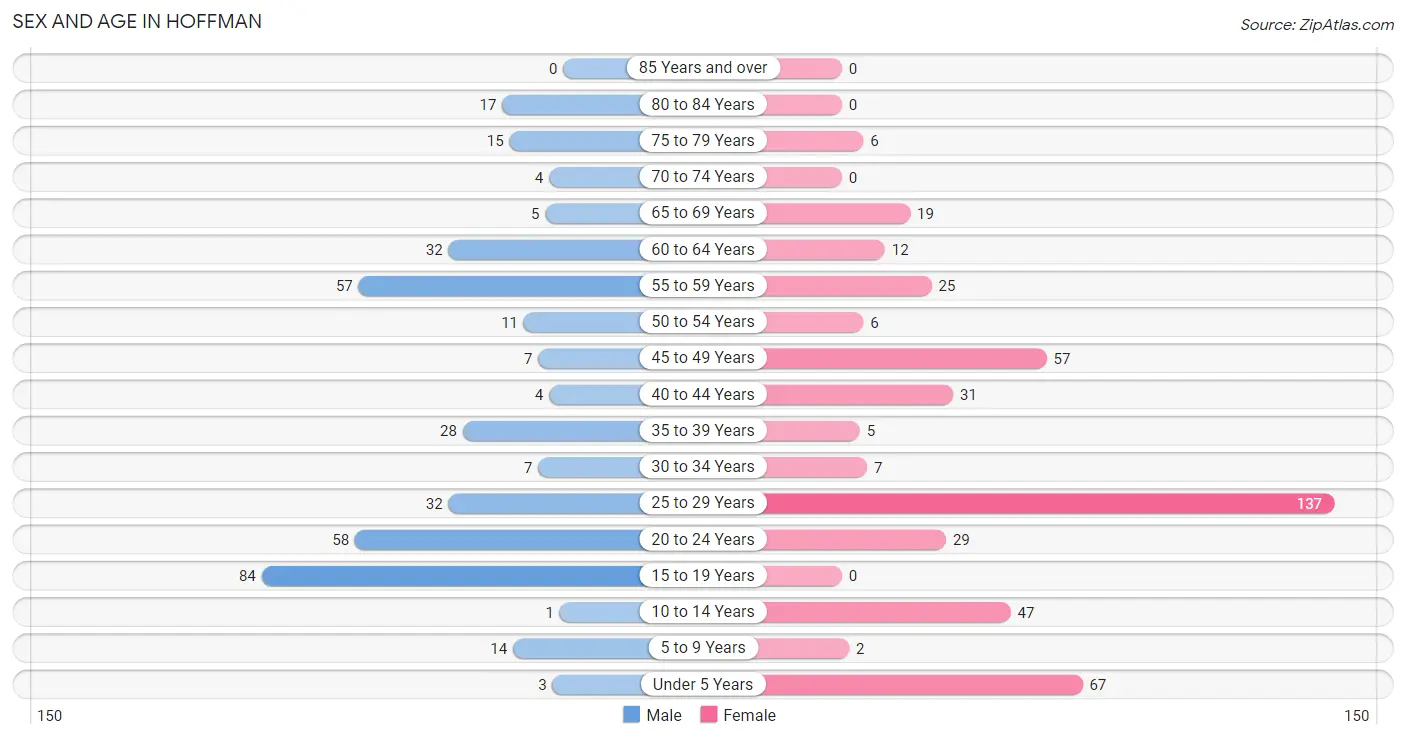
Sex and Age in Hoffman
Sex and Age in Hoffman
The most populous age groups in Hoffman are 15 to 19 Years (84 | 22.2%) for men and 25 to 29 Years (137 | 30.4%) for women.
| Age Bracket | Male | Female |
| Under 5 Years | 3 (0.8%) | 67 (14.9%) |
| 5 to 9 Years | 14 (3.7%) | 2 (0.4%) |
| 10 to 14 Years | 1 (0.3%) | 47 (10.4%) |
| 15 to 19 Years | 84 (22.2%) | 0 (0.0%) |
| 20 to 24 Years | 58 (15.3%) | 29 (6.4%) |
| 25 to 29 Years | 32 (8.4%) | 137 (30.4%) |
| 30 to 34 Years | 7 (1.8%) | 7 (1.6%) |
| 35 to 39 Years | 28 (7.4%) | 5 (1.1%) |
| 40 to 44 Years | 4 (1.1%) | 31 (6.9%) |
| 45 to 49 Years | 7 (1.8%) | 57 (12.7%) |
| 50 to 54 Years | 11 (2.9%) | 6 (1.3%) |
| 55 to 59 Years | 57 (15.0%) | 25 (5.6%) |
| 60 to 64 Years | 32 (8.4%) | 12 (2.7%) |
| 65 to 69 Years | 5 (1.3%) | 19 (4.2%) |
| 70 to 74 Years | 4 (1.1%) | 0 (0.0%) |
| 75 to 79 Years | 15 (4.0%) | 6 (1.3%) |
| 80 to 84 Years | 17 (4.5%) | 0 (0.0%) |
| 85 Years and over | 0 (0.0%) | 0 (0.0%) |
| Total | 379 (100.0%) | 450 (100.0%) |
Families and Households in Hoffman
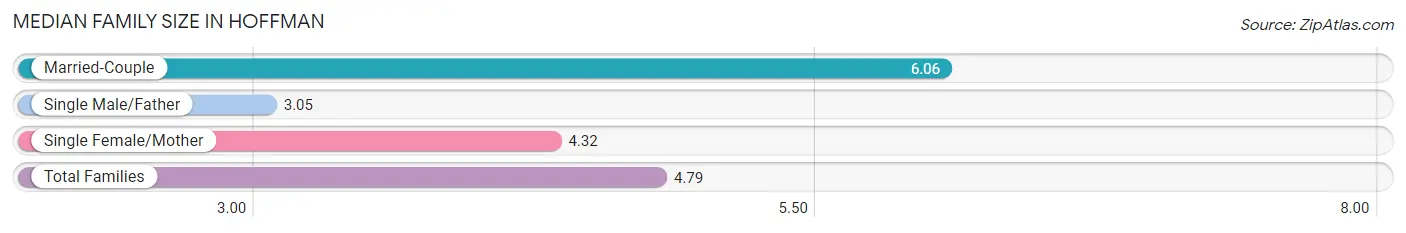
Median Family Size in Hoffman
The median family size in Hoffman is 4.79 persons per family, with married-couple families (52 | 39.7%) accounting for the largest median family size of 6.06 persons per family. On the other hand, single male/father families (22 | 16.8%) represent the smallest median family size with 3.05 persons per family.
| Family Type | # Families | Family Size |
| Married-Couple | 52 (39.7%) | 6.06 |
| Single Male/Father | 22 (16.8%) | 3.05 |
| Single Female/Mother | 57 (43.5%) | 4.32 |
| Total Families | 131 (100.0%) | 4.79 |
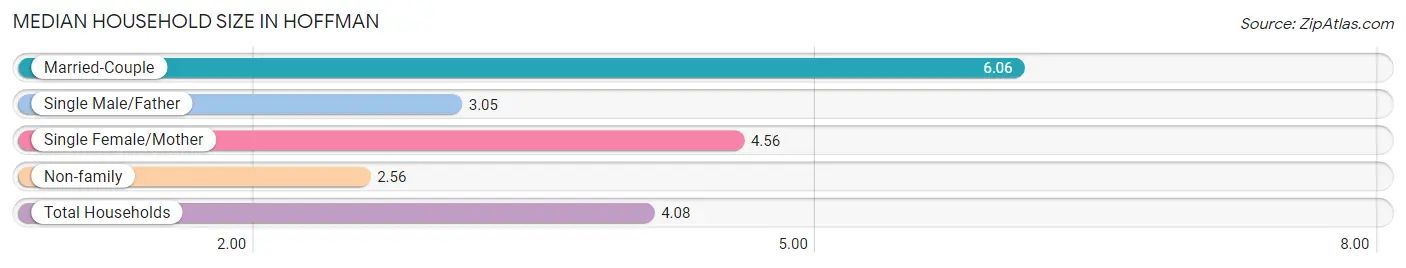
Median Household Size in Hoffman
The median household size in Hoffman is 4.08 persons per household, with married-couple households (52 | 25.9%) accounting for the largest median household size of 6.06 persons per household. non-family households (70 | 34.8%) represent the smallest median household size with 2.56 persons per household.
| Household Type | # Households | Household Size |
| Married-Couple | 52 (25.9%) | 6.06 |
| Single Male/Father | 22 (11.0%) | 3.05 |
| Single Female/Mother | 57 (28.4%) | 4.56 |
| Non-family | 70 (34.8%) | 2.56 |
| Total Households | 201 (100.0%) | 4.08 |
Household Size by Marriage Status in Hoffman
Out of a total of 201 households in Hoffman, 131 (65.2%) are family households, while 70 (34.8%) are nonfamily households. The most numerous type of family households are 3-person households, comprising 56, and the most common type of nonfamily households are 1-person households, comprising 52.
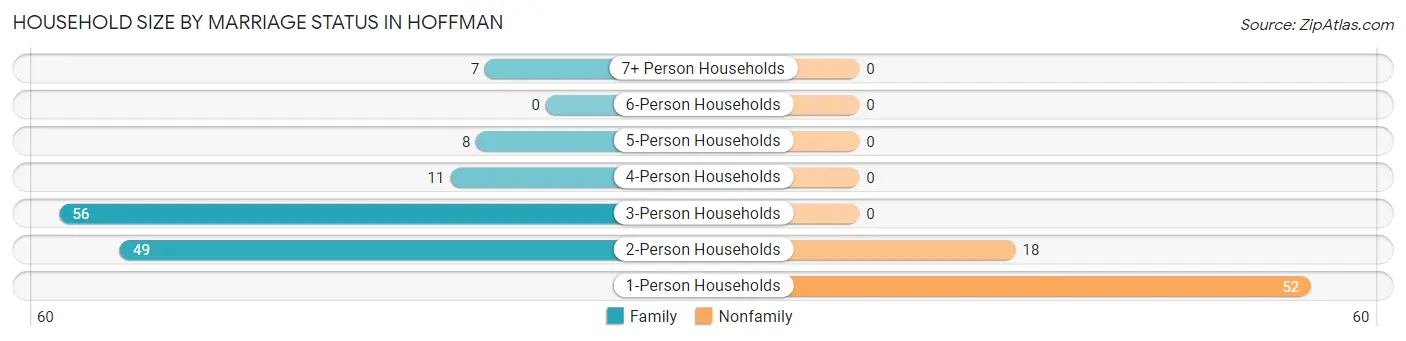
| Household Size | Family Households | Nonfamily Households |
| 1-Person Households | - | 52 (25.9%) |
| 2-Person Households | 49 (24.4%) | 18 (9.0%) |
| 3-Person Households | 56 (27.9%) | 0 (0.0%) |
| 4-Person Households | 11 (5.5%) | 0 (0.0%) |
| 5-Person Households | 8 (4.0%) | 0 (0.0%) |
| 6-Person Households | 0 (0.0%) | 0 (0.0%) |
| 7+ Person Households | 7 (3.5%) | 0 (0.0%) |
| Total | 131 (65.2%) | 70 (34.8%) |
Female Fertility in Hoffman
Fertility by Age in Hoffman
Average fertility rate in Hoffman is 19.0 births per 1,000 women. Women in the age bracket of 20 to 34 years have the highest fertility rate with 29.0 births per 1,000 women. Women in the age bracket of 20 to 34 years acount for 100.0% of all women with births.
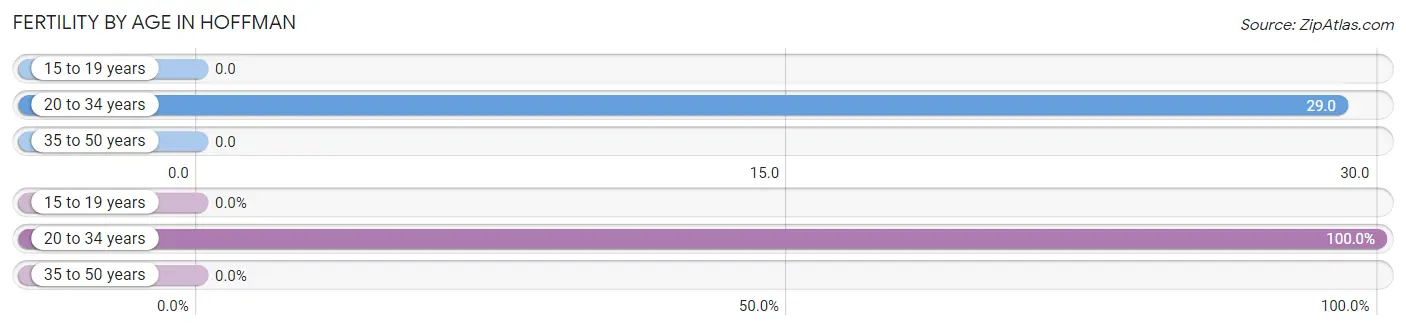
| Age Bracket | Women with Births | Births / 1,000 Women |
| 15 to 19 years | 0 (0.0%) | 0.0 |
| 20 to 34 years | 5 (100.0%) | 29.0 |
| 35 to 50 years | 0 (0.0%) | 0.0 |
| Total | 5 (100.0%) | 19.0 |
Fertility by Age by Marriage Status in Hoffman
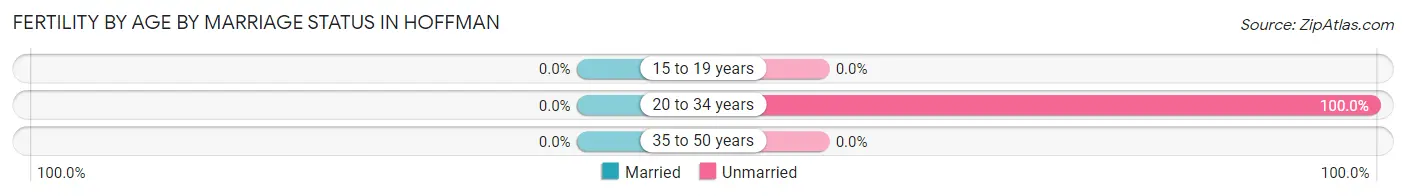
| Age Bracket | Married | Unmarried |
| 15 to 19 years | 0 (0.0%) | 0 (0.0%) |
| 20 to 34 years | 0 (0.0%) | 5 (100.0%) |
| 35 to 50 years | 0 (0.0%) | 0 (0.0%) |
| Total | 0 (0.0%) | 5 (100.0%) |
Fertility by Education in Hoffman
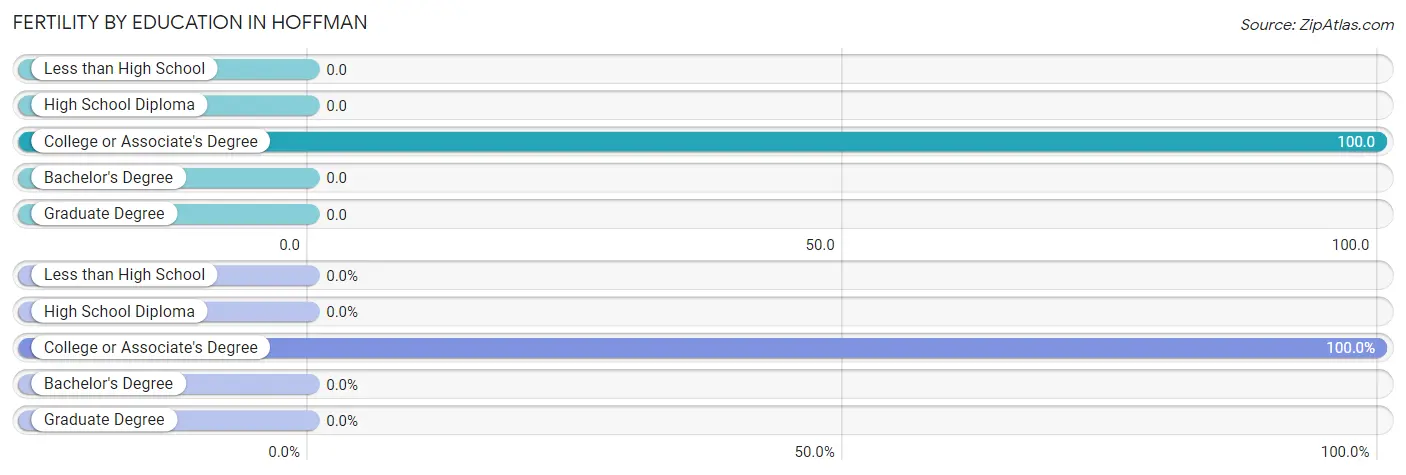
| Educational Attainment | Women with Births | Births / 1,000 Women |
| Less than High School | 0 (0.0%) | 0.0 |
| High School Diploma | 0 (0.0%) | 0.0 |
| College or Associate's Degree | 5 (100.0%) | 100.0 |
| Bachelor's Degree | 0 (0.0%) | 0.0 |
| Graduate Degree | 0 (0.0%) | 0.0 |
| Total | 5 (100.0%) | 19.0 |
Fertility by Education by Marriage Status in Hoffman
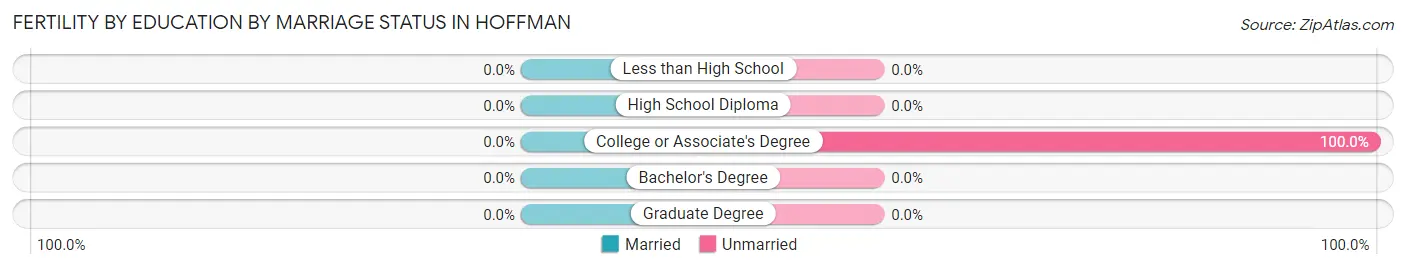
| Educational Attainment | Married | Unmarried |
| Less than High School | 0 (0.0%) | 0 (0.0%) |
| High School Diploma | 0 (0.0%) | 0 (0.0%) |
| College or Associate's Degree | 0 (0.0%) | 5 (100.0%) |
| Bachelor's Degree | 0 (0.0%) | 0 (0.0%) |
| Graduate Degree | 0 (0.0%) | 0 (0.0%) |
| Total | 0 (0.0%) | 5 (100.0%) |
Employment Characteristics in Hoffman
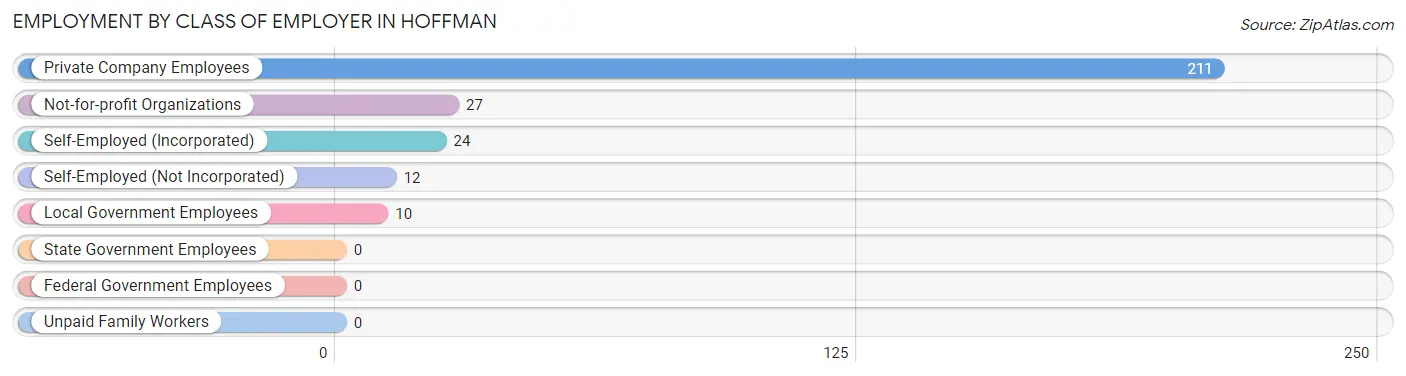
Employment by Class of Employer in Hoffman
Among the 284 employed individuals in Hoffman, private company employees (211 | 74.3%), not-for-profit organizations (27 | 9.5%), and self-employed (incorporated) (24 | 8.5%) make up the most common classes of employment.
| Employer Class | # Employees | % Employees |
| Private Company Employees | 211 | 74.3% |
| Self-Employed (Incorporated) | 24 | 8.5% |
| Self-Employed (Not Incorporated) | 12 | 4.2% |
| Not-for-profit Organizations | 27 | 9.5% |
| Local Government Employees | 10 | 3.5% |
| State Government Employees | 0 | 0.0% |
| Federal Government Employees | 0 | 0.0% |
| Unpaid Family Workers | 0 | 0.0% |
| Total | 284 | 100.0% |
Employment Status by Age in Hoffman
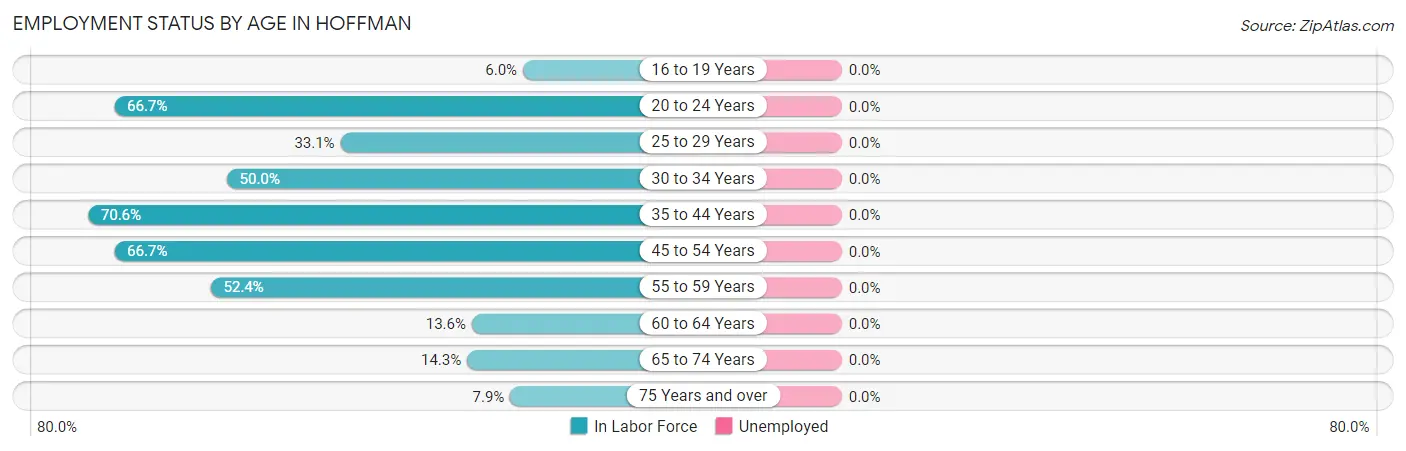
| Age Bracket | In Labor Force | Unemployed |
| 16 to 19 Years | 5 (6.0%) | 0 (0.0%) |
| 20 to 24 Years | 58 (66.7%) | 0 (0.0%) |
| 25 to 29 Years | 56 (33.1%) | 0 (0.0%) |
| 30 to 34 Years | 7 (50.0%) | 0 (0.0%) |
| 35 to 44 Years | 48 (70.6%) | 0 (0.0%) |
| 45 to 54 Years | 54 (66.7%) | 0 (0.0%) |
| 55 to 59 Years | 43 (52.4%) | 0 (0.0%) |
| 60 to 64 Years | 6 (13.6%) | 0 (0.0%) |
| 65 to 74 Years | 4 (14.3%) | 0 (0.0%) |
| 75 Years and over | 3 (7.9%) | 0 (0.0%) |
| Total | 284 (40.9%) | 0 (0.0%) |
Employment Status by Educational Attainment in Hoffman
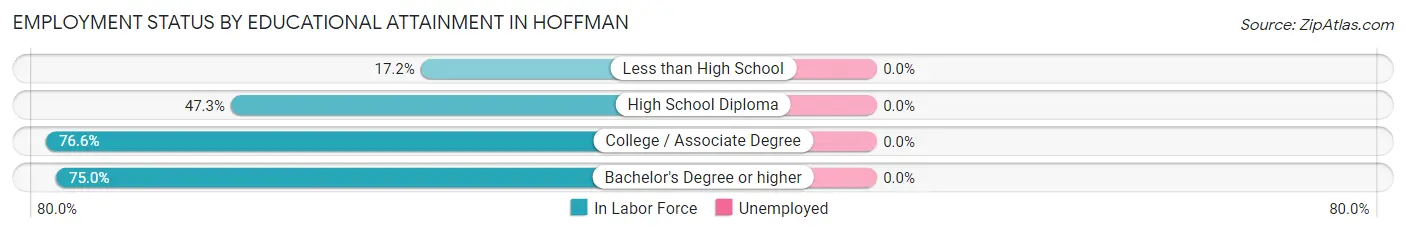
| Educational Attainment | In Labor Force | Unemployed |
| Less than High School | 27 (17.2%) | 0 (0.0%) |
| High School Diploma | 70 (47.3%) | 0 (0.0%) |
| College / Associate Degree | 111 (76.6%) | 0 (0.0%) |
| Bachelor's Degree or higher | 6 (75.0%) | 0 (0.0%) |
| Total | 214 (46.7%) | 0 (0.0%) |
Employment Occupations by Sex in Hoffman
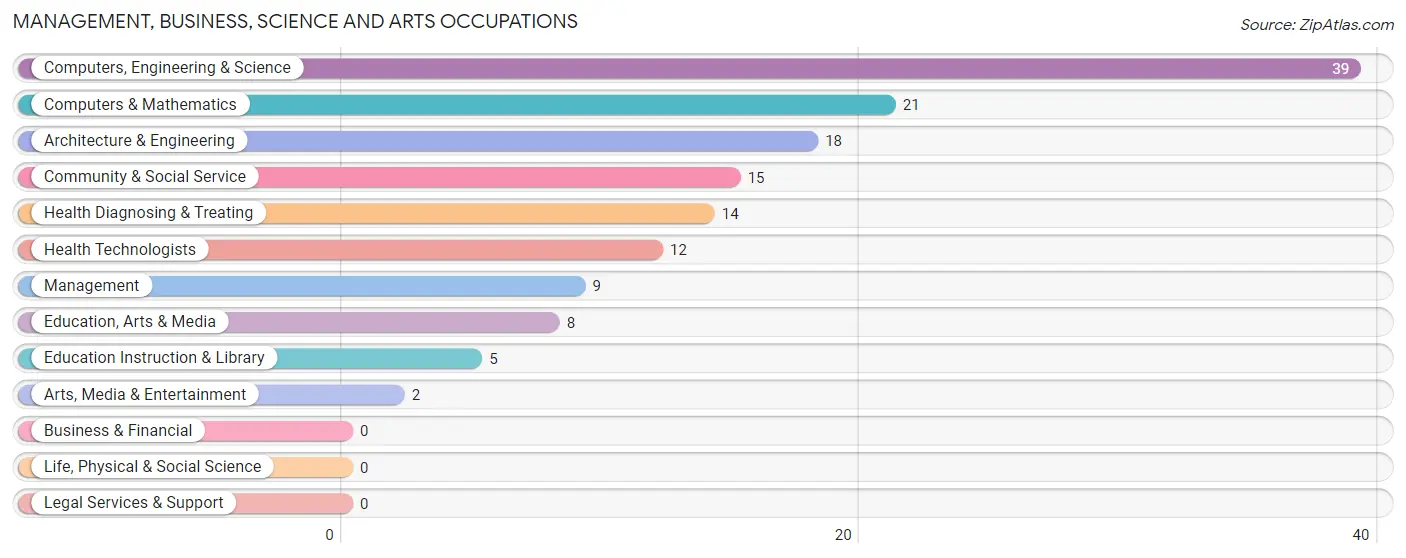
Management, Business, Science and Arts Occupations
The most common Management, Business, Science and Arts occupations in Hoffman are Computers, Engineering & Science (39 | 13.7%), Computers & Mathematics (21 | 7.4%), Architecture & Engineering (18 | 6.3%), Community & Social Service (15 | 5.3%), and Health Diagnosing & Treating (14 | 4.9%).
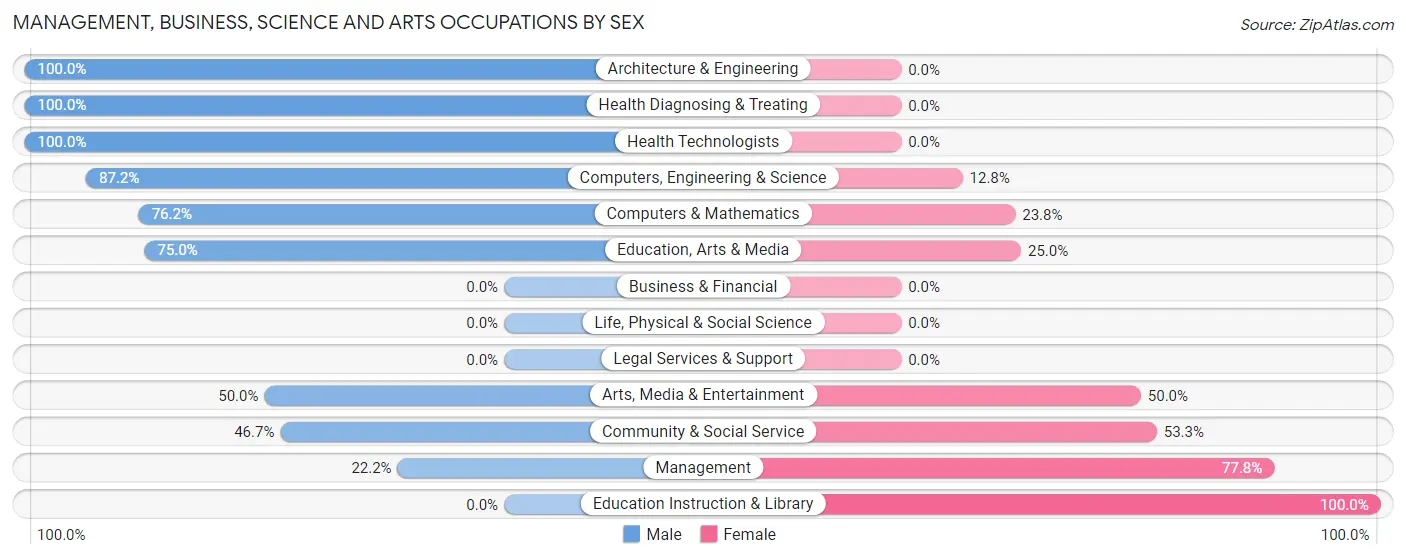
Management, Business, Science and Arts Occupations by Sex
Within the Management, Business, Science and Arts occupations in Hoffman, the most male-oriented occupations are Architecture & Engineering (100.0%), Health Diagnosing & Treating (100.0%), and Health Technologists (100.0%), while the most female-oriented occupations are Education Instruction & Library (100.0%), Management (77.8%), and Community & Social Service (53.3%).
| Occupation | Male | Female |
| Management | 2 (22.2%) | 7 (77.8%) |
| Business & Financial | 0 (0.0%) | 0 (0.0%) |
| Computers, Engineering & Science | 34 (87.2%) | 5 (12.8%) |
| Computers & Mathematics | 16 (76.2%) | 5 (23.8%) |
| Architecture & Engineering | 18 (100.0%) | 0 (0.0%) |
| Life, Physical & Social Science | 0 (0.0%) | 0 (0.0%) |
| Community & Social Service | 7 (46.7%) | 8 (53.3%) |
| Education, Arts & Media | 6 (75.0%) | 2 (25.0%) |
| Legal Services & Support | 0 (0.0%) | 0 (0.0%) |
| Education Instruction & Library | 0 (0.0%) | 5 (100.0%) |
| Arts, Media & Entertainment | 1 (50.0%) | 1 (50.0%) |
| Health Diagnosing & Treating | 14 (100.0%) | 0 (0.0%) |
| Health Technologists | 12 (100.0%) | 0 (0.0%) |
| Total (Category) | 57 (74.0%) | 20 (26.0%) |
| Total (Overall) | 183 (64.4%) | 101 (35.6%) |
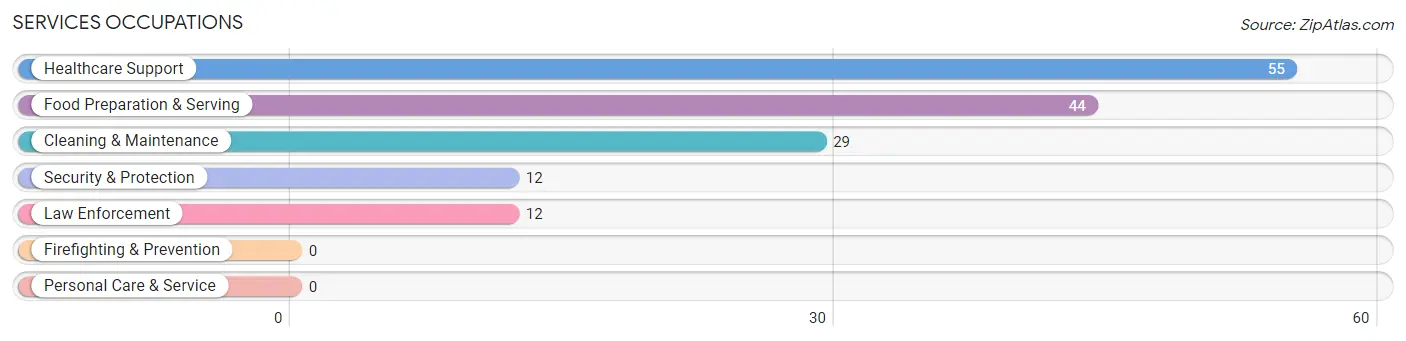
Services Occupations
The most common Services occupations in Hoffman are Healthcare Support (55 | 19.4%), Food Preparation & Serving (44 | 15.5%), Cleaning & Maintenance (29 | 10.2%), Security & Protection (12 | 4.2%), and Law Enforcement (12 | 4.2%).
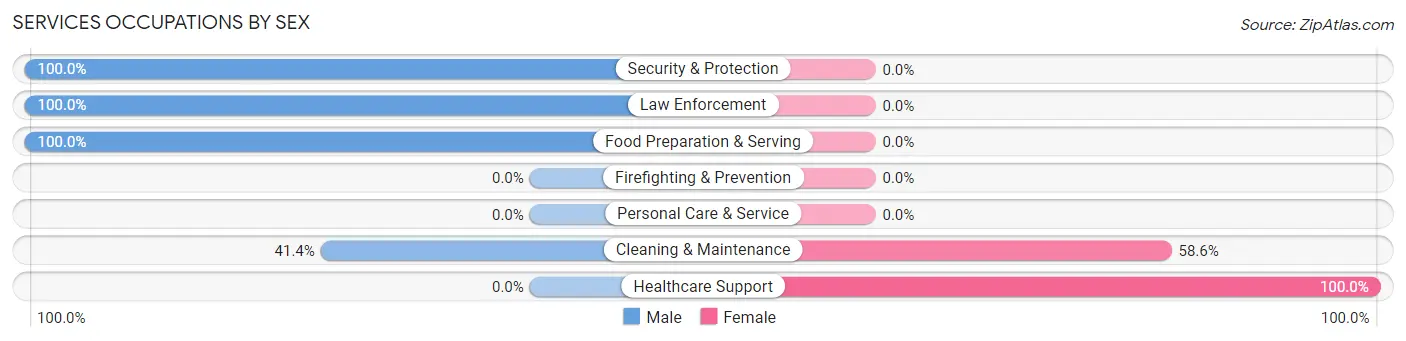
Services Occupations by Sex
Within the Services occupations in Hoffman, the most male-oriented occupations are Security & Protection (100.0%), Law Enforcement (100.0%), and Food Preparation & Serving (100.0%), while the most female-oriented occupations are Healthcare Support (100.0%), and Cleaning & Maintenance (58.6%).
| Occupation | Male | Female |
| Healthcare Support | 0 (0.0%) | 55 (100.0%) |
| Security & Protection | 12 (100.0%) | 0 (0.0%) |
| Firefighting & Prevention | 0 (0.0%) | 0 (0.0%) |
| Law Enforcement | 12 (100.0%) | 0 (0.0%) |
| Food Preparation & Serving | 44 (100.0%) | 0 (0.0%) |
| Cleaning & Maintenance | 12 (41.4%) | 17 (58.6%) |
| Personal Care & Service | 0 (0.0%) | 0 (0.0%) |
| Total (Category) | 68 (48.6%) | 72 (51.4%) |
| Total (Overall) | 183 (64.4%) | 101 (35.6%) |
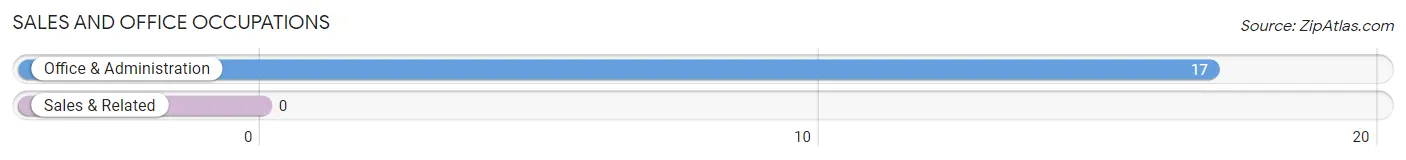
Sales and Office Occupations
The most common Sales and Office occupations in Hoffman are , and Office & Administration (17 | 6.0%).
Sales and Office Occupations by Sex
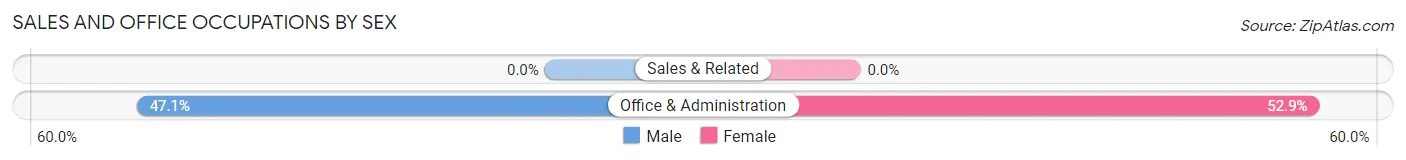
| Occupation | Male | Female |
| Sales & Related | 0 (0.0%) | 0 (0.0%) |
| Office & Administration | 8 (47.1%) | 9 (52.9%) |
| Total (Category) | 8 (47.1%) | 9 (52.9%) |
| Total (Overall) | 183 (64.4%) | 101 (35.6%) |
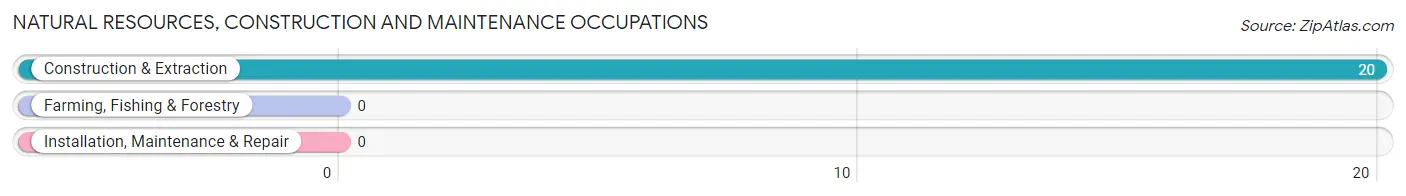
Natural Resources, Construction and Maintenance Occupations
The most common Natural Resources, Construction and Maintenance occupations in Hoffman are , and Construction & Extraction (20 | 7.0%).
Natural Resources, Construction and Maintenance Occupations by Sex
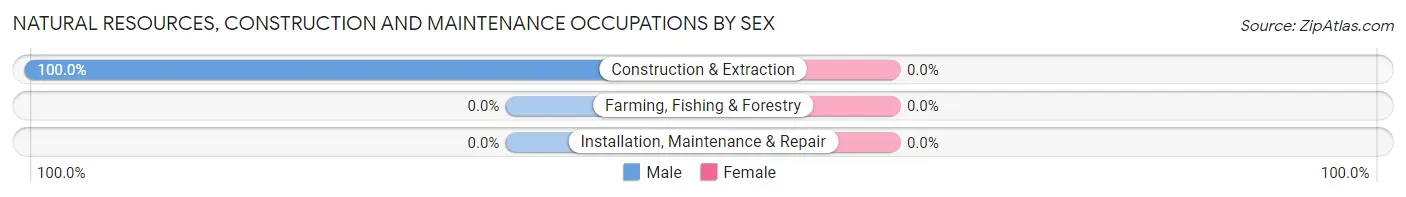
| Occupation | Male | Female |
| Farming, Fishing & Forestry | 0 (0.0%) | 0 (0.0%) |
| Construction & Extraction | 20 (100.0%) | 0 (0.0%) |
| Installation, Maintenance & Repair | 0 (0.0%) | 0 (0.0%) |
| Total (Category) | 20 (100.0%) | 0 (0.0%) |
| Total (Overall) | 183 (64.4%) | 101 (35.6%) |
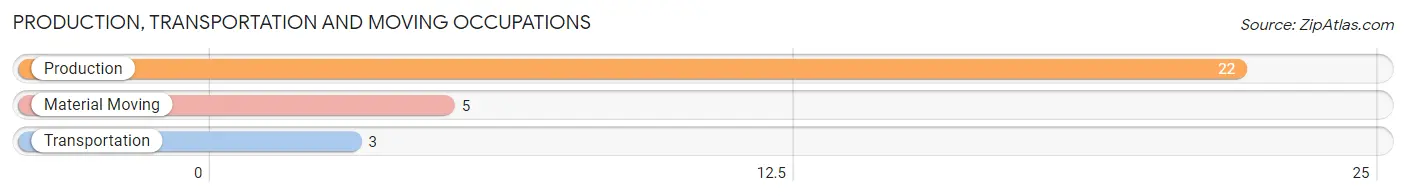
Production, Transportation and Moving Occupations
The most common Production, Transportation and Moving occupations in Hoffman are Production (22 | 7.7%), Material Moving (5 | 1.8%), and Transportation (3 | 1.1%).
Production, Transportation and Moving Occupations by Sex
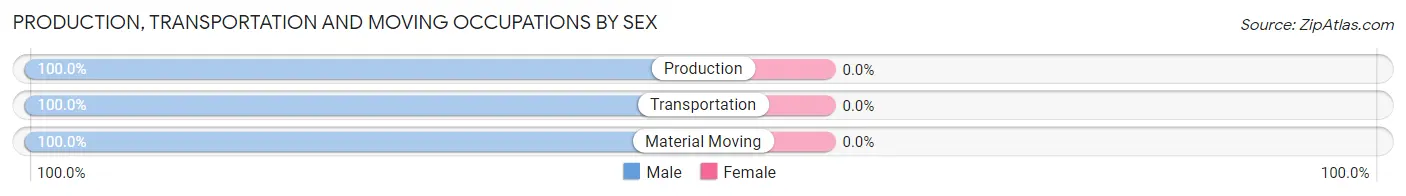
| Occupation | Male | Female |
| Production | 22 (100.0%) | 0 (0.0%) |
| Transportation | 3 (100.0%) | 0 (0.0%) |
| Material Moving | 5 (100.0%) | 0 (0.0%) |
| Total (Category) | 30 (100.0%) | 0 (0.0%) |
| Total (Overall) | 183 (64.4%) | 101 (35.6%) |
Employment Industries by Sex in Hoffman
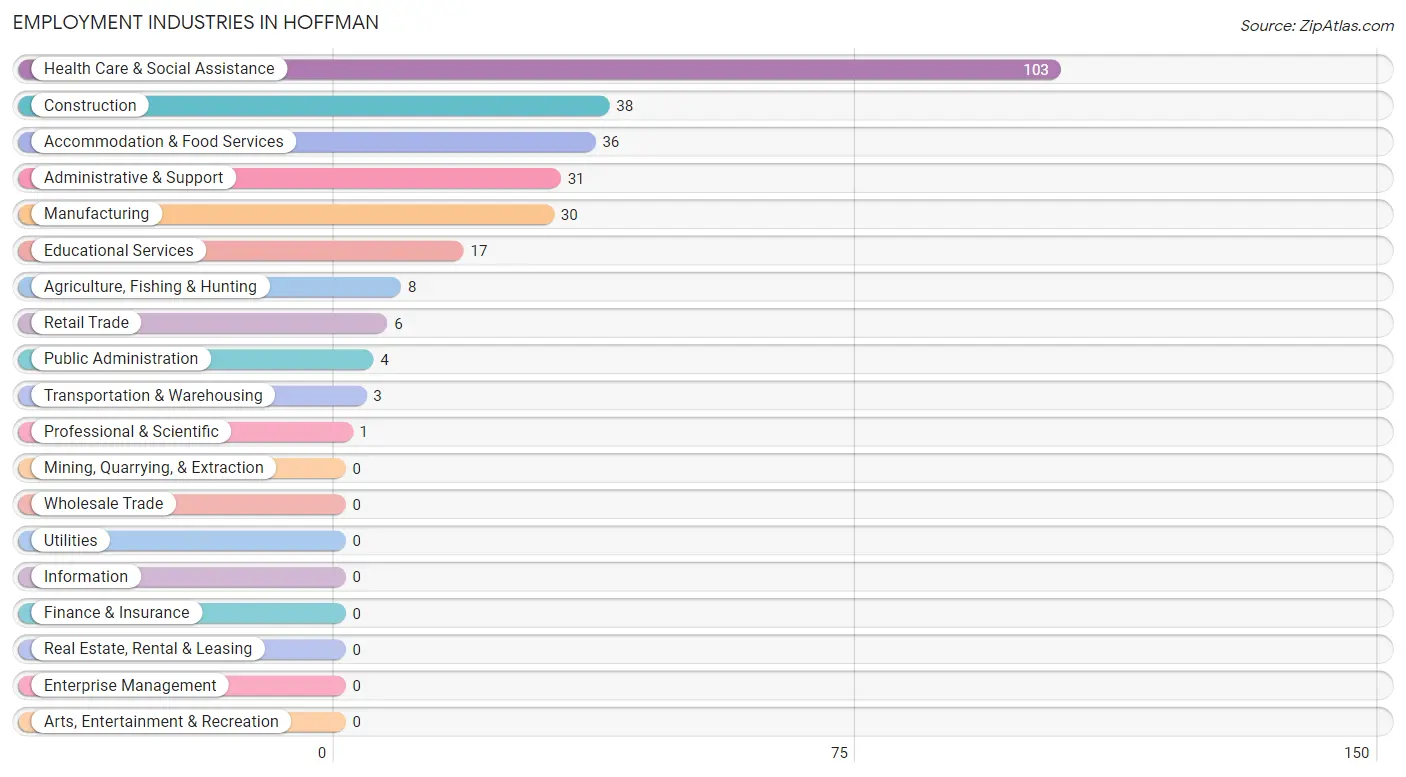
Employment Industries in Hoffman
The major employment industries in Hoffman include Health Care & Social Assistance (103 | 36.3%), Construction (38 | 13.4%), Accommodation & Food Services (36 | 12.7%), Administrative & Support (31 | 10.9%), and Manufacturing (30 | 10.6%).
Employment Industries by Sex in Hoffman
The Hoffman industries that see more men than women are Agriculture, Fishing & Hunting (100.0%), Construction (100.0%), and Transportation & Warehousing (100.0%), whereas the industries that tend to have a higher number of women are Retail Trade (100.0%), Professional & Scientific (100.0%), and Health Care & Social Assistance (58.3%).
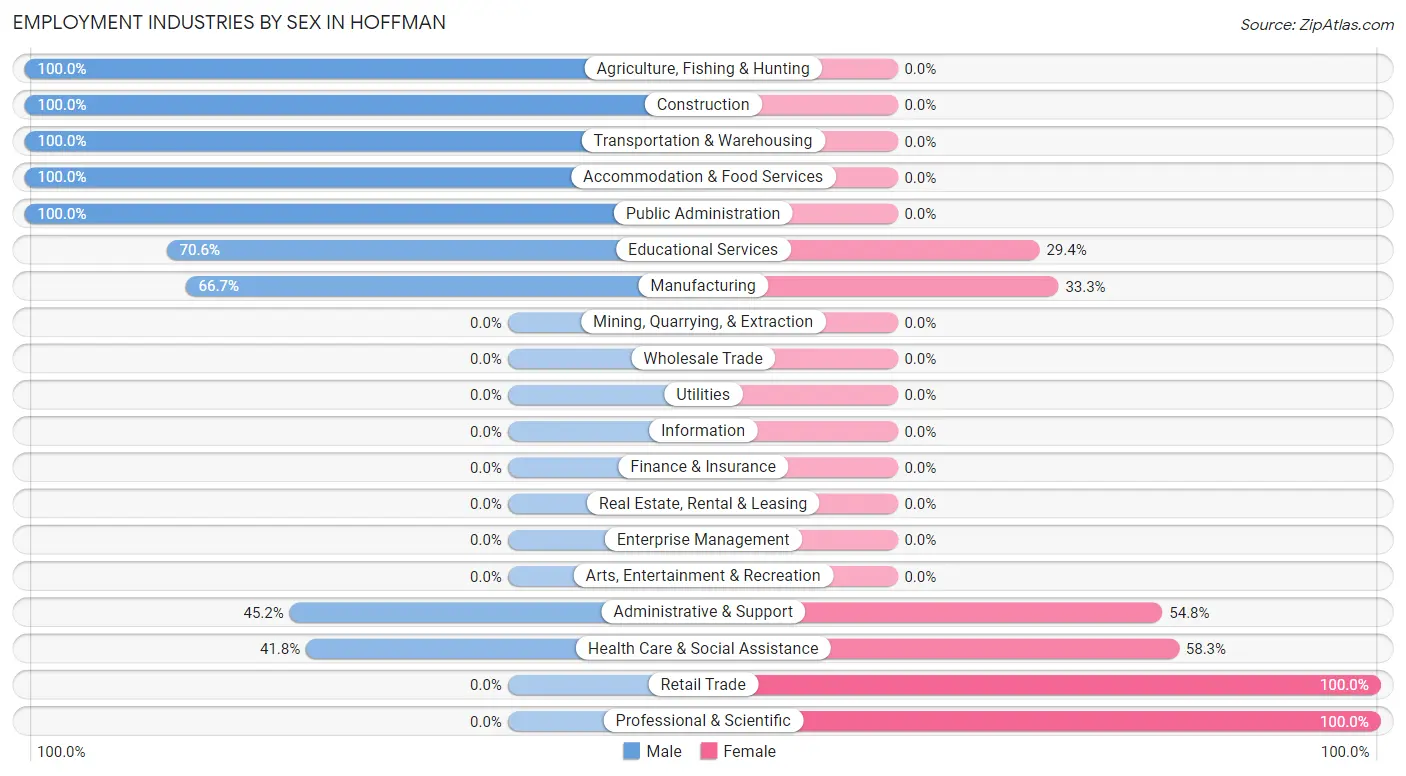
| Industry | Male | Female |
| Agriculture, Fishing & Hunting | 8 (100.0%) | 0 (0.0%) |
| Mining, Quarrying, & Extraction | 0 (0.0%) | 0 (0.0%) |
| Construction | 38 (100.0%) | 0 (0.0%) |
| Manufacturing | 20 (66.7%) | 10 (33.3%) |
| Wholesale Trade | 0 (0.0%) | 0 (0.0%) |
| Retail Trade | 0 (0.0%) | 6 (100.0%) |
| Transportation & Warehousing | 3 (100.0%) | 0 (0.0%) |
| Utilities | 0 (0.0%) | 0 (0.0%) |
| Information | 0 (0.0%) | 0 (0.0%) |
| Finance & Insurance | 0 (0.0%) | 0 (0.0%) |
| Real Estate, Rental & Leasing | 0 (0.0%) | 0 (0.0%) |
| Professional & Scientific | 0 (0.0%) | 1 (100.0%) |
| Enterprise Management | 0 (0.0%) | 0 (0.0%) |
| Administrative & Support | 14 (45.2%) | 17 (54.8%) |
| Educational Services | 12 (70.6%) | 5 (29.4%) |
| Health Care & Social Assistance | 43 (41.7%) | 60 (58.3%) |
| Arts, Entertainment & Recreation | 0 (0.0%) | 0 (0.0%) |
| Accommodation & Food Services | 36 (100.0%) | 0 (0.0%) |
| Public Administration | 4 (100.0%) | 0 (0.0%) |
| Total | 183 (64.4%) | 101 (35.6%) |
Education in Hoffman
School Enrollment in Hoffman
The most common levels of schooling among the 167 students in Hoffman are high school (107 | 64.1%), middle school (32 | 19.2%), and elementary school (13 | 7.8%).
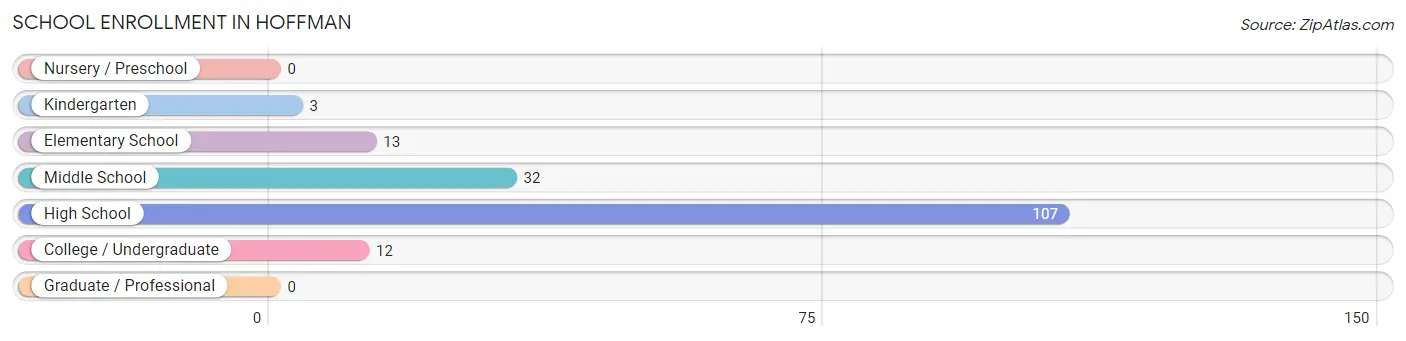
| School Level | # Students | % Students |
| Nursery / Preschool | 0 | 0.0% |
| Kindergarten | 3 | 1.8% |
| Elementary School | 13 | 7.8% |
| Middle School | 32 | 19.2% |
| High School | 107 | 64.1% |
| College / Undergraduate | 12 | 7.2% |
| Graduate / Professional | 0 | 0.0% |
| Total | 167 | 100.0% |
School Enrollment by Age by Funding Source in Hoffman
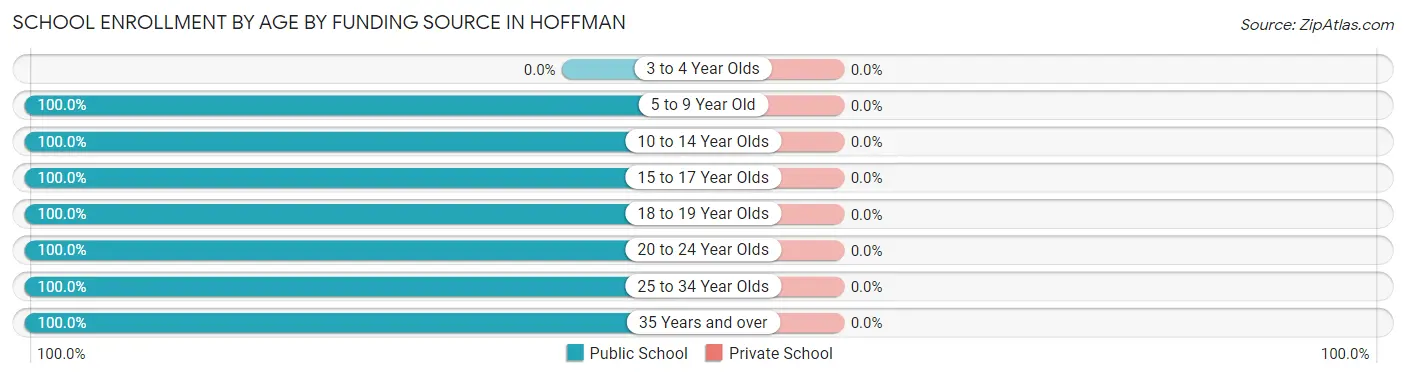
| Age Bracket | Public School | Private School |
| 3 to 4 Year Olds | 0 (0.0%) | 0 (0.0%) |
| 5 to 9 Year Old | 16 (100.0%) | 0 (0.0%) |
| 10 to 14 Year Olds | 48 (100.0%) | 0 (0.0%) |
| 15 to 17 Year Olds | 43 (100.0%) | 0 (0.0%) |
| 18 to 19 Year Olds | 22 (100.0%) | 0 (0.0%) |
| 20 to 24 Year Olds | 26 (100.0%) | 0 (0.0%) |
| 25 to 34 Year Olds | 2 (100.0%) | 0 (0.0%) |
| 35 Years and over | 10 (100.0%) | 0 (0.0%) |
| Total | 167 (100.0%) | 0 (0.0%) |
Educational Attainment by Field of Study in Hoffman
Education (8 | 36.4%), science & technology (6 | 27.3%), bio, nature & agricultural (4 | 18.2%), social sciences (3 | 13.6%), and visual & performing arts (1 | 4.5%) are the most common fields of study among 22 individuals in Hoffman who have obtained a bachelor's degree or higher.
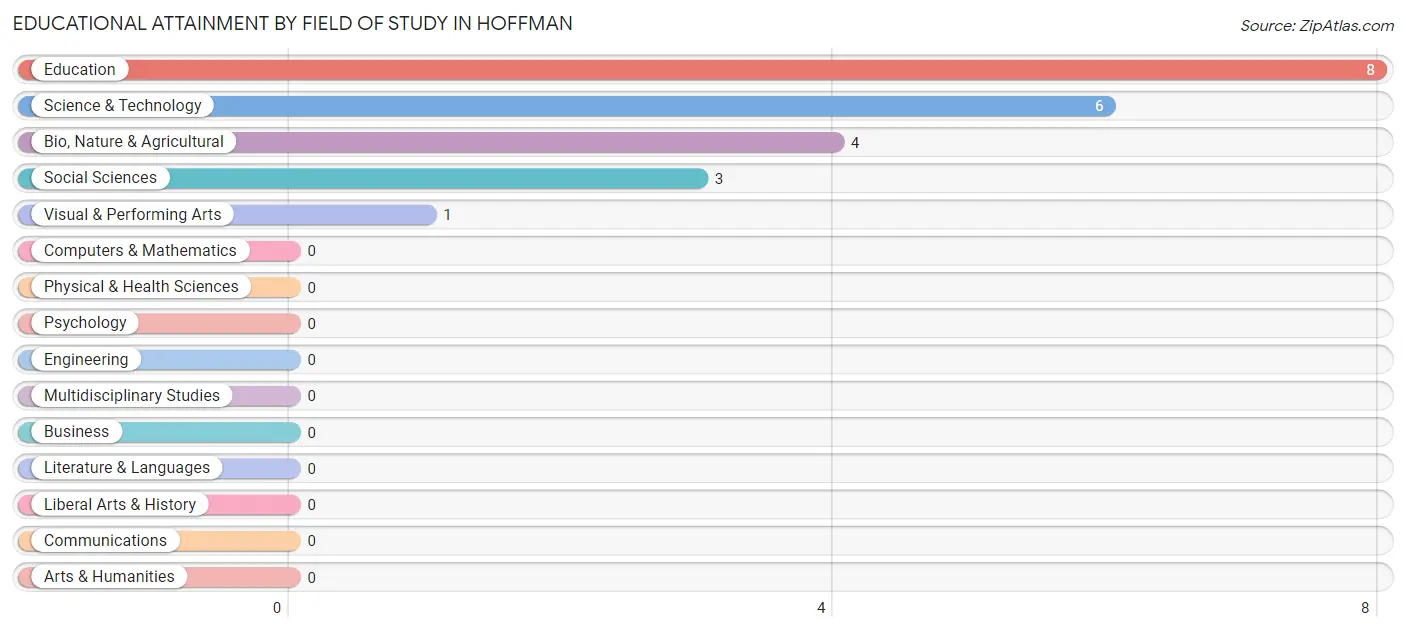
| Field of Study | # Graduates | % Graduates |
| Computers & Mathematics | 0 | 0.0% |
| Bio, Nature & Agricultural | 4 | 18.2% |
| Physical & Health Sciences | 0 | 0.0% |
| Psychology | 0 | 0.0% |
| Social Sciences | 3 | 13.6% |
| Engineering | 0 | 0.0% |
| Multidisciplinary Studies | 0 | 0.0% |
| Science & Technology | 6 | 27.3% |
| Business | 0 | 0.0% |
| Education | 8 | 36.4% |
| Literature & Languages | 0 | 0.0% |
| Liberal Arts & History | 0 | 0.0% |
| Visual & Performing Arts | 1 | 4.5% |
| Communications | 0 | 0.0% |
| Arts & Humanities | 0 | 0.0% |
| Total | 22 | 100.0% |
Transportation & Commute in Hoffman
Vehicle Availability by Sex in Hoffman
The most prevalent vehicle ownership categories in Hoffman are males with 5 or more vehicles (86, accounting for 47.0%) and females with 5 or more vehicles (40, making up 85.2%).
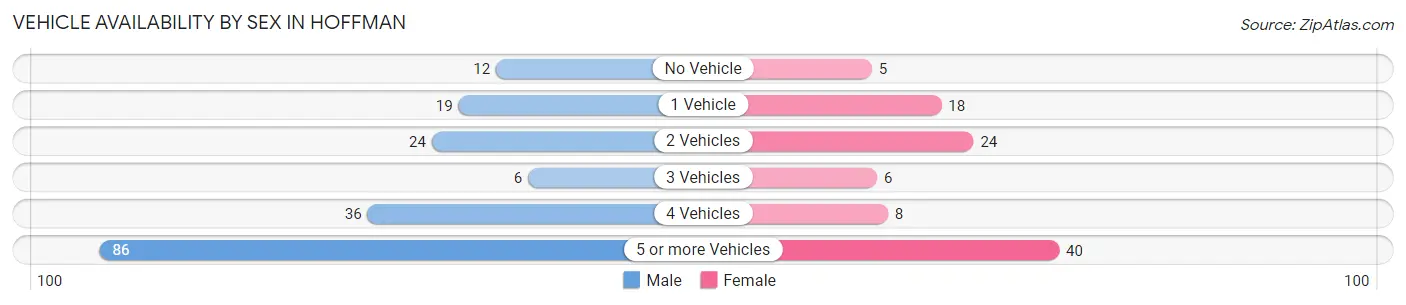
| Vehicles Available | Male | Female |
| No Vehicle | 12 (6.6%) | 5 (5.0%) |
| 1 Vehicle | 19 (10.4%) | 18 (17.8%) |
| 2 Vehicles | 24 (13.1%) | 24 (23.8%) |
| 3 Vehicles | 6 (3.3%) | 6 (5.9%) |
| 4 Vehicles | 36 (19.7%) | 8 (7.9%) |
| 5 or more Vehicles | 86 (47.0%) | 40 (39.6%) |
| Total | 183 (100.0%) | 101 (100.0%) |
Commute Time in Hoffman
The most frequently occuring commute durations in Hoffman are 30 to 34 minutes (72 commuters, 25.4%), 20 to 24 minutes (54 commuters, 19.0%), and 15 to 19 minutes (45 commuters, 15.9%).
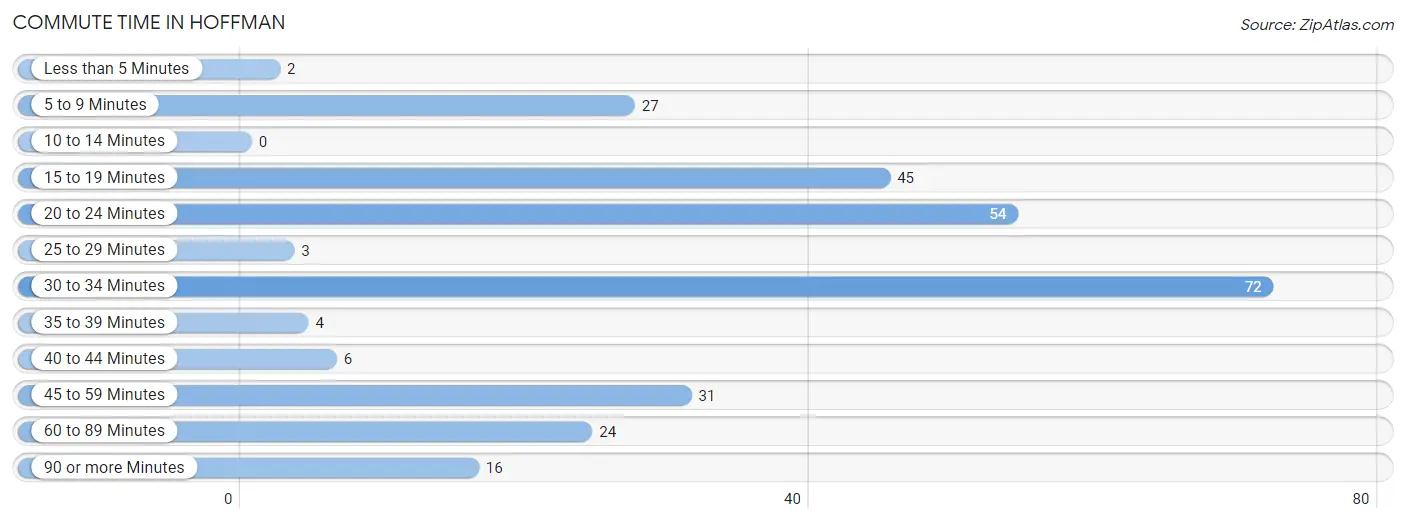
| Commute Time | # Commuters | % Commuters |
| Less than 5 Minutes | 2 | 0.7% |
| 5 to 9 Minutes | 27 | 9.5% |
| 10 to 14 Minutes | 0 | 0.0% |
| 15 to 19 Minutes | 45 | 15.9% |
| 20 to 24 Minutes | 54 | 19.0% |
| 25 to 29 Minutes | 3 | 1.1% |
| 30 to 34 Minutes | 72 | 25.4% |
| 35 to 39 Minutes | 4 | 1.4% |
| 40 to 44 Minutes | 6 | 2.1% |
| 45 to 59 Minutes | 31 | 10.9% |
| 60 to 89 Minutes | 24 | 8.5% |
| 90 or more Minutes | 16 | 5.6% |
Commute Time by Sex in Hoffman
The most common commute times in Hoffman are 15 to 19 minutes (36 commuters, 19.7%) for males and 30 to 34 minutes (53 commuters, 52.5%) for females.
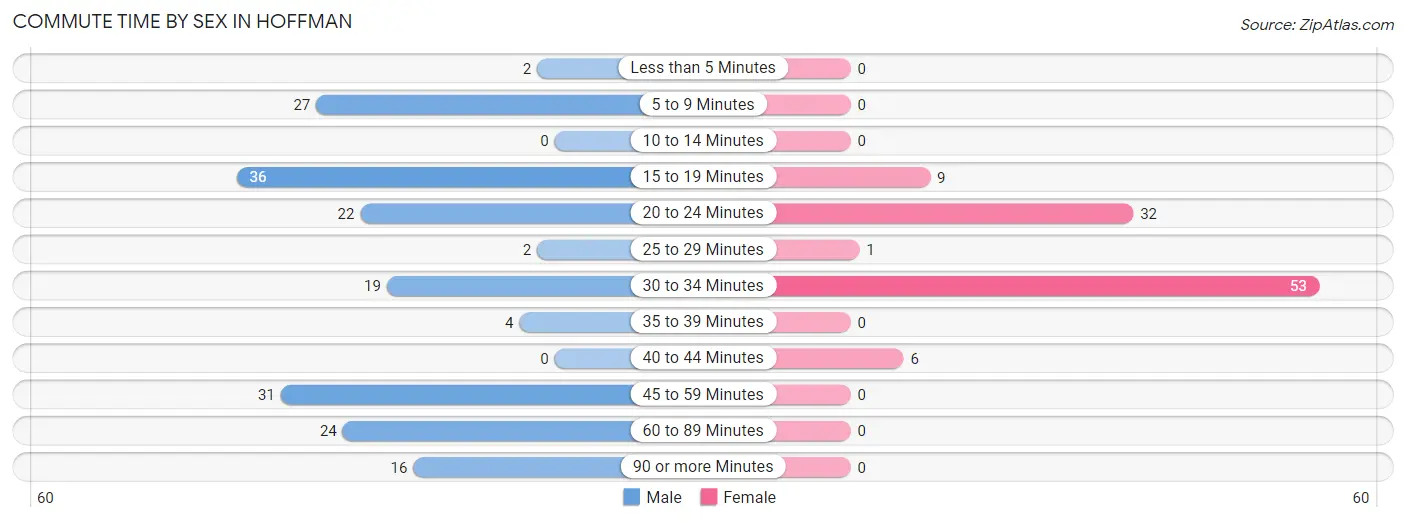
| Commute Time | Male | Female |
| Less than 5 Minutes | 2 (1.1%) | 0 (0.0%) |
| 5 to 9 Minutes | 27 (14.7%) | 0 (0.0%) |
| 10 to 14 Minutes | 0 (0.0%) | 0 (0.0%) |
| 15 to 19 Minutes | 36 (19.7%) | 9 (8.9%) |
| 20 to 24 Minutes | 22 (12.0%) | 32 (31.7%) |
| 25 to 29 Minutes | 2 (1.1%) | 1 (1.0%) |
| 30 to 34 Minutes | 19 (10.4%) | 53 (52.5%) |
| 35 to 39 Minutes | 4 (2.2%) | 0 (0.0%) |
| 40 to 44 Minutes | 0 (0.0%) | 6 (5.9%) |
| 45 to 59 Minutes | 31 (16.9%) | 0 (0.0%) |
| 60 to 89 Minutes | 24 (13.1%) | 0 (0.0%) |
| 90 or more Minutes | 16 (8.7%) | 0 (0.0%) |
Time of Departure to Work by Sex in Hoffman
The most frequent times of departure to work in Hoffman are 6:00 AM to 6:29 AM (47, 25.7%) for males and 5:30 AM to 5:59 AM (37, 36.6%) for females.
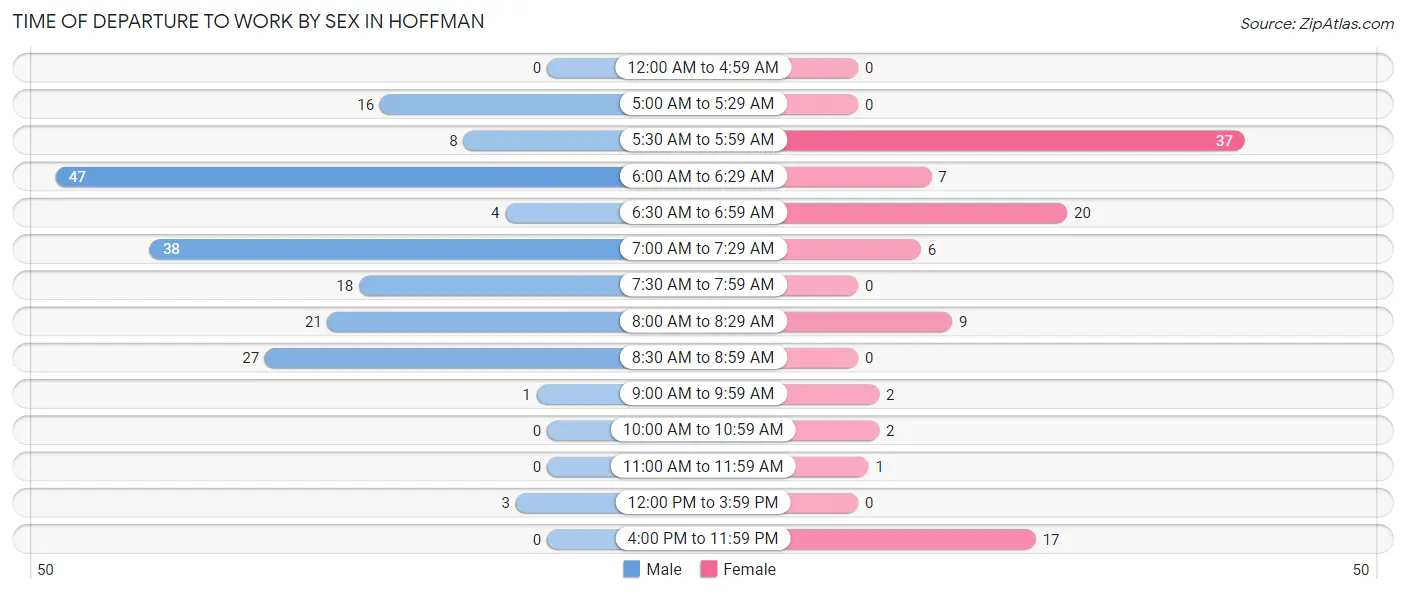
| Time of Departure | Male | Female |
| 12:00 AM to 4:59 AM | 0 (0.0%) | 0 (0.0%) |
| 5:00 AM to 5:29 AM | 16 (8.7%) | 0 (0.0%) |
| 5:30 AM to 5:59 AM | 8 (4.4%) | 37 (36.6%) |
| 6:00 AM to 6:29 AM | 47 (25.7%) | 7 (6.9%) |
| 6:30 AM to 6:59 AM | 4 (2.2%) | 20 (19.8%) |
| 7:00 AM to 7:29 AM | 38 (20.8%) | 6 (5.9%) |
| 7:30 AM to 7:59 AM | 18 (9.8%) | 0 (0.0%) |
| 8:00 AM to 8:29 AM | 21 (11.5%) | 9 (8.9%) |
| 8:30 AM to 8:59 AM | 27 (14.7%) | 0 (0.0%) |
| 9:00 AM to 9:59 AM | 1 (0.5%) | 2 (2.0%) |
| 10:00 AM to 10:59 AM | 0 (0.0%) | 2 (2.0%) |
| 11:00 AM to 11:59 AM | 0 (0.0%) | 1 (1.0%) |
| 12:00 PM to 3:59 PM | 3 (1.6%) | 0 (0.0%) |
| 4:00 PM to 11:59 PM | 0 (0.0%) | 17 (16.8%) |
| Total | 183 (100.0%) | 101 (100.0%) |
Housing Occupancy in Hoffman
Occupancy by Ownership in Hoffman
Of the total 201 dwellings in Hoffman, owner-occupied units account for 132 (65.7%), while renter-occupied units make up 69 (34.3%).
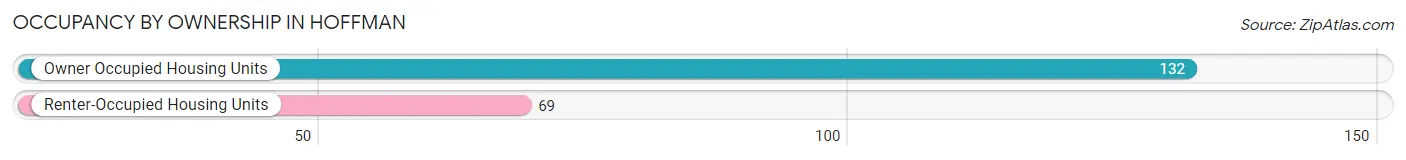
| Occupancy | # Housing Units | % Housing Units |
| Owner Occupied Housing Units | 132 | 65.7% |
| Renter-Occupied Housing Units | 69 | 34.3% |
| Total Occupied Housing Units | 201 | 100.0% |
Occupancy by Household Size in Hoffman
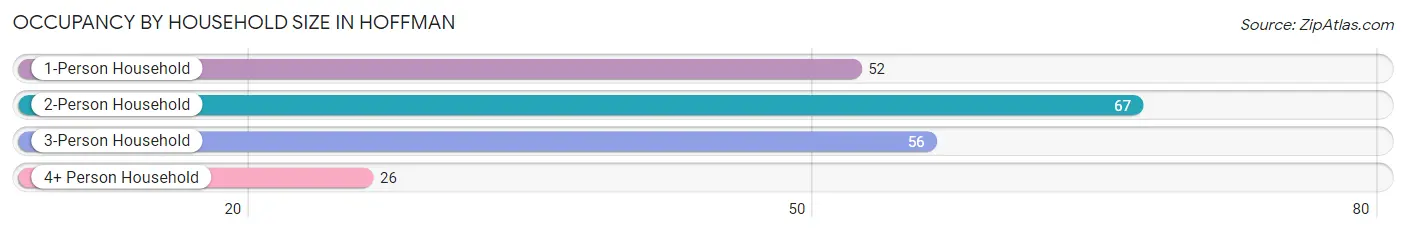
| Household Size | # Housing Units | % Housing Units |
| 1-Person Household | 52 | 25.9% |
| 2-Person Household | 67 | 33.3% |
| 3-Person Household | 56 | 27.9% |
| 4+ Person Household | 26 | 12.9% |
| Total Housing Units | 201 | 100.0% |
Occupancy by Ownership by Household Size in Hoffman
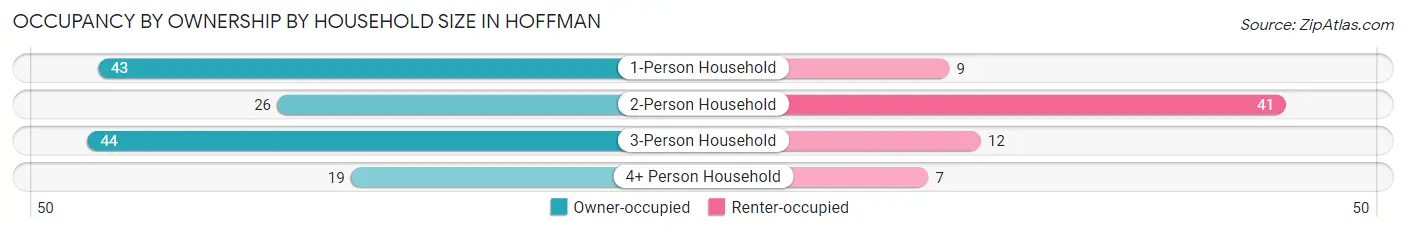
| Household Size | Owner-occupied | Renter-occupied |
| 1-Person Household | 43 (82.7%) | 9 (17.3%) |
| 2-Person Household | 26 (38.8%) | 41 (61.2%) |
| 3-Person Household | 44 (78.6%) | 12 (21.4%) |
| 4+ Person Household | 19 (73.1%) | 7 (26.9%) |
| Total Housing Units | 132 (65.7%) | 69 (34.3%) |
Occupancy by Educational Attainment in Hoffman
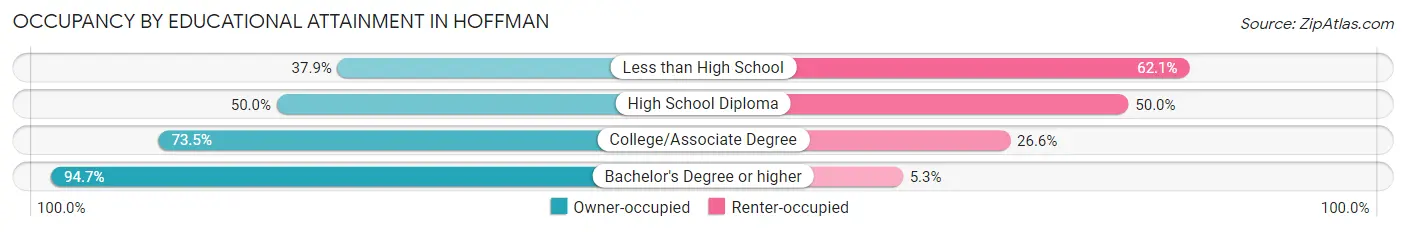
| Household Size | Owner-occupied | Renter-occupied |
| Less than High School | 11 (37.9%) | 18 (62.1%) |
| High School Diploma | 20 (50.0%) | 20 (50.0%) |
| College/Associate Degree | 83 (73.5%) | 30 (26.6%) |
| Bachelor's Degree or higher | 18 (94.7%) | 1 (5.3%) |
Occupancy by Age of Householder in Hoffman
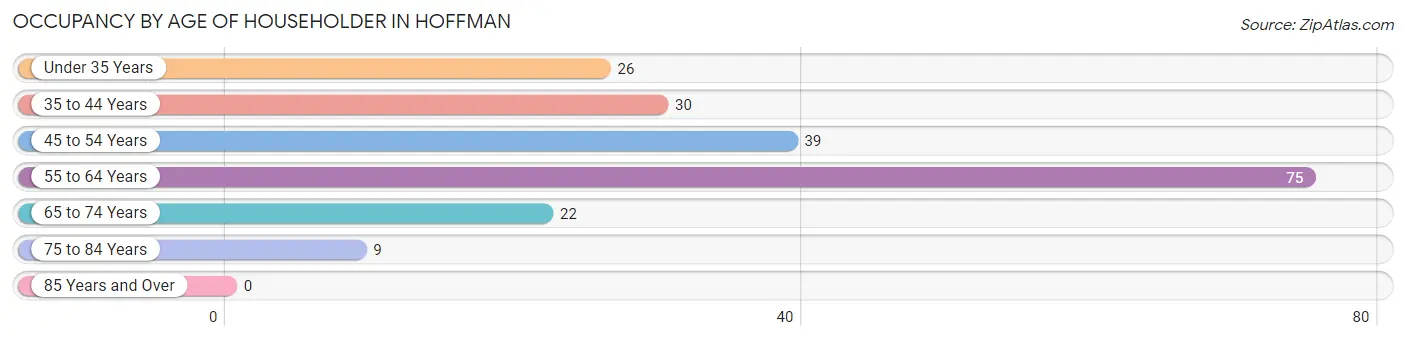
| Age Bracket | # Households | % Households |
| Under 35 Years | 26 | 12.9% |
| 35 to 44 Years | 30 | 14.9% |
| 45 to 54 Years | 39 | 19.4% |
| 55 to 64 Years | 75 | 37.3% |
| 65 to 74 Years | 22 | 11.0% |
| 75 to 84 Years | 9 | 4.5% |
| 85 Years and Over | 0 | 0.0% |
| Total | 201 | 100.0% |
Housing Finances in Hoffman
Median Income by Occupancy in Hoffman
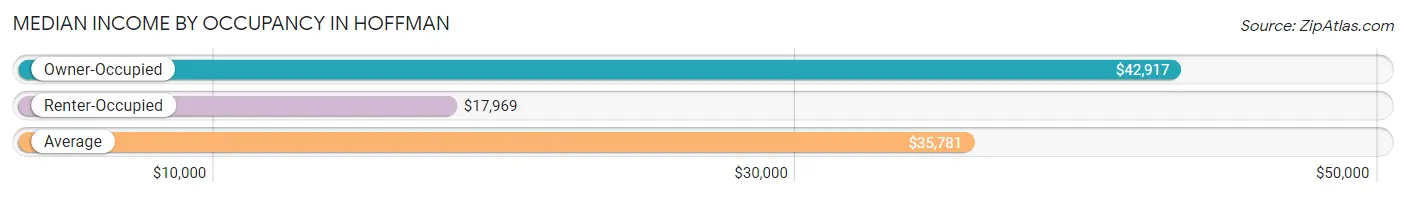
| Occupancy Type | # Households | Median Income |
| Owner-Occupied | 132 (65.7%) | $42,917 |
| Renter-Occupied | 69 (34.3%) | $17,969 |
| Average | 201 (100.0%) | $35,781 |
Occupancy by Householder Income Bracket in Hoffman
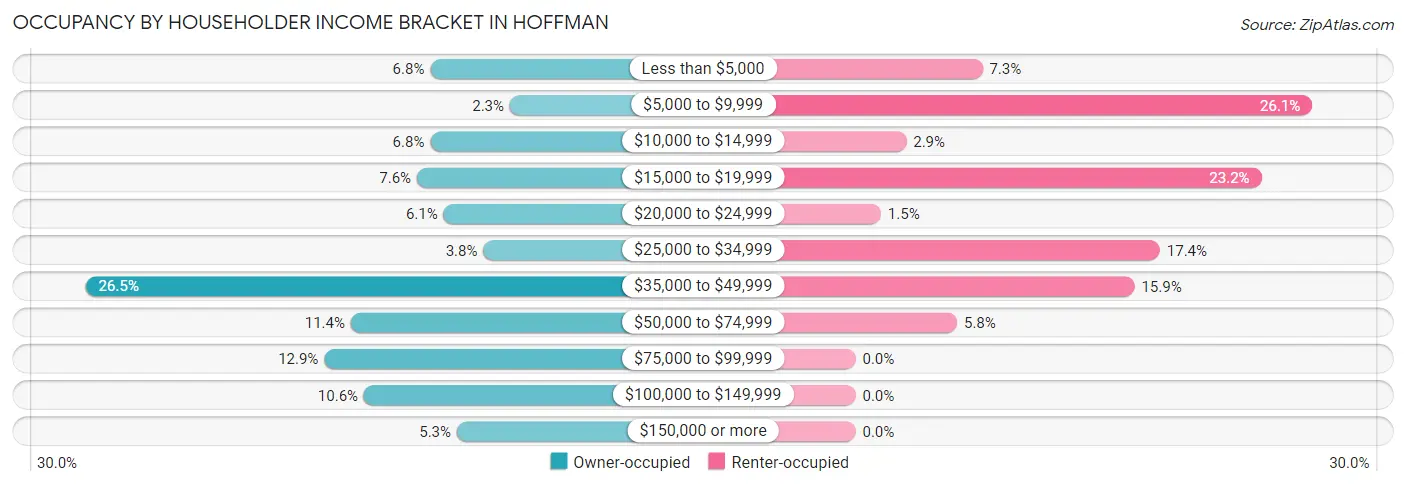
| Income Bracket | Owner-occupied | Renter-occupied |
| Less than $5,000 | 9 (6.8%) | 5 (7.2%) |
| $5,000 to $9,999 | 3 (2.3%) | 18 (26.1%) |
| $10,000 to $14,999 | 9 (6.8%) | 2 (2.9%) |
| $15,000 to $19,999 | 10 (7.6%) | 16 (23.2%) |
| $20,000 to $24,999 | 8 (6.1%) | 1 (1.5%) |
| $25,000 to $34,999 | 5 (3.8%) | 12 (17.4%) |
| $35,000 to $49,999 | 35 (26.5%) | 11 (15.9%) |
| $50,000 to $74,999 | 15 (11.4%) | 4 (5.8%) |
| $75,000 to $99,999 | 17 (12.9%) | 0 (0.0%) |
| $100,000 to $149,999 | 14 (10.6%) | 0 (0.0%) |
| $150,000 or more | 7 (5.3%) | 0 (0.0%) |
| Total | 132 (100.0%) | 69 (100.0%) |
Monthly Housing Cost Tiers in Hoffman
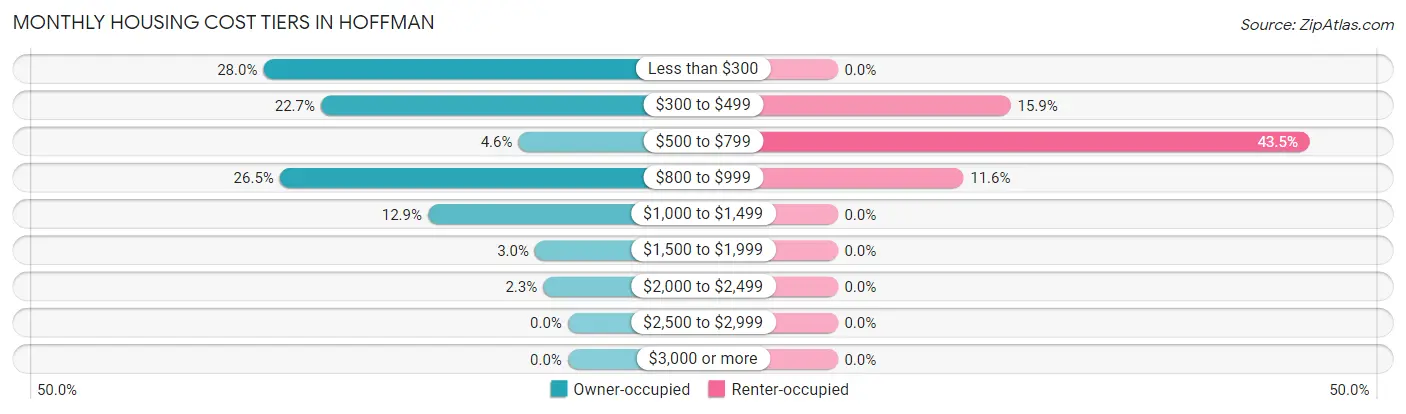
| Monthly Cost | Owner-occupied | Renter-occupied |
| Less than $300 | 37 (28.0%) | 0 (0.0%) |
| $300 to $499 | 30 (22.7%) | 11 (15.9%) |
| $500 to $799 | 6 (4.5%) | 30 (43.5%) |
| $800 to $999 | 35 (26.5%) | 8 (11.6%) |
| $1,000 to $1,499 | 17 (12.9%) | 0 (0.0%) |
| $1,500 to $1,999 | 4 (3.0%) | 0 (0.0%) |
| $2,000 to $2,499 | 3 (2.3%) | 0 (0.0%) |
| $2,500 to $2,999 | 0 (0.0%) | 0 (0.0%) |
| $3,000 or more | 0 (0.0%) | 0 (0.0%) |
| Total | 132 (100.0%) | 69 (100.0%) |
Physical Housing Characteristics in Hoffman
Housing Structures in Hoffman
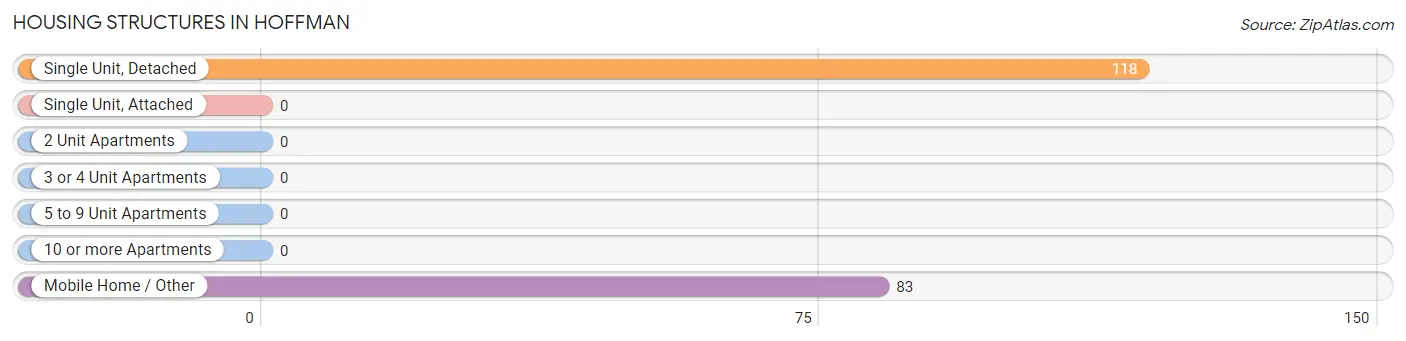
| Structure Type | # Housing Units | % Housing Units |
| Single Unit, Detached | 118 | 58.7% |
| Single Unit, Attached | 0 | 0.0% |
| 2 Unit Apartments | 0 | 0.0% |
| 3 or 4 Unit Apartments | 0 | 0.0% |
| 5 to 9 Unit Apartments | 0 | 0.0% |
| 10 or more Apartments | 0 | 0.0% |
| Mobile Home / Other | 83 | 41.3% |
| Total | 201 | 100.0% |
Housing Structures by Occupancy in Hoffman
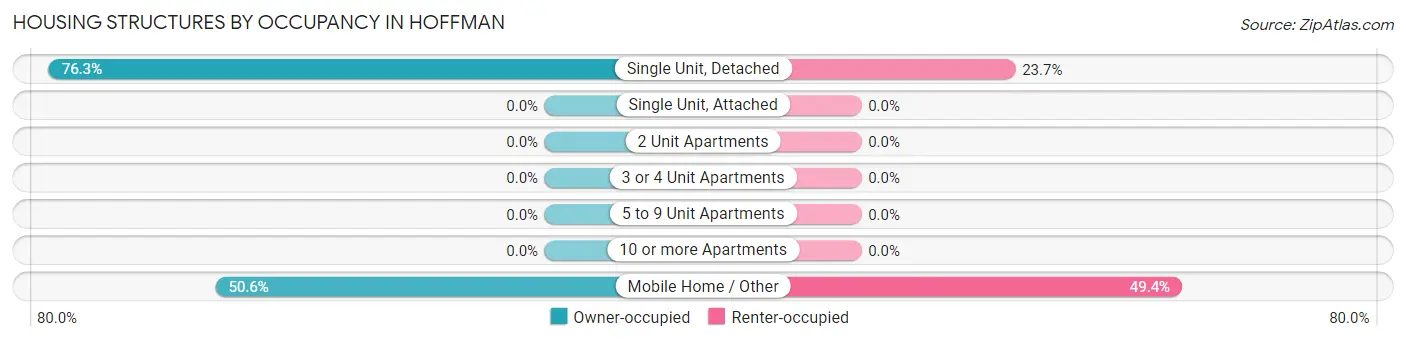
| Structure Type | Owner-occupied | Renter-occupied |
| Single Unit, Detached | 90 (76.3%) | 28 (23.7%) |
| Single Unit, Attached | 0 (0.0%) | 0 (0.0%) |
| 2 Unit Apartments | 0 (0.0%) | 0 (0.0%) |
| 3 or 4 Unit Apartments | 0 (0.0%) | 0 (0.0%) |
| 5 to 9 Unit Apartments | 0 (0.0%) | 0 (0.0%) |
| 10 or more Apartments | 0 (0.0%) | 0 (0.0%) |
| Mobile Home / Other | 42 (50.6%) | 41 (49.4%) |
| Total | 132 (65.7%) | 69 (34.3%) |
Housing Structures by Number of Rooms in Hoffman
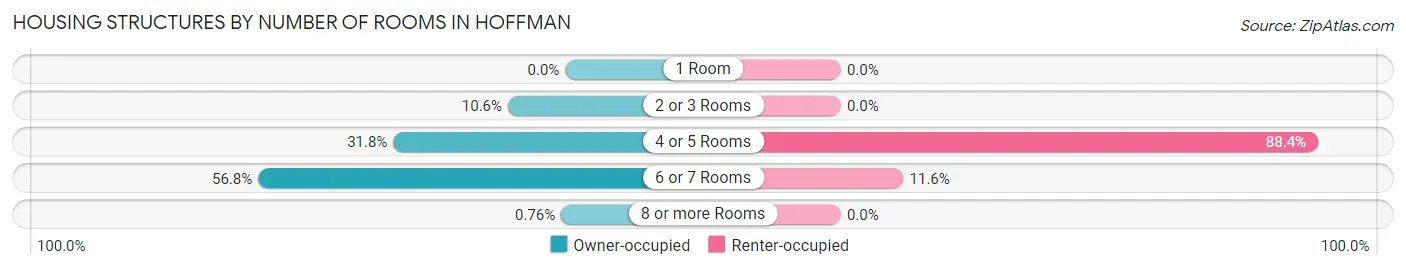
| Number of Rooms | Owner-occupied | Renter-occupied |
| 1 Room | 0 (0.0%) | 0 (0.0%) |
| 2 or 3 Rooms | 14 (10.6%) | 0 (0.0%) |
| 4 or 5 Rooms | 42 (31.8%) | 61 (88.4%) |
| 6 or 7 Rooms | 75 (56.8%) | 8 (11.6%) |
| 8 or more Rooms | 1 (0.8%) | 0 (0.0%) |
| Total | 132 (100.0%) | 69 (100.0%) |
Housing Structure by Heating Type in Hoffman
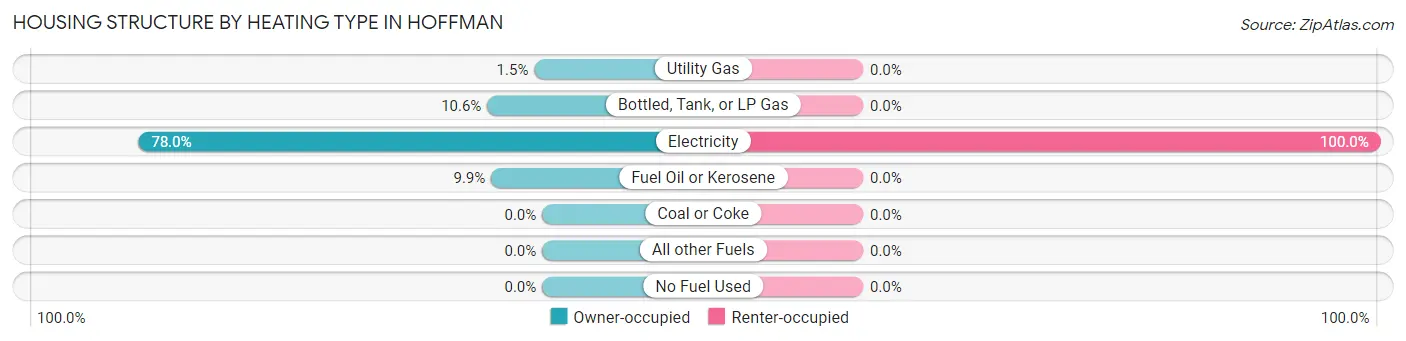
| Heating Type | Owner-occupied | Renter-occupied |
| Utility Gas | 2 (1.5%) | 0 (0.0%) |
| Bottled, Tank, or LP Gas | 14 (10.6%) | 0 (0.0%) |
| Electricity | 103 (78.0%) | 69 (100.0%) |
| Fuel Oil or Kerosene | 13 (9.9%) | 0 (0.0%) |
| Coal or Coke | 0 (0.0%) | 0 (0.0%) |
| All other Fuels | 0 (0.0%) | 0 (0.0%) |
| No Fuel Used | 0 (0.0%) | 0 (0.0%) |
| Total | 132 (100.0%) | 69 (100.0%) |
Household Vehicle Usage in Hoffman
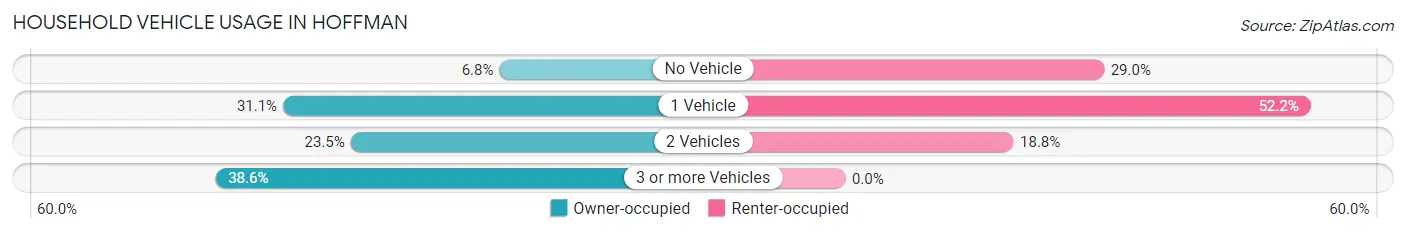
| Vehicles per Household | Owner-occupied | Renter-occupied |
| No Vehicle | 9 (6.8%) | 20 (29.0%) |
| 1 Vehicle | 41 (31.1%) | 36 (52.2%) |
| 2 Vehicles | 31 (23.5%) | 13 (18.8%) |
| 3 or more Vehicles | 51 (38.6%) | 0 (0.0%) |
| Total | 132 (100.0%) | 69 (100.0%) |
Real Estate & Mortgages in Hoffman
Real Estate and Mortgage Overview in Hoffman
| Characteristic | Without Mortgage | With Mortgage |
| Housing Units | 76 | 56 |
| Median Property Value | $52,200 | $65,000 |
| Median Household Income | $24,167 | $7 |
| Monthly Housing Costs | $308 | $0 |
| Real Estate Taxes | $540 | $8 |
Property Value by Mortgage Status in Hoffman
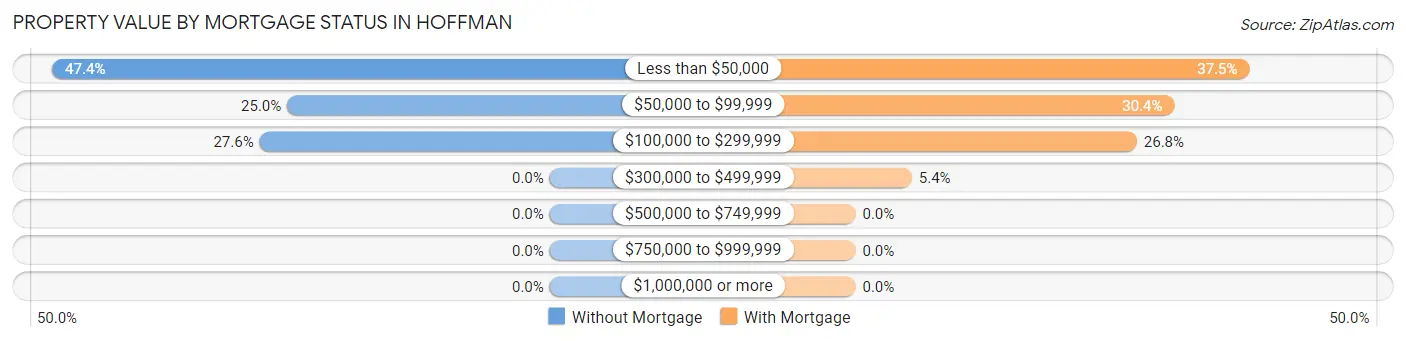
| Property Value | Without Mortgage | With Mortgage |
| Less than $50,000 | 36 (47.4%) | 21 (37.5%) |
| $50,000 to $99,999 | 19 (25.0%) | 17 (30.4%) |
| $100,000 to $299,999 | 21 (27.6%) | 15 (26.8%) |
| $300,000 to $499,999 | 0 (0.0%) | 3 (5.4%) |
| $500,000 to $749,999 | 0 (0.0%) | 0 (0.0%) |
| $750,000 to $999,999 | 0 (0.0%) | 0 (0.0%) |
| $1,000,000 or more | 0 (0.0%) | 0 (0.0%) |
| Total | 76 (100.0%) | 56 (100.0%) |
Household Income by Mortgage Status in Hoffman
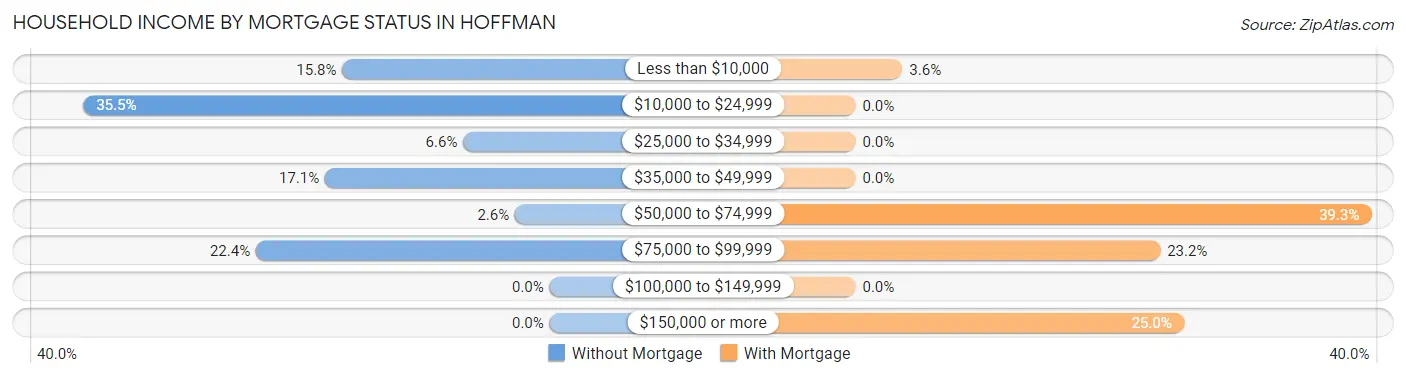
| Household Income | Without Mortgage | With Mortgage |
| Less than $10,000 | 12 (15.8%) | 2 (3.6%) |
| $10,000 to $24,999 | 27 (35.5%) | 0 (0.0%) |
| $25,000 to $34,999 | 5 (6.6%) | 0 (0.0%) |
| $35,000 to $49,999 | 13 (17.1%) | 0 (0.0%) |
| $50,000 to $74,999 | 2 (2.6%) | 22 (39.3%) |
| $75,000 to $99,999 | 17 (22.4%) | 13 (23.2%) |
| $100,000 to $149,999 | 0 (0.0%) | 0 (0.0%) |
| $150,000 or more | 0 (0.0%) | 14 (25.0%) |
| Total | 76 (100.0%) | 56 (100.0%) |
Property Value to Household Income Ratio in Hoffman
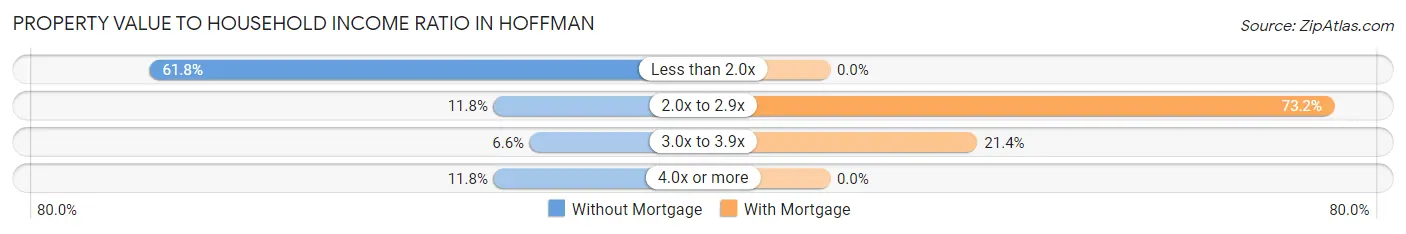
| Value-to-Income Ratio | Without Mortgage | With Mortgage |
| Less than 2.0x | 47 (61.8%) | 0 (0.0%) |
| 2.0x to 2.9x | 9 (11.8%) | 41 (73.2%) |
| 3.0x to 3.9x | 5 (6.6%) | 12 (21.4%) |
| 4.0x or more | 9 (11.8%) | 0 (0.0%) |
| Total | 76 (100.0%) | 56 (100.0%) |
Real Estate Taxes by Mortgage Status in Hoffman
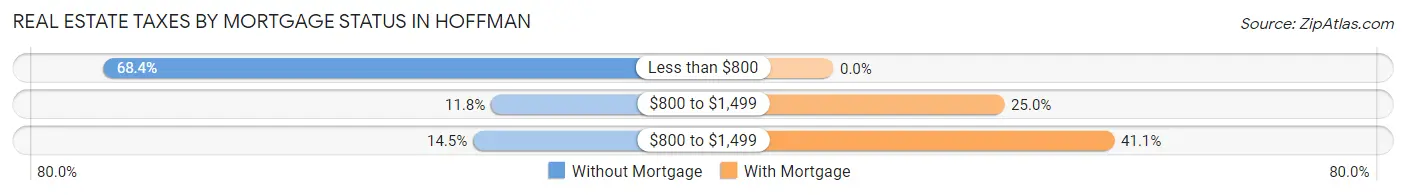
| Property Taxes | Without Mortgage | With Mortgage |
| Less than $800 | 52 (68.4%) | 0 (0.0%) |
| $800 to $1,499 | 9 (11.8%) | 14 (25.0%) |
| $800 to $1,499 | 11 (14.5%) | 23 (41.1%) |
| Total | 76 (100.0%) | 56 (100.0%) |
Health & Disability in Hoffman
Health Insurance Coverage by Age in Hoffman
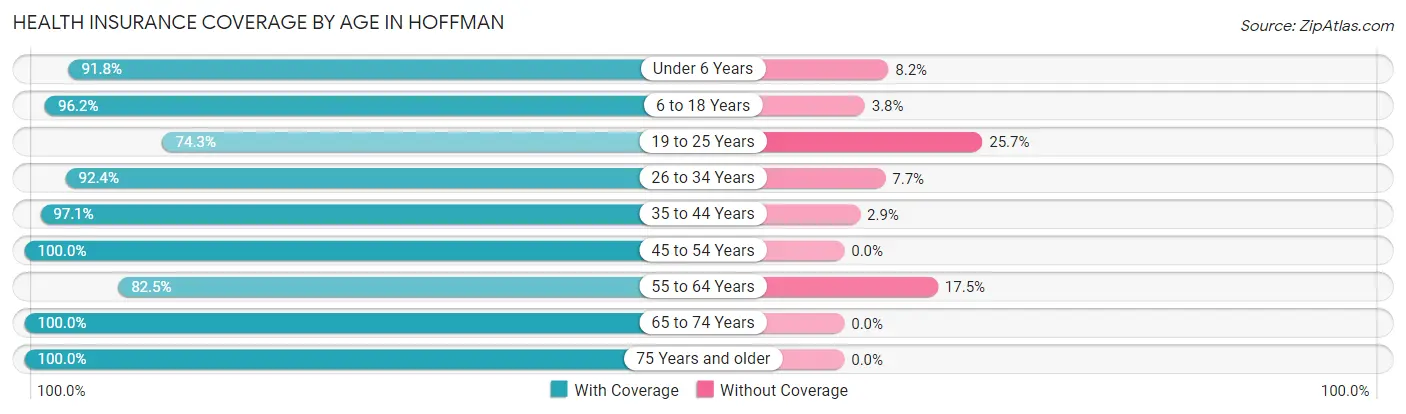
| Age Bracket | With Coverage | Without Coverage |
| Under 6 Years | 67 (91.8%) | 6 (8.2%) |
| 6 to 18 Years | 126 (96.2%) | 5 (3.8%) |
| 19 to 25 Years | 75 (74.3%) | 26 (25.7%) |
| 26 to 34 Years | 169 (92.3%) | 14 (7.6%) |
| 35 to 44 Years | 66 (97.1%) | 2 (2.9%) |
| 45 to 54 Years | 81 (100.0%) | 0 (0.0%) |
| 55 to 64 Years | 104 (82.5%) | 22 (17.5%) |
| 65 to 74 Years | 28 (100.0%) | 0 (0.0%) |
| 75 Years and older | 38 (100.0%) | 0 (0.0%) |
| Total | 754 (90.9%) | 75 (9.0%) |
Health Insurance Coverage by Citizenship Status in Hoffman
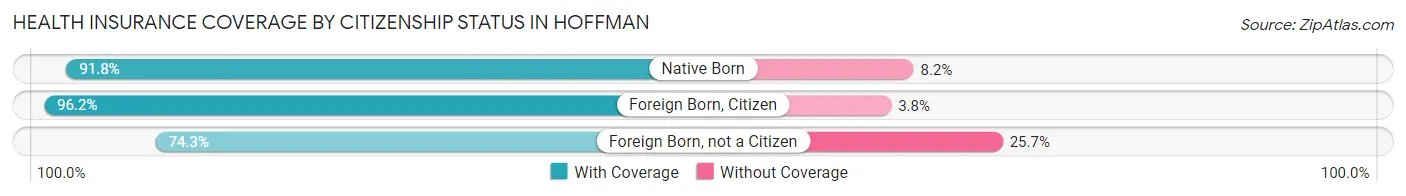
| Citizenship Status | With Coverage | Without Coverage |
| Native Born | 67 (91.8%) | 6 (8.2%) |
| Foreign Born, Citizen | 126 (96.2%) | 5 (3.8%) |
| Foreign Born, not a Citizen | 75 (74.3%) | 26 (25.7%) |
Health Insurance Coverage by Household Income in Hoffman
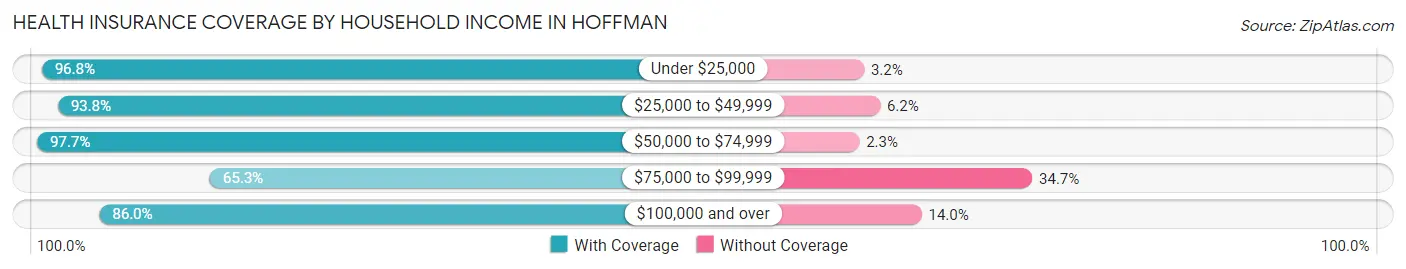
| Household Income | With Coverage | Without Coverage |
| Under $25,000 | 301 (96.8%) | 10 (3.2%) |
| $25,000 to $49,999 | 136 (93.8%) | 9 (6.2%) |
| $50,000 to $74,999 | 84 (97.7%) | 2 (2.3%) |
| $75,000 to $99,999 | 47 (65.3%) | 25 (34.7%) |
| $100,000 and over | 178 (86.0%) | 29 (14.0%) |
Public vs Private Health Insurance Coverage by Age in Hoffman
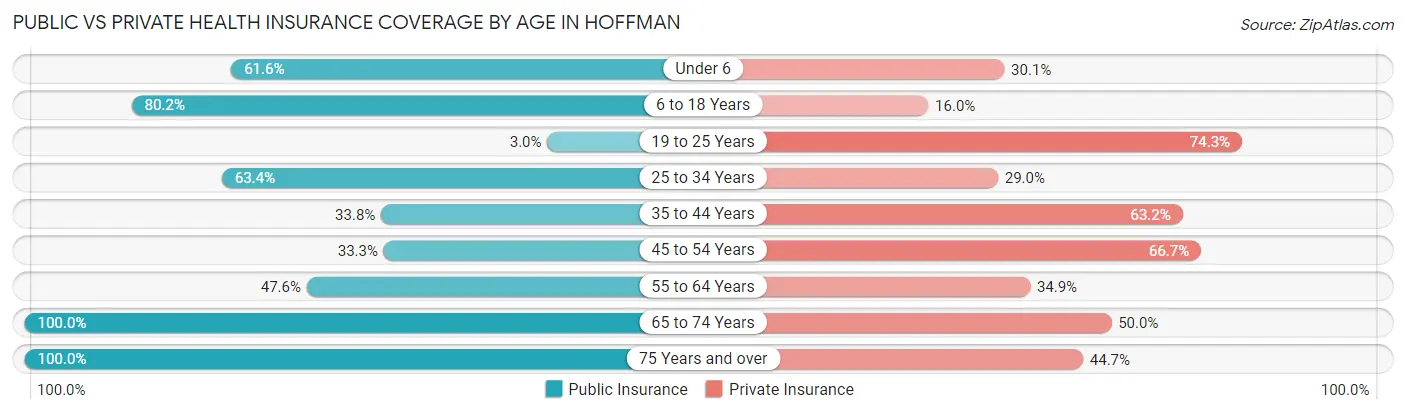
| Age Bracket | Public Insurance | Private Insurance |
| Under 6 | 45 (61.6%) | 22 (30.1%) |
| 6 to 18 Years | 105 (80.1%) | 21 (16.0%) |
| 19 to 25 Years | 3 (3.0%) | 75 (74.3%) |
| 25 to 34 Years | 116 (63.4%) | 53 (29.0%) |
| 35 to 44 Years | 23 (33.8%) | 43 (63.2%) |
| 45 to 54 Years | 27 (33.3%) | 54 (66.7%) |
| 55 to 64 Years | 60 (47.6%) | 44 (34.9%) |
| 65 to 74 Years | 28 (100.0%) | 14 (50.0%) |
| 75 Years and over | 38 (100.0%) | 17 (44.7%) |
| Total | 445 (53.7%) | 343 (41.4%) |
Disability Status by Sex by Age in Hoffman
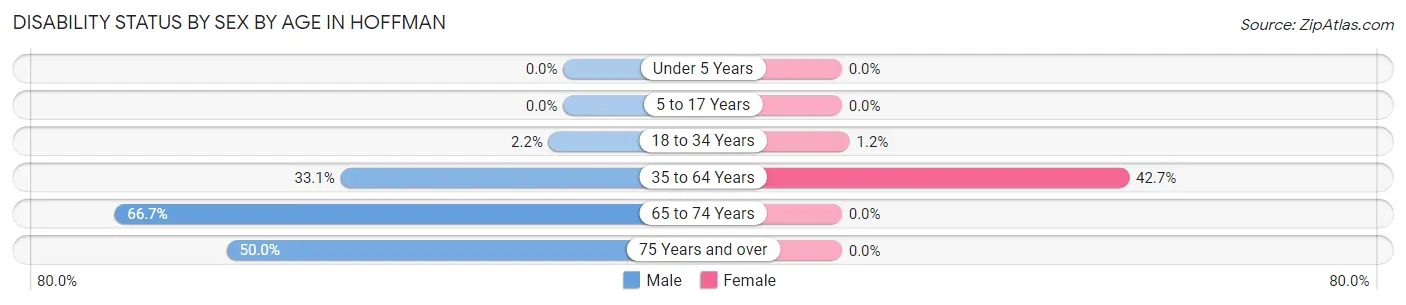
| Age Bracket | Male | Female |
| Under 5 Years | 0 (0.0%) | 0 (0.0%) |
| 5 to 17 Years | 0 (0.0%) | 0 (0.0%) |
| 18 to 34 Years | 3 (2.2%) | 2 (1.2%) |
| 35 to 64 Years | 46 (33.1%) | 58 (42.6%) |
| 65 to 74 Years | 6 (66.7%) | 0 (0.0%) |
| 75 Years and over | 16 (50.0%) | 0 (0.0%) |
Disability Class by Sex by Age in Hoffman
Disability Class: Hearing Difficulty
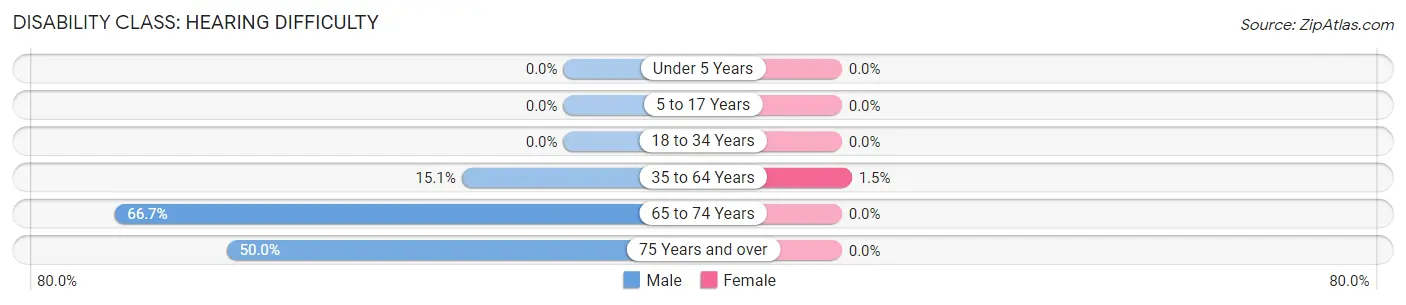
| Age Bracket | Male | Female |
| Under 5 Years | 0 (0.0%) | 0 (0.0%) |
| 5 to 17 Years | 0 (0.0%) | 0 (0.0%) |
| 18 to 34 Years | 0 (0.0%) | 0 (0.0%) |
| 35 to 64 Years | 21 (15.1%) | 2 (1.5%) |
| 65 to 74 Years | 6 (66.7%) | 0 (0.0%) |
| 75 Years and over | 16 (50.0%) | 0 (0.0%) |
Disability Class: Vision Difficulty
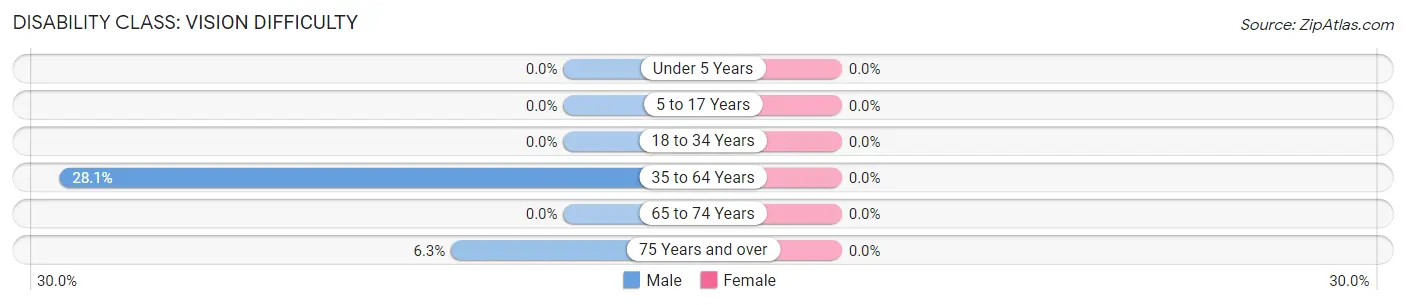
| Age Bracket | Male | Female |
| Under 5 Years | 0 (0.0%) | 0 (0.0%) |
| 5 to 17 Years | 0 (0.0%) | 0 (0.0%) |
| 18 to 34 Years | 0 (0.0%) | 0 (0.0%) |
| 35 to 64 Years | 39 (28.1%) | 0 (0.0%) |
| 65 to 74 Years | 0 (0.0%) | 0 (0.0%) |
| 75 Years and over | 2 (6.2%) | 0 (0.0%) |
Disability Class: Cognitive Difficulty
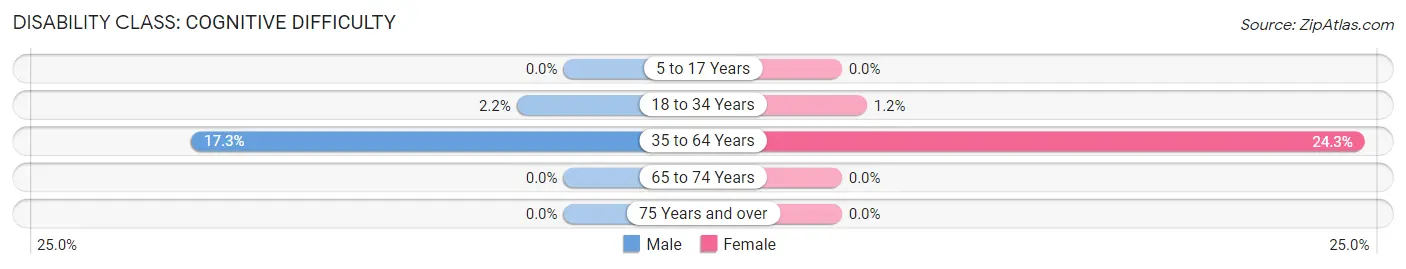
| Age Bracket | Male | Female |
| 5 to 17 Years | 0 (0.0%) | 0 (0.0%) |
| 18 to 34 Years | 3 (2.2%) | 2 (1.2%) |
| 35 to 64 Years | 24 (17.3%) | 33 (24.3%) |
| 65 to 74 Years | 0 (0.0%) | 0 (0.0%) |
| 75 Years and over | 0 (0.0%) | 0 (0.0%) |
Disability Class: Ambulatory Difficulty
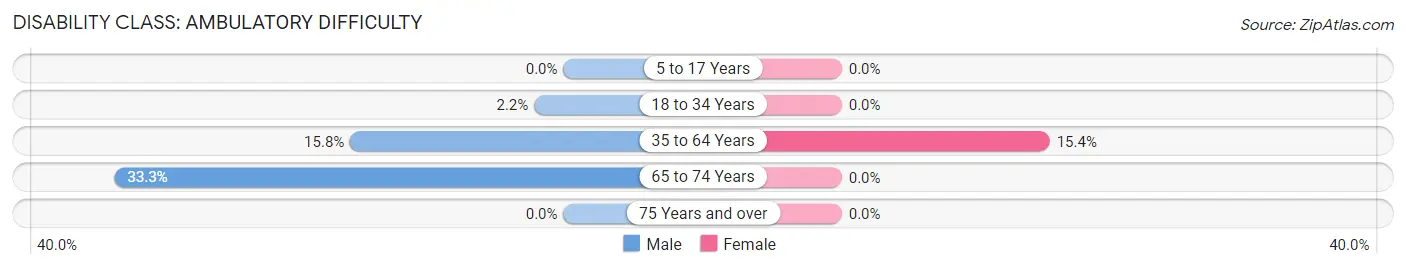
| Age Bracket | Male | Female |
| 5 to 17 Years | 0 (0.0%) | 0 (0.0%) |
| 18 to 34 Years | 3 (2.2%) | 0 (0.0%) |
| 35 to 64 Years | 22 (15.8%) | 21 (15.4%) |
| 65 to 74 Years | 3 (33.3%) | 0 (0.0%) |
| 75 Years and over | 0 (0.0%) | 0 (0.0%) |
Disability Class: Self-Care Difficulty
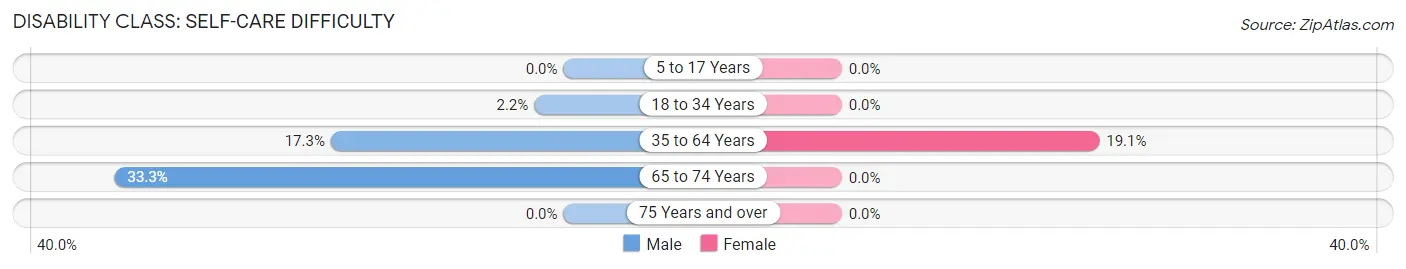
| Age Bracket | Male | Female |
| 5 to 17 Years | 0 (0.0%) | 0 (0.0%) |
| 18 to 34 Years | 3 (2.2%) | 0 (0.0%) |
| 35 to 64 Years | 24 (17.3%) | 26 (19.1%) |
| 65 to 74 Years | 3 (33.3%) | 0 (0.0%) |
| 75 Years and over | 0 (0.0%) | 0 (0.0%) |
Technology Access in Hoffman
Computing Device Access in Hoffman
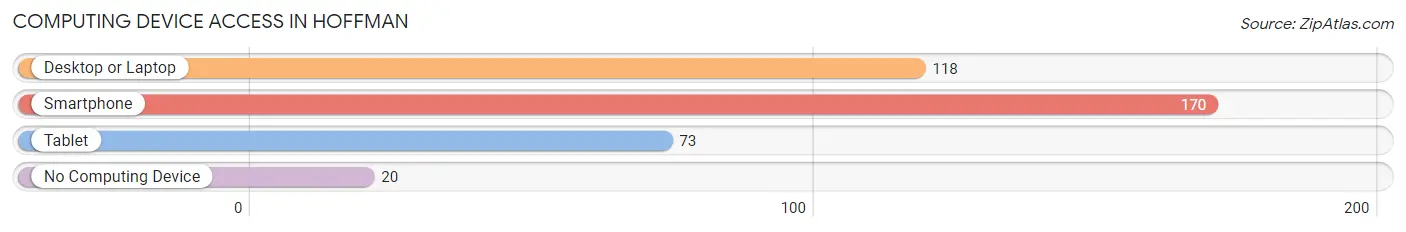
| Device Type | # Households | % Households |
| Desktop or Laptop | 118 | 58.7% |
| Smartphone | 170 | 84.6% |
| Tablet | 73 | 36.3% |
| No Computing Device | 20 | 10.0% |
| Total | 201 | 100.0% |
Internet Access in Hoffman
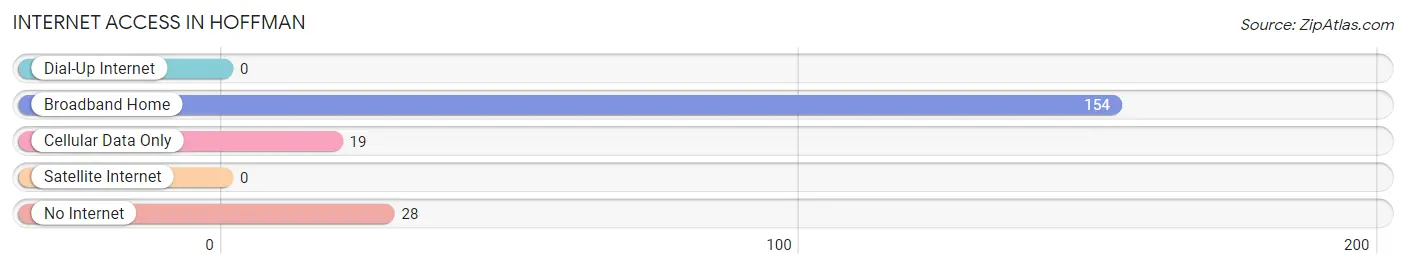
| Internet Type | # Households | % Households |
| Dial-Up Internet | 0 | 0.0% |
| Broadband Home | 154 | 76.6% |
| Cellular Data Only | 19 | 9.5% |
| Satellite Internet | 0 | 0.0% |
| No Internet | 28 | 13.9% |
| Total | 201 | 100.0% |
Hoffman Summary
Hoffman is a small town located in Richmond County, North Carolina. It is situated in the Sandhills region of the state, approximately 30 miles south of the state capital of Raleigh. The town has a population of approximately 1,000 people and is part of the larger Fayetteville metropolitan area.
History
Hoffman was founded in 1887 by a group of German immigrants who had settled in the area. The town was named after the Hoffman family, who were among the first settlers. The town was originally a farming community, but in the early 20th century, the economy shifted to focus on the production of textiles. The town was home to several cotton mills, which provided employment for many of the town’s residents.
In the 1950s, Hoffman began to experience a decline in its economy as the textile industry began to move away from the area. The town’s population began to decline as well, and by the 1970s, the town was in a state of economic decline. In the 1980s, the town began to experience a resurgence as new businesses began to move into the area. Today, Hoffman is a small but vibrant community with a diverse economy.
Geography
Hoffman is located in the Sandhills region of North Carolina, approximately 30 miles south of the state capital of Raleigh. The town is situated in the Piedmont region of the state, which is characterized by rolling hills and forests. The town is located near the Cape Fear River, which provides a source of recreation for the town’s residents.
The climate in Hoffman is generally mild, with temperatures ranging from the mid-50s in the winter to the mid-80s in the summer. The town receives an average of 45 inches of rain per year, and snowfall is rare.
Economy
Hoffman’s economy is largely based on agriculture and manufacturing. The town is home to several farms, which produce a variety of crops, including corn, soybeans, and cotton. The town is also home to several manufacturing companies, which produce a variety of products, including textiles, furniture, and automotive parts.
The town is also home to several small businesses, including restaurants, retail stores, and service providers. The town is also home to a number of tourist attractions, including a historic downtown area, a golf course, and a state park.
Demographics
As of the 2010 census, the population of Hoffman was 1,000. The town is predominantly white, with approximately 85% of the population identifying as white. The remaining 15% of the population is made up of African Americans, Hispanics, and other ethnicities. The median household income in Hoffman is $35,000, and the median home value is $125,000.
Hoffman is a small but vibrant community with a diverse economy and a rich history. The town is home to a variety of businesses, attractions, and recreational opportunities, making it an ideal place to live and work.
Common Questions
What is Per Capita Income in Hoffman?
Per Capita income in Hoffman is $22,093.
What is the Median Family Income in Hoffman?
Median Family Income in Hoffman is $45,114.
What is the Median Household income in Hoffman?
Median Household Income in Hoffman is $35,781.
What is Income or Wage Gap in Hoffman?
Income or Wage Gap in Hoffman is 44.3%.
Women in Hoffman earn 55.7 cents for every dollar earned by a man.
What is Inequality or Gini Index in Hoffman?
Inequality or Gini Index in Hoffman is 0.58.
What is the Total Population of Hoffman?
Total Population of Hoffman is 829.
What is the Total Male Population of Hoffman?
Total Male Population of Hoffman is 379.
What is the Total Female Population of Hoffman?
Total Female Population of Hoffman is 450.
What is the Ratio of Males per 100 Females in Hoffman?
There are 84.22 Males per 100 Females in Hoffman.
What is the Ratio of Females per 100 Males in Hoffman?
There are 118.73 Females per 100 Males in Hoffman.
What is the Median Population Age in Hoffman?
Median Population Age in Hoffman is 29.6 Years.
What is the Average Family Size in Hoffman
Average Family Size in Hoffman is 4.8 People.
What is the Average Household Size in Hoffman
Average Household Size in Hoffman is 4.1 People.
How Large is the Labor Force in Hoffman?
There are 284 People in the Labor Forcein in Hoffman.
What is the Percentage of People in the Labor Force in Hoffman?
40.9% of People are in the Labor Force in Hoffman.