Riegelwood, NC Map & Demographics
Riegelwood Map
Riegelwood Overview
$28,369
PER CAPITA INCOME
$42,452
AVG HOUSEHOLD INCOME
44.0%
WAGE / INCOME GAP [ % ]
56.0¢/ $1
WAGE / INCOME GAP [ $ ]
0.43
INEQUALITY / GINI INDEX
658
TOTAL POPULATION
302
MALE POPULATION
356
FEMALE POPULATION
84.83
MALES / 100 FEMALES
117.88
FEMALES / 100 MALES
54.2
MEDIAN AGE
2.8
AVG FAMILY SIZE
2.6
AVG HOUSEHOLD SIZE
312
LABOR FORCE [ PEOPLE ]
51.9%
PERCENT IN LABOR FORCE
3.5%
UNEMPLOYMENT RATE
Riegelwood Zip Codes
Riegelwood Area Codes
Income in Riegelwood
Income Overview in Riegelwood
| Characteristic | Number | Measure |
| Per Capita Income | 658 | $28,369 |
| Median Family Income | 203 | $0 |
| Mean Family Income | 203 | $78,784 |
| Median Household Income | 256 | $42,452 |
| Mean Household Income | 256 | $69,314 |
| Income Deficit | 203 | $0 |
| Wage / Income Gap (%) | 658 | 44.04% |
| Wage / Income Gap ($) | 658 | 55.96¢ per $1 |
| Gini / Inequality Index | 658 | 0.43 |
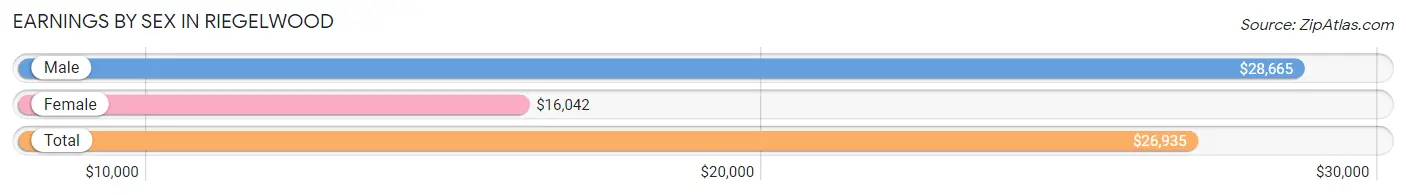
Earnings by Sex in Riegelwood
Average Earnings in Riegelwood are $26,935, $28,665 for men and $16,042 for women, a difference of 44.0%.
| Sex | Number | Average Earnings |
| Male | 179 (59.5%) | $28,665 |
| Female | 122 (40.5%) | $16,042 |
| Total | 301 (100.0%) | $26,935 |
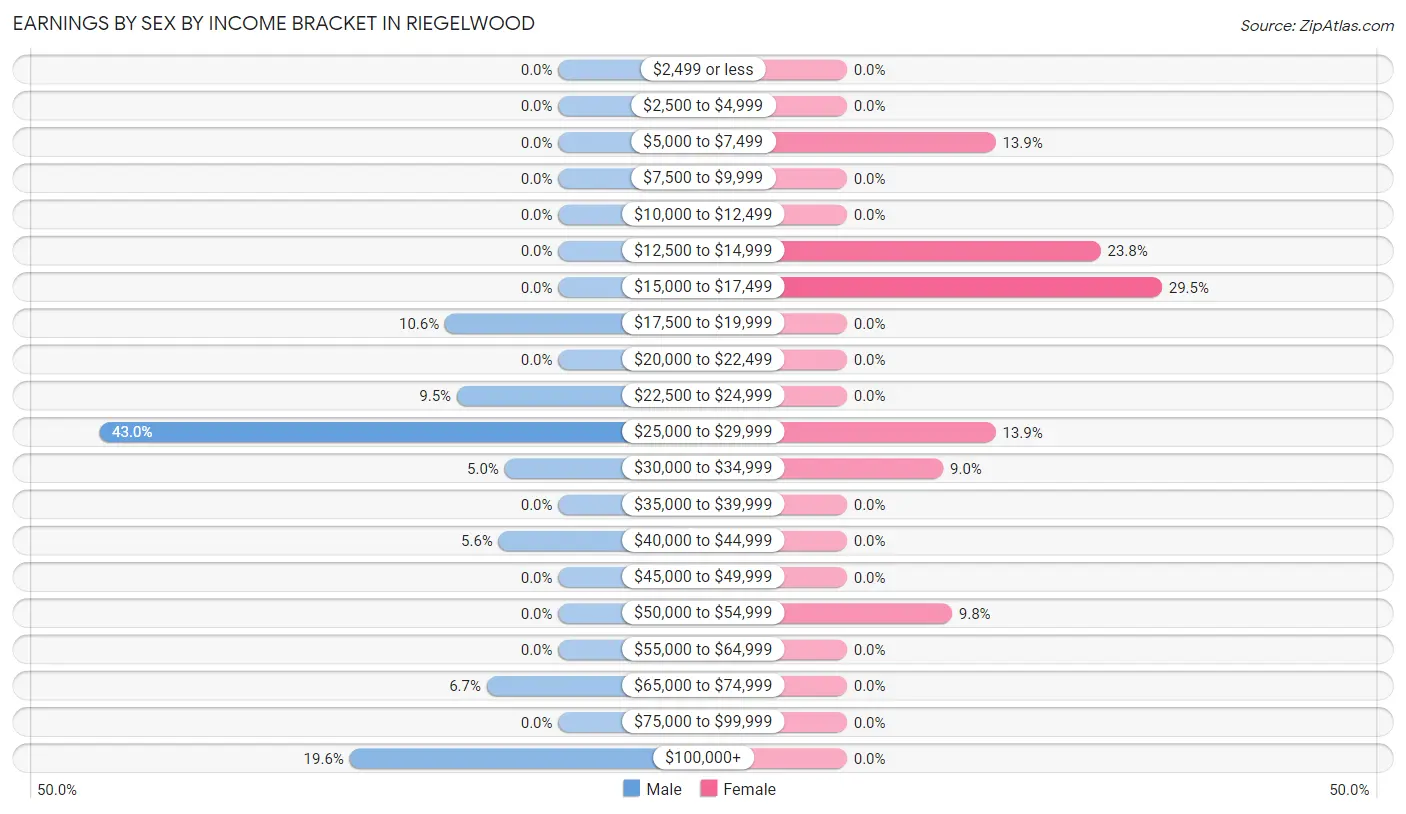
Earnings by Sex by Income Bracket in Riegelwood
The most common earnings brackets in Riegelwood are $25,000 to $29,999 for men (77 | 43.0%) and $15,000 to $17,499 for women (36 | 29.5%).
| Income | Male | Female |
| $2,499 or less | 0 (0.0%) | 0 (0.0%) |
| $2,500 to $4,999 | 0 (0.0%) | 0 (0.0%) |
| $5,000 to $7,499 | 0 (0.0%) | 17 (13.9%) |
| $7,500 to $9,999 | 0 (0.0%) | 0 (0.0%) |
| $10,000 to $12,499 | 0 (0.0%) | 0 (0.0%) |
| $12,500 to $14,999 | 0 (0.0%) | 29 (23.8%) |
| $15,000 to $17,499 | 0 (0.0%) | 36 (29.5%) |
| $17,500 to $19,999 | 19 (10.6%) | 0 (0.0%) |
| $20,000 to $22,499 | 0 (0.0%) | 0 (0.0%) |
| $22,500 to $24,999 | 17 (9.5%) | 0 (0.0%) |
| $25,000 to $29,999 | 77 (43.0%) | 17 (13.9%) |
| $30,000 to $34,999 | 9 (5.0%) | 11 (9.0%) |
| $35,000 to $39,999 | 0 (0.0%) | 0 (0.0%) |
| $40,000 to $44,999 | 10 (5.6%) | 0 (0.0%) |
| $45,000 to $49,999 | 0 (0.0%) | 0 (0.0%) |
| $50,000 to $54,999 | 0 (0.0%) | 12 (9.8%) |
| $55,000 to $64,999 | 0 (0.0%) | 0 (0.0%) |
| $65,000 to $74,999 | 12 (6.7%) | 0 (0.0%) |
| $75,000 to $99,999 | 0 (0.0%) | 0 (0.0%) |
| $100,000+ | 35 (19.6%) | 0 (0.0%) |
| Total | 179 (100.0%) | 122 (100.0%) |
Earnings by Sex by Educational Attainment in Riegelwood
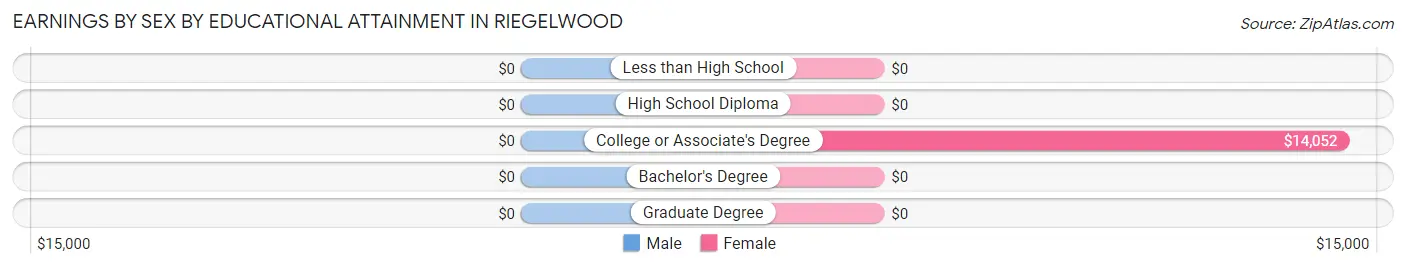
| Educational Attainment | Male Income | Female Income |
| Less than High School | - | - |
| High School Diploma | - | - |
| College or Associate's Degree | - | - |
| Bachelor's Degree | - | - |
| Graduate Degree | - | - |
| Total | - | - |
Family Income in Riegelwood
Family Income Brackets in Riegelwood
According to the Riegelwood family income data, there are 73 families falling into the $35,000 to $49,999 income range, which is the most common income bracket and makes up 36.0% of all families.
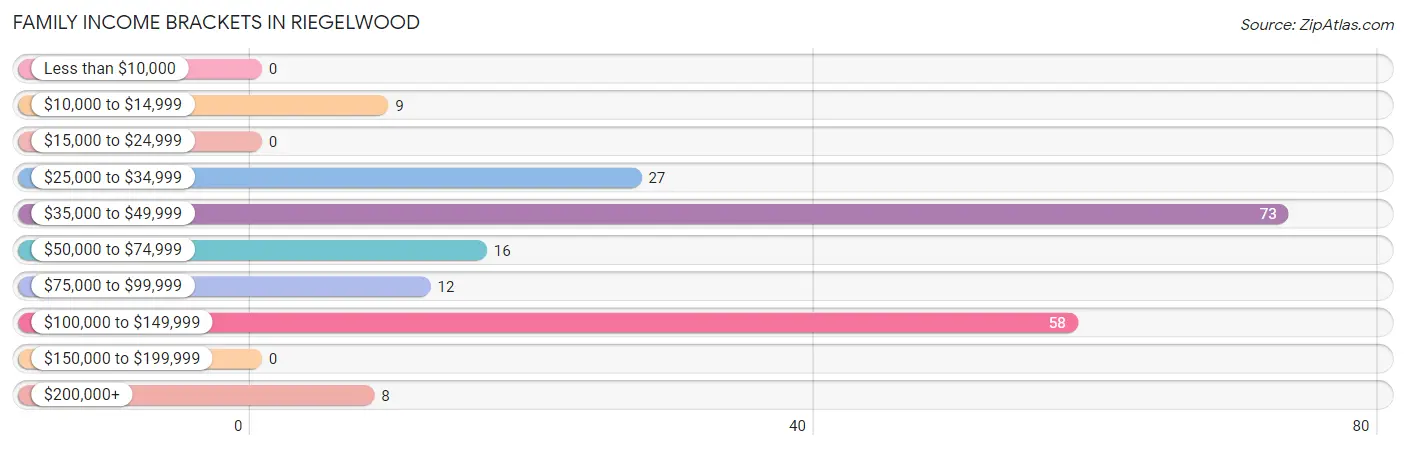
| Income Bracket | # Families | % Families |
| Less than $10,000 | 0 | 0.0% |
| $10,000 to $14,999 | 9 | 4.4% |
| $15,000 to $24,999 | 0 | 0.0% |
| $25,000 to $34,999 | 27 | 13.3% |
| $35,000 to $49,999 | 73 | 36.0% |
| $50,000 to $74,999 | 16 | 7.9% |
| $75,000 to $99,999 | 12 | 5.9% |
| $100,000 to $149,999 | 58 | 28.6% |
| $150,000 to $199,999 | 0 | 0.0% |
| $200,000+ | 8 | 3.9% |
Family Income by Famaliy Size in Riegelwood
3-person families (54 | 26.6%) account for the highest median family income in Riegelwood with $39,643 per family, while 3-person families (54 | 26.6%) have the highest median income of $13,214 per family member.
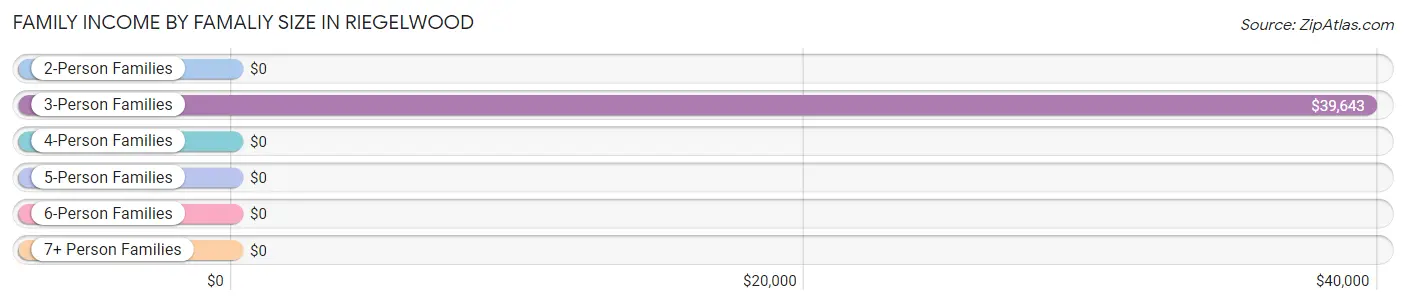
| Income Bracket | # Families | Median Income |
| 2-Person Families | 128 (63.0%) | $0 |
| 3-Person Families | 54 (26.6%) | $39,643 |
| 4-Person Families | 12 (5.9%) | $0 |
| 5-Person Families | 9 (4.4%) | $0 |
| 6-Person Families | 0 (0.0%) | $0 |
| 7+ Person Families | 0 (0.0%) | $0 |
| Total | 203 (100.0%) | $0 |
Family Income by Number of Earners in Riegelwood
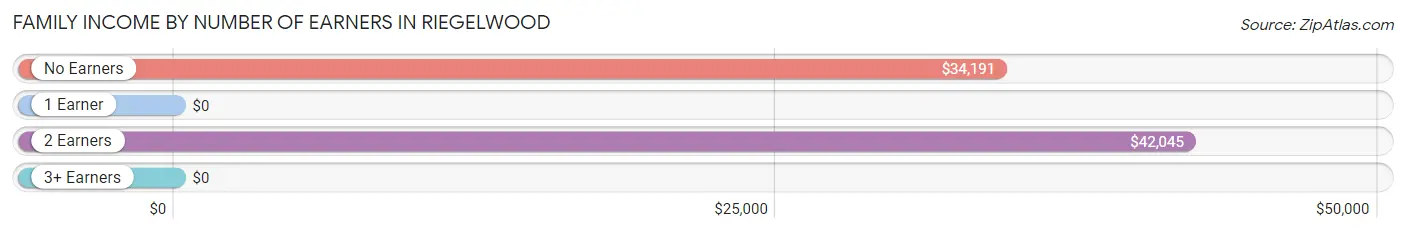
| Number of Earners | # Families | Median Income |
| No Earners | 43 (21.2%) | $34,191 |
| 1 Earner | 98 (48.3%) | $0 |
| 2 Earners | 54 (26.6%) | $42,045 |
| 3+ Earners | 8 (3.9%) | $0 |
| Total | 203 (100.0%) | $0 |
Household Income in Riegelwood
Household Income Brackets in Riegelwood
With 58 households falling in the category, the $100,000 to $149,999 income range is the most frequent in Riegelwood, accounting for 22.7% of all households.
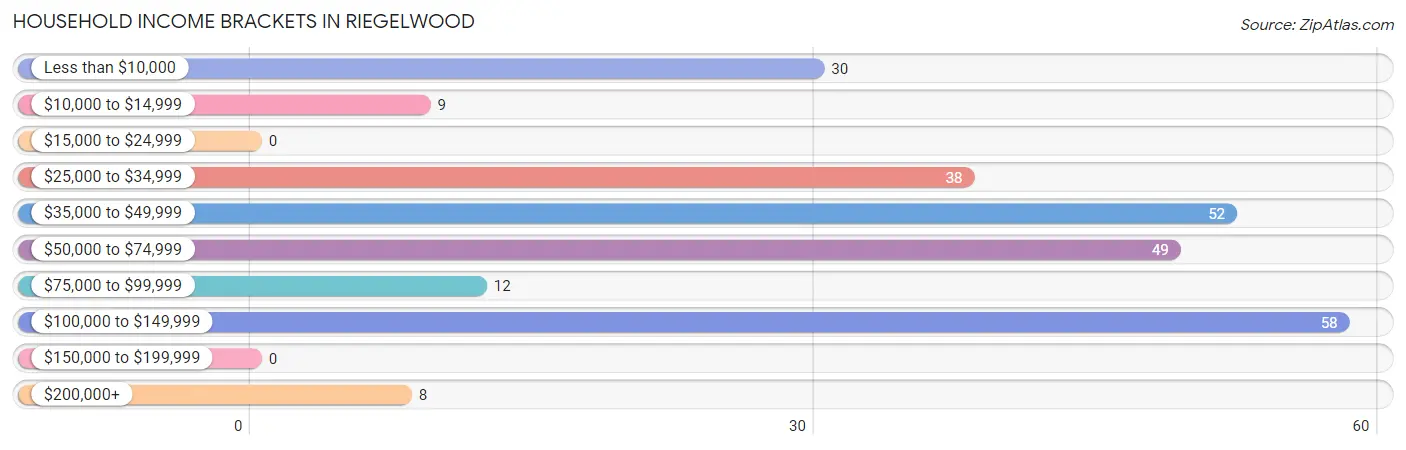
| Income Bracket | # Households | % Households |
| Less than $10,000 | 30 | 11.7% |
| $10,000 to $14,999 | 9 | 3.5% |
| $15,000 to $24,999 | 0 | 0.0% |
| $25,000 to $34,999 | 38 | 14.8% |
| $35,000 to $49,999 | 52 | 20.3% |
| $50,000 to $74,999 | 49 | 19.1% |
| $75,000 to $99,999 | 12 | 4.7% |
| $100,000 to $149,999 | 58 | 22.7% |
| $150,000 to $199,999 | 0 | 0.0% |
| $200,000+ | 8 | 3.1% |
Household Income by Householder Age in Riegelwood
| Income Bracket | # Households | Median Income |
| 15 to 24 Years | 33 (12.9%) | $0 |
| 25 to 44 Years | 23 (9.0%) | $0 |
| 45 to 64 Years | 87 (34.0%) | $0 |
| 65+ Years | 113 (44.1%) | $0 |
| Total | 256 (100.0%) | $42,452 |
Poverty in Riegelwood
Income Below Poverty by Sex and Age in Riegelwood
With 6.6% poverty level for males and 15.7% for females among the residents of Riegelwood, 55 to 64 year old males and 65 to 74 year old females are the most vulnerable to poverty, with 20 males (26.7%) and 30 females (53.6%) in their respective age groups living below the poverty level.
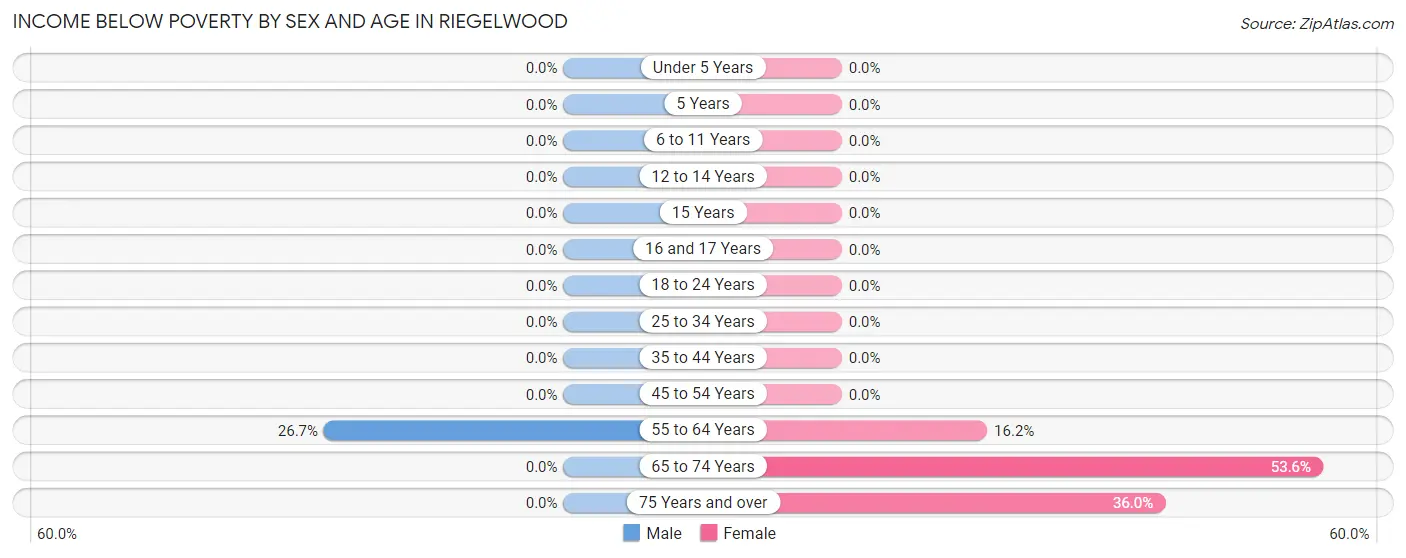
| Age Bracket | Male | Female |
| Under 5 Years | 0 (0.0%) | 0 (0.0%) |
| 5 Years | 0 (0.0%) | 0 (0.0%) |
| 6 to 11 Years | 0 (0.0%) | 0 (0.0%) |
| 12 to 14 Years | 0 (0.0%) | 0 (0.0%) |
| 15 Years | 0 (0.0%) | 0 (0.0%) |
| 16 and 17 Years | 0 (0.0%) | 0 (0.0%) |
| 18 to 24 Years | 0 (0.0%) | 0 (0.0%) |
| 25 to 34 Years | 0 (0.0%) | 0 (0.0%) |
| 35 to 44 Years | 0 (0.0%) | 0 (0.0%) |
| 45 to 54 Years | 0 (0.0%) | 0 (0.0%) |
| 55 to 64 Years | 20 (26.7%) | 17 (16.2%) |
| 65 to 74 Years | 0 (0.0%) | 30 (53.6%) |
| 75 Years and over | 0 (0.0%) | 9 (36.0%) |
| Total | 20 (6.6%) | 56 (15.7%) |
Income Above Poverty by Sex and Age in Riegelwood
According to the poverty statistics in Riegelwood, males aged under 5 years and females aged under 5 years are the age groups that are most secure financially, with 100.0% of males and 100.0% of females in these age groups living above the poverty line.
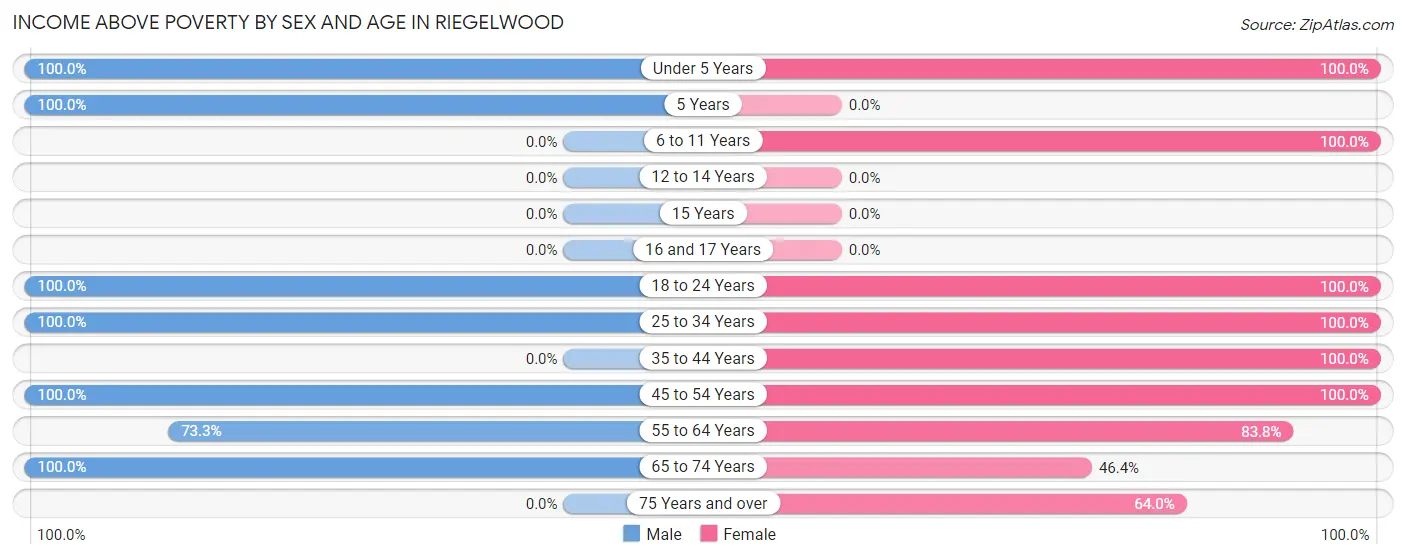
| Age Bracket | Male | Female |
| Under 5 Years | 9 (100.0%) | 15 (100.0%) |
| 5 Years | 8 (100.0%) | 0 (0.0%) |
| 6 to 11 Years | 0 (0.0%) | 25 (100.0%) |
| 12 to 14 Years | 0 (0.0%) | 0 (0.0%) |
| 15 Years | 0 (0.0%) | 0 (0.0%) |
| 16 and 17 Years | 0 (0.0%) | 0 (0.0%) |
| 18 to 24 Years | 69 (100.0%) | 24 (100.0%) |
| 25 to 34 Years | 56 (100.0%) | 65 (100.0%) |
| 35 to 44 Years | 0 (0.0%) | 19 (100.0%) |
| 45 to 54 Years | 27 (100.0%) | 22 (100.0%) |
| 55 to 64 Years | 55 (73.3%) | 88 (83.8%) |
| 65 to 74 Years | 58 (100.0%) | 26 (46.4%) |
| 75 Years and over | 0 (0.0%) | 16 (64.0%) |
| Total | 282 (93.4%) | 300 (84.3%) |
Income Below Poverty Among Married-Couple Families in Riegelwood
| Children | Above Poverty | Below Poverty |
| No Children | 127 (100.0%) | 0 (0.0%) |
| 1 or 2 Children | 21 (100.0%) | 0 (0.0%) |
| 3 or 4 Children | 9 (100.0%) | 0 (0.0%) |
| 5 or more Children | 0 (0.0%) | 0 (0.0%) |
| Total | 157 (100.0%) | 0 (0.0%) |
Income Below Poverty Among Single-Parent Households in Riegelwood
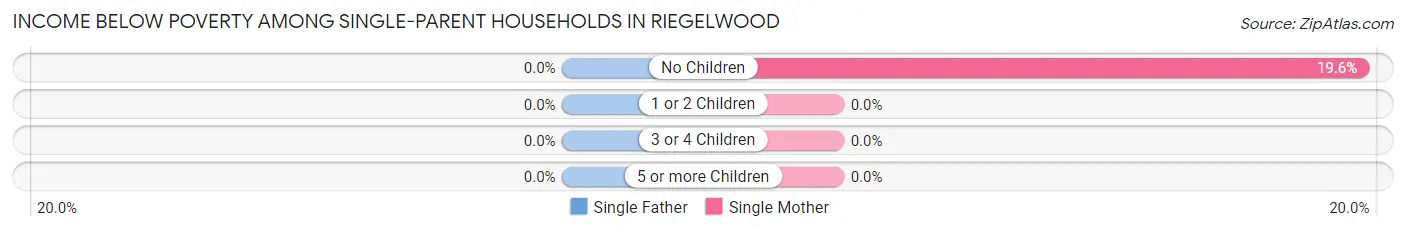
| Children | Single Father | Single Mother |
| No Children | 0 (0.0%) | 9 (19.6%) |
| 1 or 2 Children | 0 (0.0%) | 0 (0.0%) |
| 3 or 4 Children | 0 (0.0%) | 0 (0.0%) |
| 5 or more Children | 0 (0.0%) | 0 (0.0%) |
| Total | 0 (0.0%) | 9 (19.6%) |
Income Below Poverty Among Married-Couple vs Single-Parent Households in Riegelwood
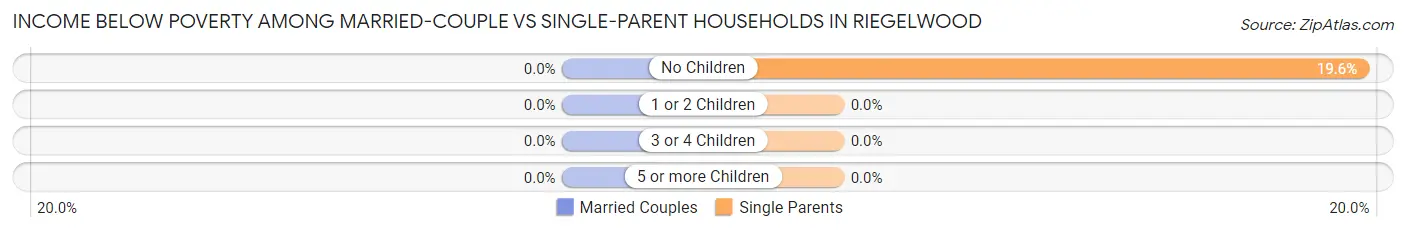
| Children | Married-Couple Families | Single-Parent Households |
| No Children | 0 (0.0%) | 9 (19.6%) |
| 1 or 2 Children | 0 (0.0%) | 0 (0.0%) |
| 3 or 4 Children | 0 (0.0%) | 0 (0.0%) |
| 5 or more Children | 0 (0.0%) | 0 (0.0%) |
| Total | 0 (0.0%) | 9 (19.6%) |
Race in Riegelwood
The most populous races in Riegelwood are White / Caucasian (424 | 64.4%), Black / African American (169 | 25.7%), and Two or more Races (33 | 5.0%).
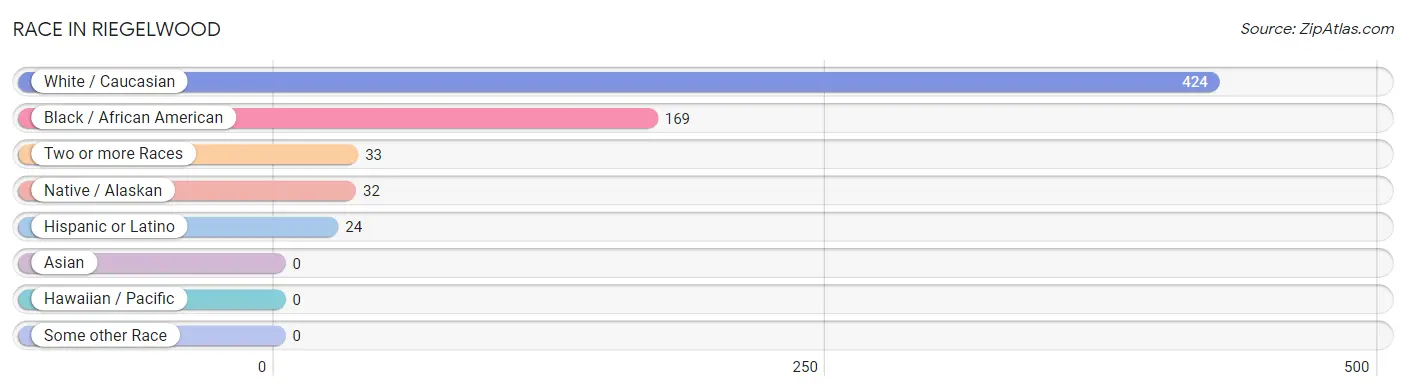
| Race | # Population | % Population |
| Asian | 0 | 0.0% |
| Black / African American | 169 | 25.7% |
| Hawaiian / Pacific | 0 | 0.0% |
| Hispanic or Latino | 24 | 3.6% |
| Native / Alaskan | 32 | 4.9% |
| White / Caucasian | 424 | 64.4% |
| Two or more Races | 33 | 5.0% |
| Some other Race | 0 | 0.0% |
| Total | 658 | 100.0% |
Ancestry in Riegelwood
The most populous ancestries reported in Riegelwood are Irish (75 | 11.4%), American (62 | 9.4%), German (52 | 7.9%), and Cherokee (8 | 1.2%), together accounting for 29.9% of all Riegelwood residents.
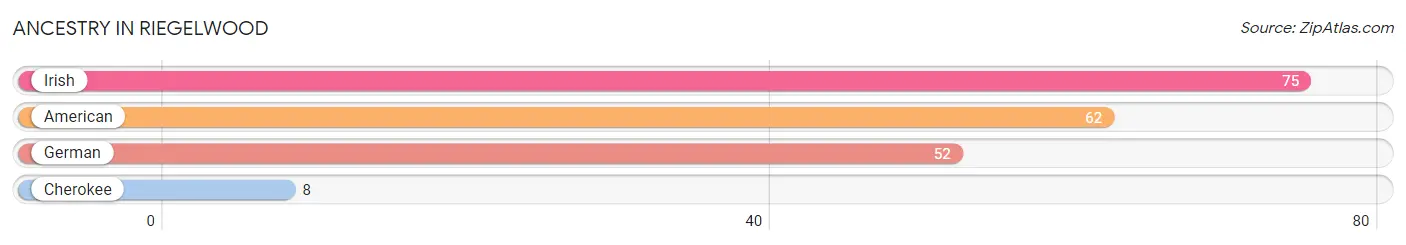
| Ancestry | # Population | % Population |
| American | 62 | 9.4% |
| Cherokee | 8 | 1.2% |
| German | 52 | 7.9% |
| Irish | 75 | 11.4% | View All 4 Rows |
Immigrants in Riegelwood
The most numerous immigrant groups reported in Riegelwood came from Europe (29 | 4.4%), Germany (29 | 4.4%), Western Europe (29 | 4.4%), Asia (10 | 1.5%), and Philippines (10 | 1.5%), together accounting for 16.3% of all Riegelwood residents.
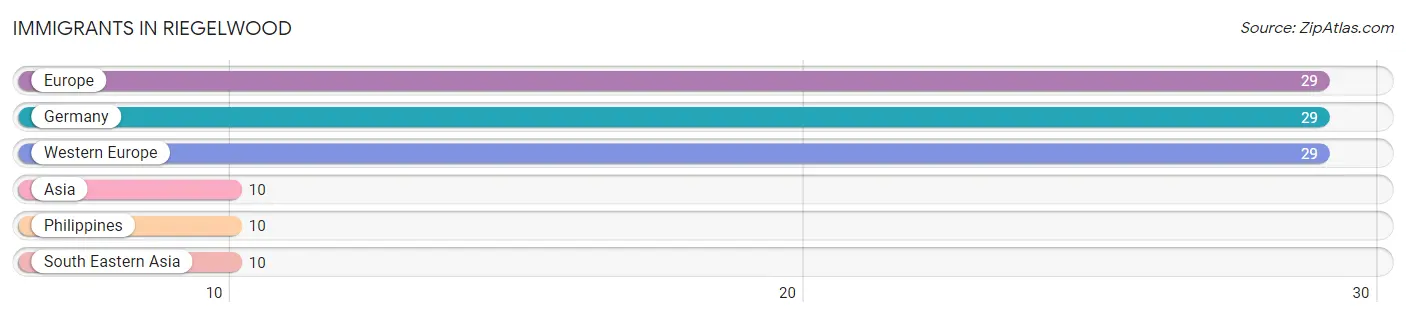
| Immigration Origin | # Population | % Population |
| Asia | 10 | 1.5% |
| Europe | 29 | 4.4% |
| Germany | 29 | 4.4% |
| Philippines | 10 | 1.5% |
| South Eastern Asia | 10 | 1.5% |
| Western Europe | 29 | 4.4% | View All 6 Rows |
Sex and Age in Riegelwood
Sex and Age in Riegelwood
The most populous age groups in Riegelwood are 20 to 24 Years (52 | 17.2%) for men and 60 to 64 Years (73 | 20.5%) for women.
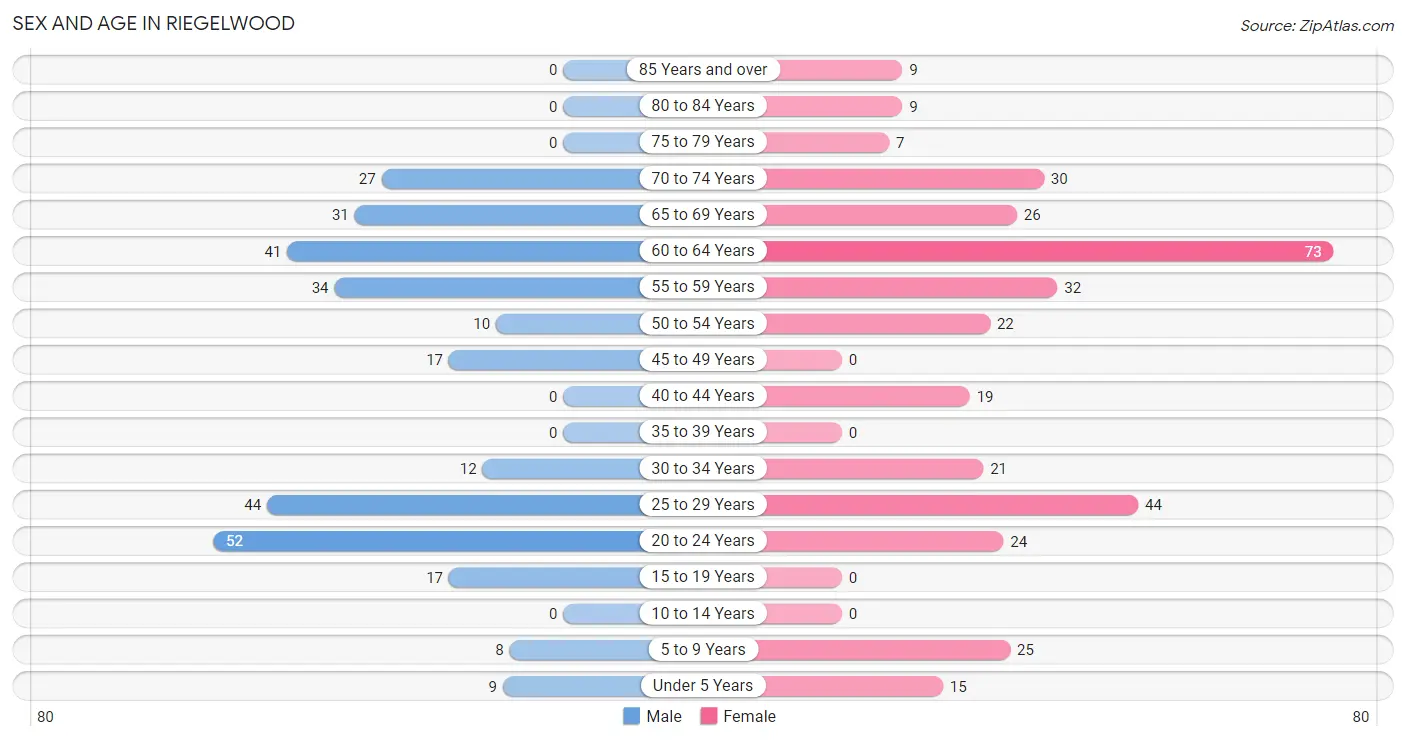
| Age Bracket | Male | Female |
| Under 5 Years | 9 (3.0%) | 15 (4.2%) |
| 5 to 9 Years | 8 (2.6%) | 25 (7.0%) |
| 10 to 14 Years | 0 (0.0%) | 0 (0.0%) |
| 15 to 19 Years | 17 (5.6%) | 0 (0.0%) |
| 20 to 24 Years | 52 (17.2%) | 24 (6.7%) |
| 25 to 29 Years | 44 (14.6%) | 44 (12.4%) |
| 30 to 34 Years | 12 (4.0%) | 21 (5.9%) |
| 35 to 39 Years | 0 (0.0%) | 0 (0.0%) |
| 40 to 44 Years | 0 (0.0%) | 19 (5.3%) |
| 45 to 49 Years | 17 (5.6%) | 0 (0.0%) |
| 50 to 54 Years | 10 (3.3%) | 22 (6.2%) |
| 55 to 59 Years | 34 (11.3%) | 32 (9.0%) |
| 60 to 64 Years | 41 (13.6%) | 73 (20.5%) |
| 65 to 69 Years | 31 (10.3%) | 26 (7.3%) |
| 70 to 74 Years | 27 (8.9%) | 30 (8.4%) |
| 75 to 79 Years | 0 (0.0%) | 7 (2.0%) |
| 80 to 84 Years | 0 (0.0%) | 9 (2.5%) |
| 85 Years and over | 0 (0.0%) | 9 (2.5%) |
| Total | 302 (100.0%) | 356 (100.0%) |
Families and Households in Riegelwood
Median Family Size in Riegelwood
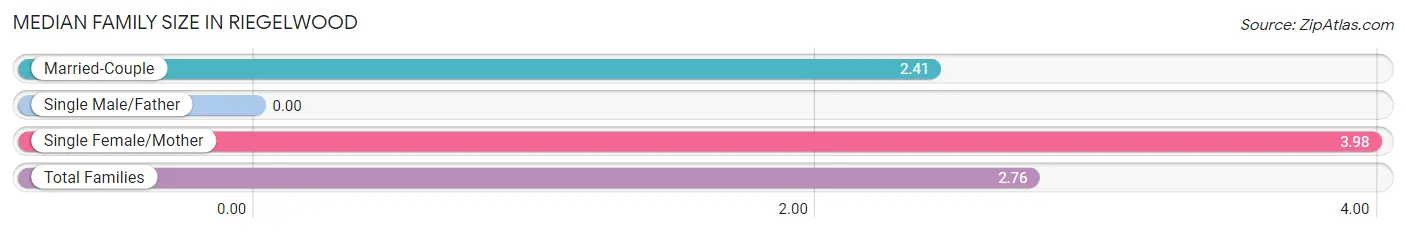
| Family Type | # Families | Family Size |
| Married-Couple | 157 (77.3%) | 2.41 |
| Single Male/Father | 0 (0.0%) | - |
| Single Female/Mother | 46 (22.7%) | 3.98 |
| Total Families | 203 (100.0%) | 2.76 |
Median Household Size in Riegelwood
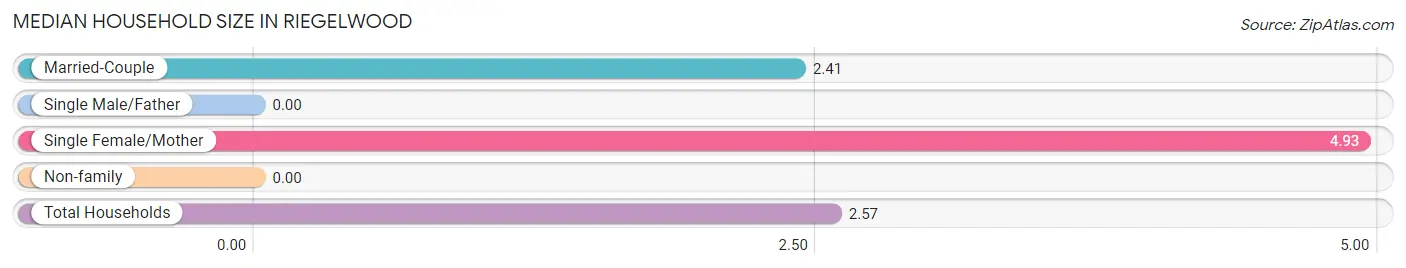
| Household Type | # Households | Household Size |
| Married-Couple | 157 (61.3%) | 2.41 |
| Single Male/Father | 0 (0.0%) | - |
| Single Female/Mother | 46 (18.0%) | 4.93 |
| Non-family | 53 (20.7%) | - |
| Total Households | 256 (100.0%) | 2.57 |
Household Size by Marriage Status in Riegelwood
Out of a total of 256 households in Riegelwood, 203 (79.3%) are family households, while 53 (20.7%) are nonfamily households. The most numerous type of family households are 2-person households, comprising 128, and the most common type of nonfamily households are 1-person households, comprising 53.
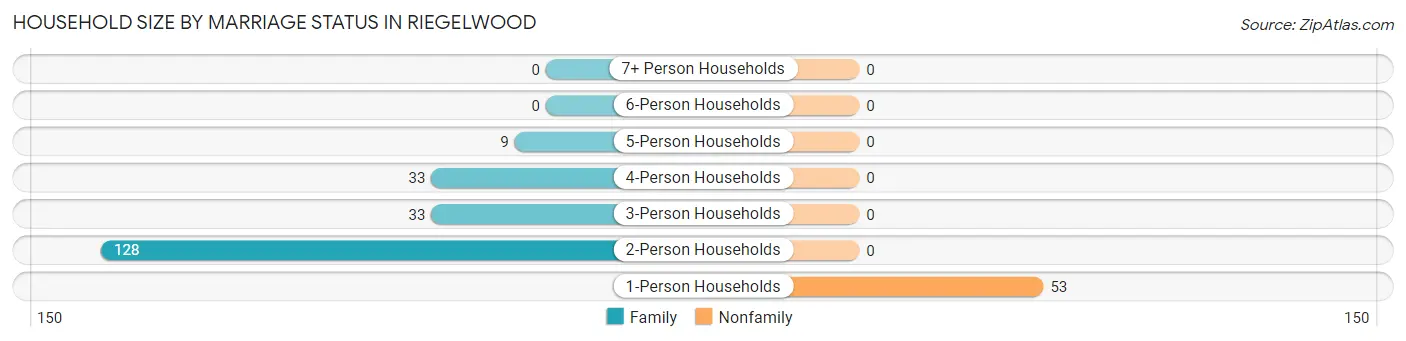
| Household Size | Family Households | Nonfamily Households |
| 1-Person Households | - | 53 (20.7%) |
| 2-Person Households | 128 (50.0%) | 0 (0.0%) |
| 3-Person Households | 33 (12.9%) | 0 (0.0%) |
| 4-Person Households | 33 (12.9%) | 0 (0.0%) |
| 5-Person Households | 9 (3.5%) | 0 (0.0%) |
| 6-Person Households | 0 (0.0%) | 0 (0.0%) |
| 7+ Person Households | 0 (0.0%) | 0 (0.0%) |
| Total | 203 (79.3%) | 53 (20.7%) |
Female Fertility in Riegelwood
Fertility by Age in Riegelwood
| Age Bracket | Women with Births | Births / 1,000 Women |
| 15 to 19 years | 0 (0.0%) | 0.0 |
| 20 to 34 years | 0 (0.0%) | 0.0 |
| 35 to 50 years | 0 (0.0%) | 0.0 |
| Total | 0 (0.0%) | 0.0 |
Fertility by Age by Marriage Status in Riegelwood
| Age Bracket | Married | Unmarried |
| 15 to 19 years | 0 (0.0%) | 0 (0.0%) |
| 20 to 34 years | 0 (0.0%) | 0 (0.0%) |
| 35 to 50 years | 0 (0.0%) | 0 (0.0%) |
| Total | 0 (0.0%) | 0 (0.0%) |
Fertility by Education in Riegelwood
| Educational Attainment | Women with Births | Births / 1,000 Women |
| Less than High School | 0 (0.0%) | 0.0 |
| High School Diploma | 0 (0.0%) | 0.0 |
| College or Associate's Degree | 0 (0.0%) | 0.0 |
| Bachelor's Degree | 0 (0.0%) | 0.0 |
| Graduate Degree | 0 (0.0%) | 0.0 |
| Total | 0 (0.0%) | 0.0 |
Fertility by Education by Marriage Status in Riegelwood
| Educational Attainment | Married | Unmarried |
| Less than High School | 0 (0.0%) | 0 (0.0%) |
| High School Diploma | 0 (0.0%) | 0 (0.0%) |
| College or Associate's Degree | 0 (0.0%) | 0 (0.0%) |
| Bachelor's Degree | 0 (0.0%) | 0 (0.0%) |
| Graduate Degree | 0 (0.0%) | 0 (0.0%) |
| Total | 0 (0.0%) | 0 (0.0%) |
Employment Characteristics in Riegelwood
Employment by Class of Employer in Riegelwood
Among the 301 employed individuals in Riegelwood, private company employees (265 | 88.0%), self-employed (incorporated) (16 | 5.3%), and state government employees (11 | 3.6%) make up the most common classes of employment.
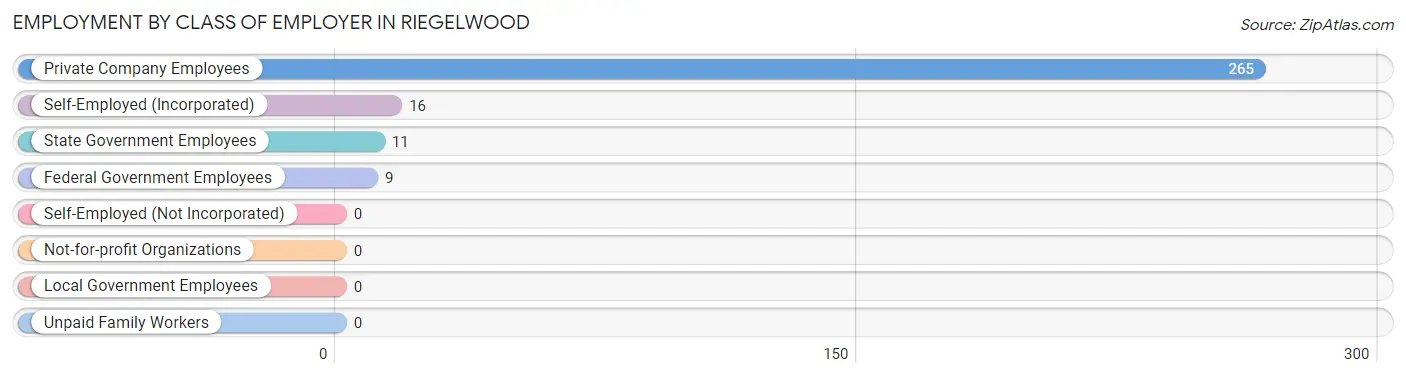
| Employer Class | # Employees | % Employees |
| Private Company Employees | 265 | 88.0% |
| Self-Employed (Incorporated) | 16 | 5.3% |
| Self-Employed (Not Incorporated) | 0 | 0.0% |
| Not-for-profit Organizations | 0 | 0.0% |
| Local Government Employees | 0 | 0.0% |
| State Government Employees | 11 | 3.6% |
| Federal Government Employees | 9 | 3.0% |
| Unpaid Family Workers | 0 | 0.0% |
| Total | 301 | 100.0% |
Employment Status by Age in Riegelwood
According to the labor force statistics for Riegelwood, out of the total population over 16 years of age (601), 51.9% or 312 individuals are in the labor force, with 3.5% or 11 of them unemployed. The age group with the highest labor force participation rate is 16 to 19 years, with 100.0% or 17 individuals in the labor force. Within the labor force, the 55 to 59 years age range has the highest percentage of unemployed individuals, with 100.0% or 11 of them being unemployed.
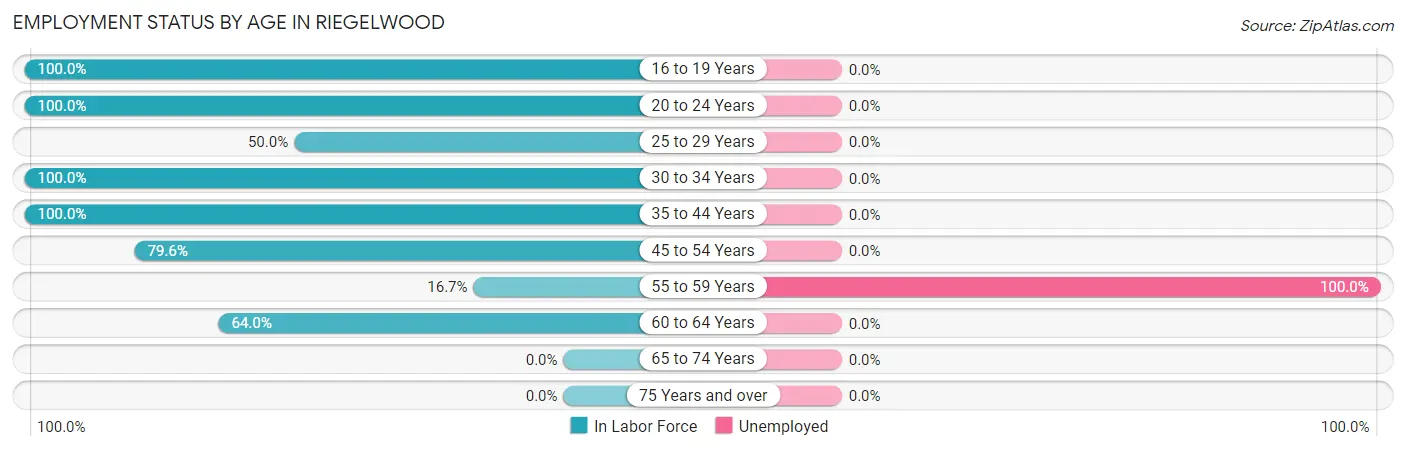
| Age Bracket | In Labor Force | Unemployed |
| 16 to 19 Years | 17 (100.0%) | 0 (0.0%) |
| 20 to 24 Years | 76 (100.0%) | 0 (0.0%) |
| 25 to 29 Years | 44 (50.0%) | 0 (0.0%) |
| 30 to 34 Years | 33 (100.0%) | 0 (0.0%) |
| 35 to 44 Years | 19 (100.0%) | 0 (0.0%) |
| 45 to 54 Years | 39 (79.6%) | 0 (0.0%) |
| 55 to 59 Years | 11 (16.7%) | 11 (100.0%) |
| 60 to 64 Years | 73 (64.0%) | 0 (0.0%) |
| 65 to 74 Years | 0 (0.0%) | 0 (0.0%) |
| 75 Years and over | 0 (0.0%) | 0 (0.0%) |
| Total | 312 (51.9%) | 11 (3.5%) |
Employment Status by Educational Attainment in Riegelwood
According to labor force statistics for Riegelwood, 59.3% of individuals (219) out of the total population between 25 and 64 years of age (369) are in the labor force, with 5.0% or 11 of them being unemployed. The group with the highest labor force participation rate are those with the educational attainment of bachelor's degree or higher, with 100.0% or 18 individuals in the labor force. Within the labor force, individuals with college / associate degree education have the highest percentage of unemployment, with 10.8% or 11 of them being unemployed.
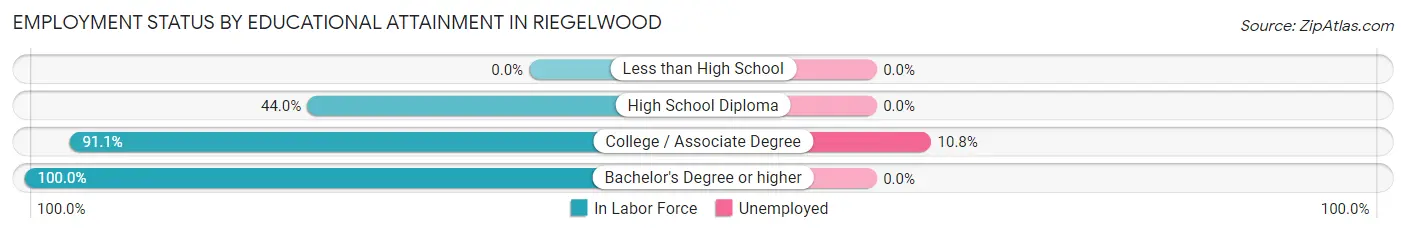
| Educational Attainment | In Labor Force | Unemployed |
| Less than High School | 0 (0.0%) | 0 (0.0%) |
| High School Diploma | 99 (44.0%) | 0 (0.0%) |
| College / Associate Degree | 102 (91.1%) | 12 (10.8%) |
| Bachelor's Degree or higher | 18 (100.0%) | 0 (0.0%) |
| Total | 219 (59.3%) | 18 (5.0%) |
Employment Occupations by Sex in Riegelwood
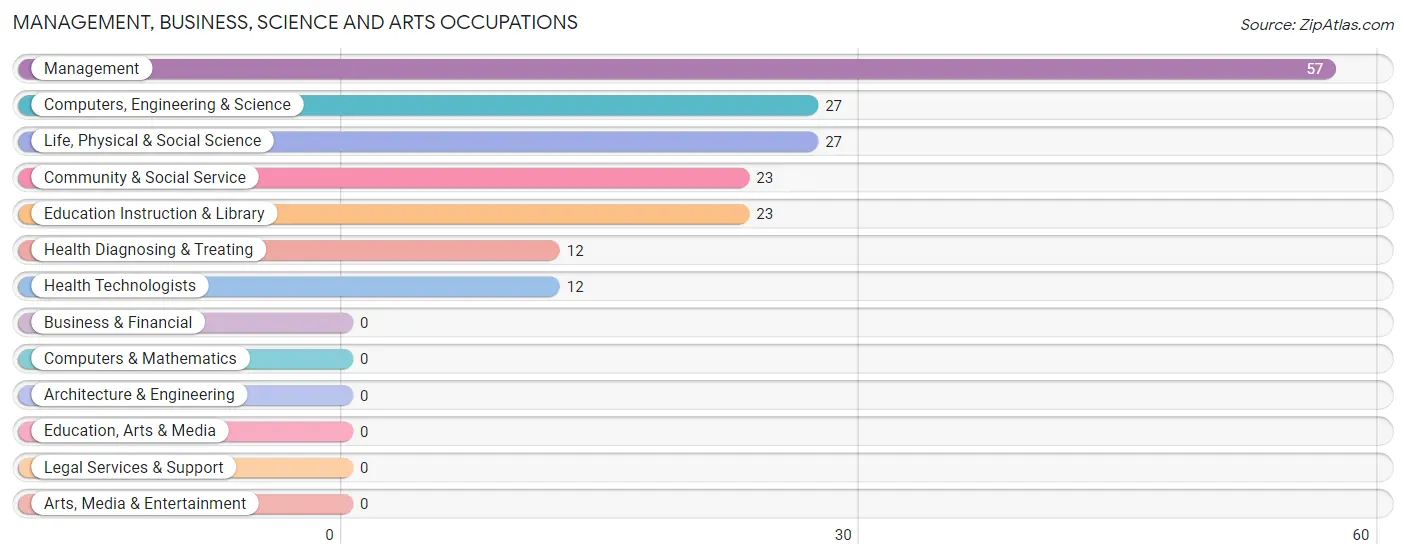
Management, Business, Science and Arts Occupations
The most common Management, Business, Science and Arts occupations in Riegelwood are Management (57 | 18.9%), Computers, Engineering & Science (27 | 9.0%), Life, Physical & Social Science (27 | 9.0%), Community & Social Service (23 | 7.6%), and Education Instruction & Library (23 | 7.6%).
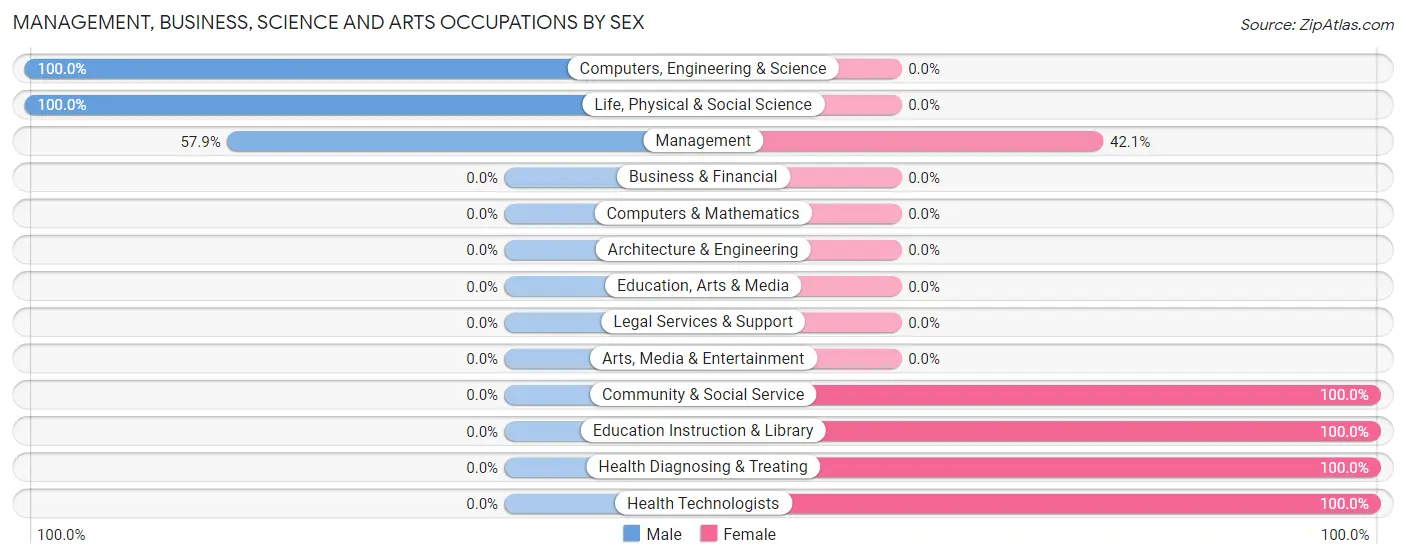
Management, Business, Science and Arts Occupations by Sex
Within the Management, Business, Science and Arts occupations in Riegelwood, the most male-oriented occupations are Computers, Engineering & Science (100.0%), Life, Physical & Social Science (100.0%), and Management (57.9%), while the most female-oriented occupations are Community & Social Service (100.0%), Education Instruction & Library (100.0%), and Health Diagnosing & Treating (100.0%).
| Occupation | Male | Female |
| Management | 33 (57.9%) | 24 (42.1%) |
| Business & Financial | 0 (0.0%) | 0 (0.0%) |
| Computers, Engineering & Science | 27 (100.0%) | 0 (0.0%) |
| Computers & Mathematics | 0 (0.0%) | 0 (0.0%) |
| Architecture & Engineering | 0 (0.0%) | 0 (0.0%) |
| Life, Physical & Social Science | 27 (100.0%) | 0 (0.0%) |
| Community & Social Service | 0 (0.0%) | 23 (100.0%) |
| Education, Arts & Media | 0 (0.0%) | 0 (0.0%) |
| Legal Services & Support | 0 (0.0%) | 0 (0.0%) |
| Education Instruction & Library | 0 (0.0%) | 23 (100.0%) |
| Arts, Media & Entertainment | 0 (0.0%) | 0 (0.0%) |
| Health Diagnosing & Treating | 0 (0.0%) | 12 (100.0%) |
| Health Technologists | 0 (0.0%) | 12 (100.0%) |
| Total (Category) | 60 (50.4%) | 59 (49.6%) |
| Total (Overall) | 179 (59.5%) | 122 (40.5%) |
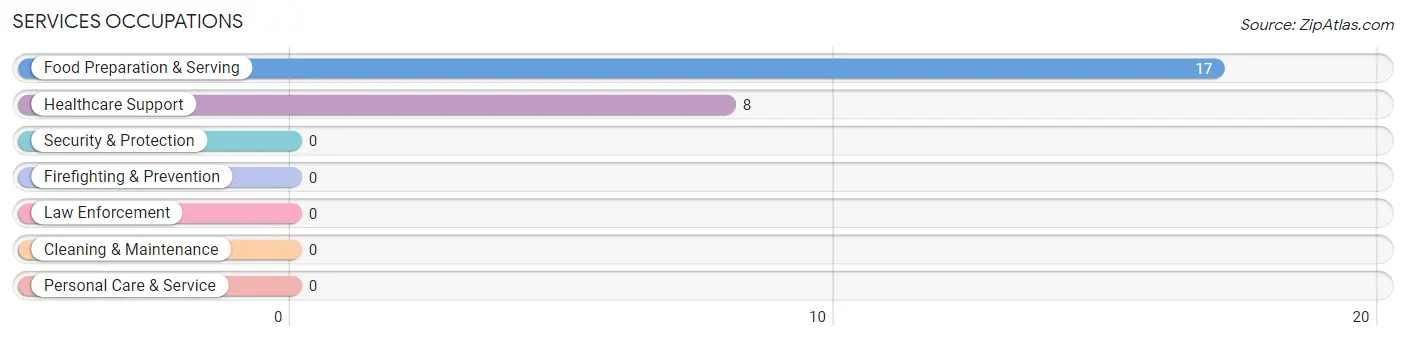
Services Occupations
The most common Services occupations in Riegelwood are Food Preparation & Serving (17 | 5.7%), and Healthcare Support (8 | 2.7%).
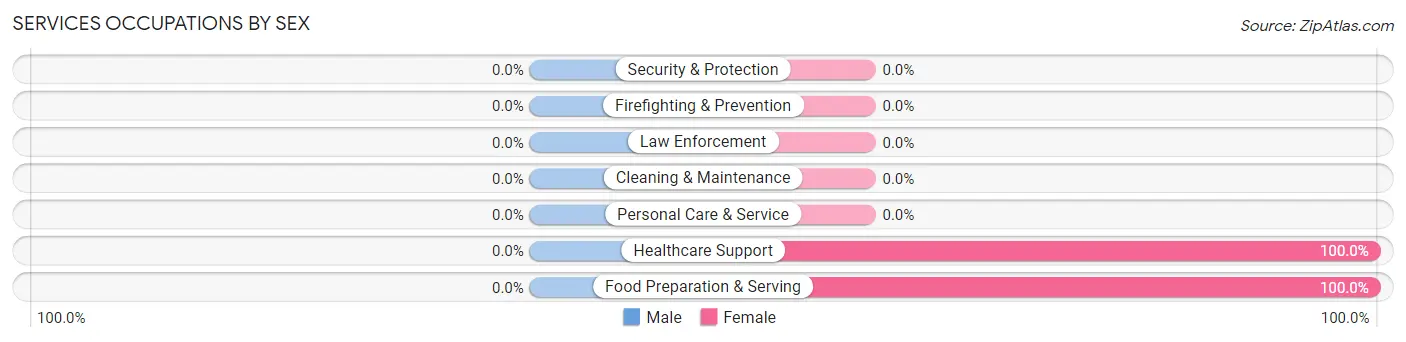
Services Occupations by Sex
| Occupation | Male | Female |
| Healthcare Support | 0 (0.0%) | 8 (100.0%) |
| Security & Protection | 0 (0.0%) | 0 (0.0%) |
| Firefighting & Prevention | 0 (0.0%) | 0 (0.0%) |
| Law Enforcement | 0 (0.0%) | 0 (0.0%) |
| Food Preparation & Serving | 0 (0.0%) | 17 (100.0%) |
| Cleaning & Maintenance | 0 (0.0%) | 0 (0.0%) |
| Personal Care & Service | 0 (0.0%) | 0 (0.0%) |
| Total (Category) | 0 (0.0%) | 25 (100.0%) |
| Total (Overall) | 179 (59.5%) | 122 (40.5%) |
Sales and Office Occupations
The most common Sales and Office occupations in Riegelwood are Office & Administration (38 | 12.6%), and Sales & Related (29 | 9.6%).
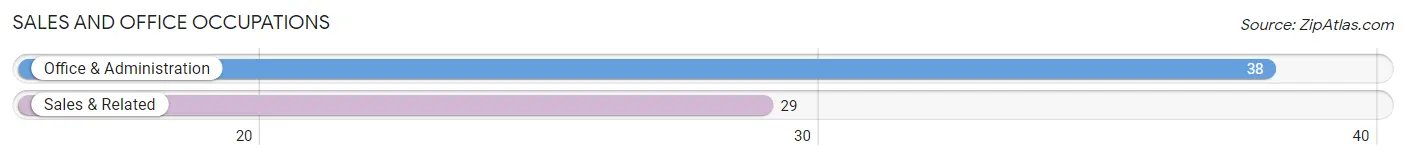
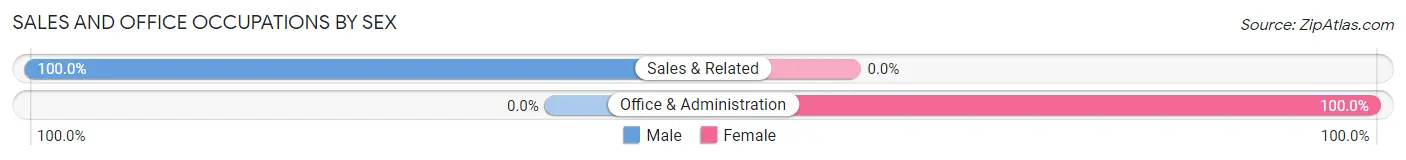
Sales and Office Occupations by Sex
| Occupation | Male | Female |
| Sales & Related | 29 (100.0%) | 0 (0.0%) |
| Office & Administration | 0 (0.0%) | 38 (100.0%) |
| Total (Category) | 29 (43.3%) | 38 (56.7%) |
| Total (Overall) | 179 (59.5%) | 122 (40.5%) |
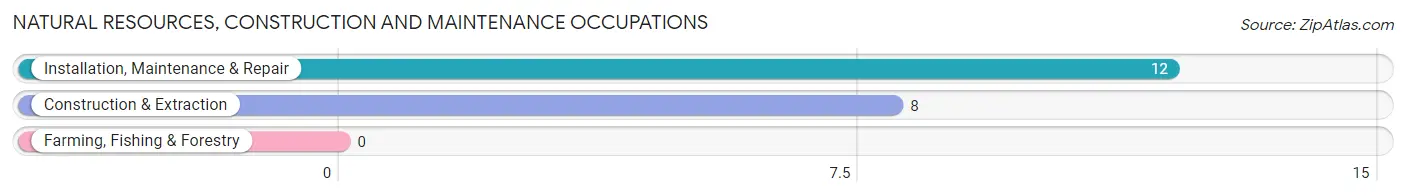
Natural Resources, Construction and Maintenance Occupations
The most common Natural Resources, Construction and Maintenance occupations in Riegelwood are Installation, Maintenance & Repair (12 | 4.0%), and Construction & Extraction (8 | 2.7%).
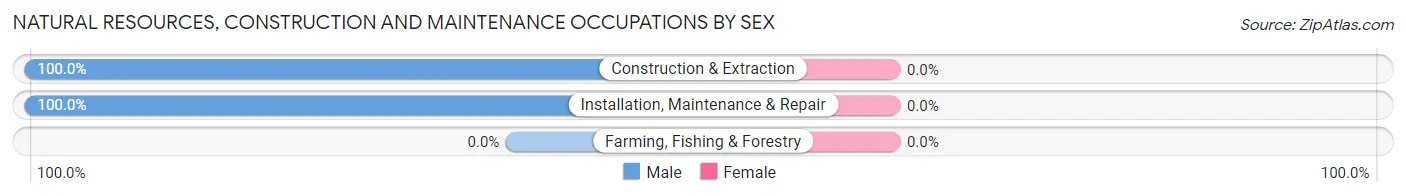
Natural Resources, Construction and Maintenance Occupations by Sex
| Occupation | Male | Female |
| Farming, Fishing & Forestry | 0 (0.0%) | 0 (0.0%) |
| Construction & Extraction | 8 (100.0%) | 0 (0.0%) |
| Installation, Maintenance & Repair | 12 (100.0%) | 0 (0.0%) |
| Total (Category) | 20 (100.0%) | 0 (0.0%) |
| Total (Overall) | 179 (59.5%) | 122 (40.5%) |
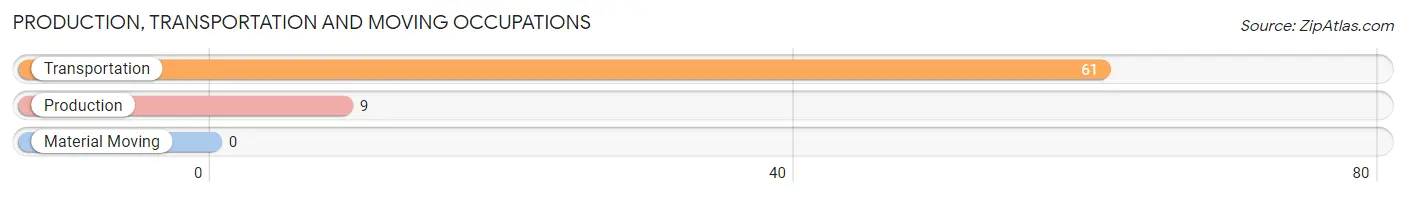
Production, Transportation and Moving Occupations
The most common Production, Transportation and Moving occupations in Riegelwood are Transportation (61 | 20.3%), and Production (9 | 3.0%).
Production, Transportation and Moving Occupations by Sex
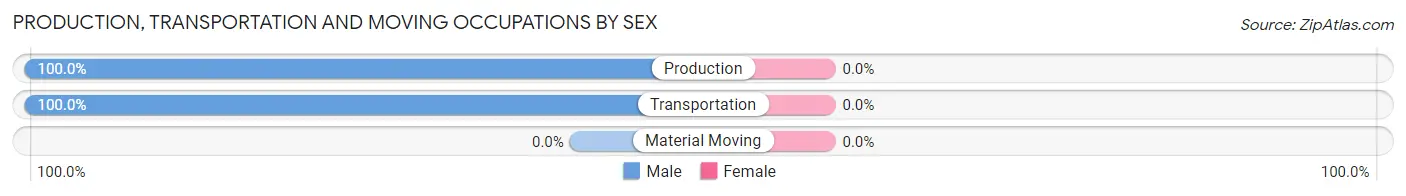
| Occupation | Male | Female |
| Production | 9 (100.0%) | 0 (0.0%) |
| Transportation | 61 (100.0%) | 0 (0.0%) |
| Material Moving | 0 (0.0%) | 0 (0.0%) |
| Total (Category) | 70 (100.0%) | 0 (0.0%) |
| Total (Overall) | 179 (59.5%) | 122 (40.5%) |
Employment Industries by Sex in Riegelwood
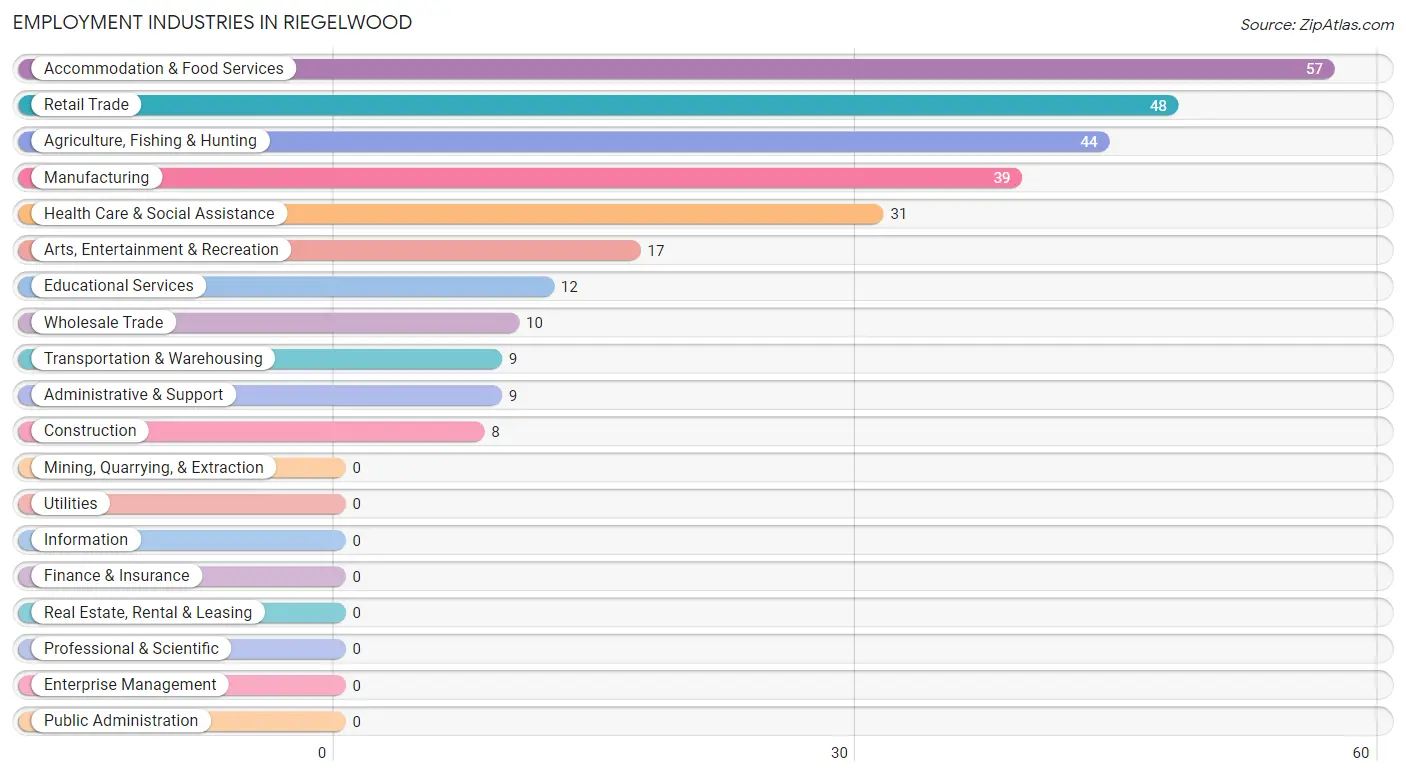
Employment Industries in Riegelwood
The major employment industries in Riegelwood include Accommodation & Food Services (57 | 18.9%), Retail Trade (48 | 16.0%), Agriculture, Fishing & Hunting (44 | 14.6%), Manufacturing (39 | 13.0%), and Health Care & Social Assistance (31 | 10.3%).
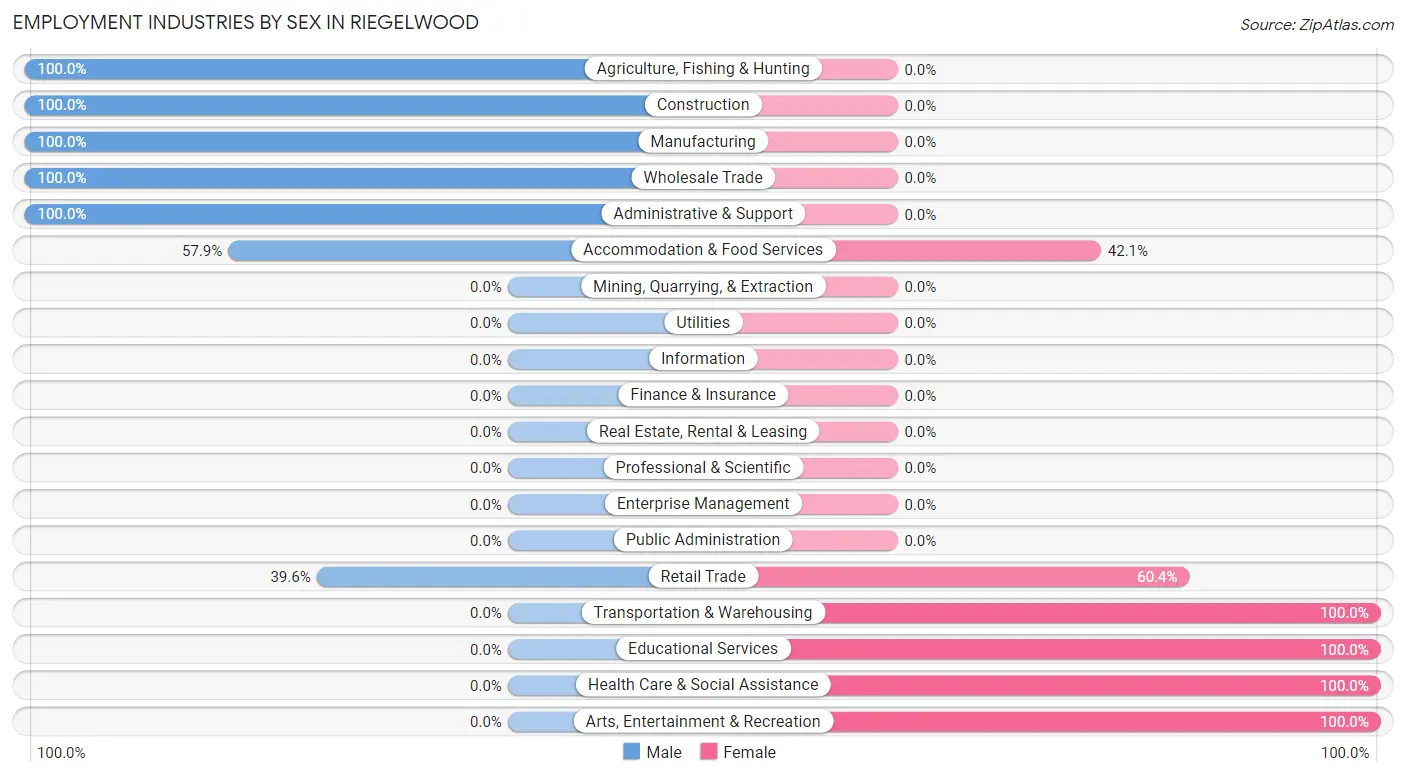
Employment Industries by Sex in Riegelwood
The Riegelwood industries that see more men than women are Agriculture, Fishing & Hunting (100.0%), Construction (100.0%), and Manufacturing (100.0%), whereas the industries that tend to have a higher number of women are Transportation & Warehousing (100.0%), Educational Services (100.0%), and Health Care & Social Assistance (100.0%).
| Industry | Male | Female |
| Agriculture, Fishing & Hunting | 44 (100.0%) | 0 (0.0%) |
| Mining, Quarrying, & Extraction | 0 (0.0%) | 0 (0.0%) |
| Construction | 8 (100.0%) | 0 (0.0%) |
| Manufacturing | 39 (100.0%) | 0 (0.0%) |
| Wholesale Trade | 10 (100.0%) | 0 (0.0%) |
| Retail Trade | 19 (39.6%) | 29 (60.4%) |
| Transportation & Warehousing | 0 (0.0%) | 9 (100.0%) |
| Utilities | 0 (0.0%) | 0 (0.0%) |
| Information | 0 (0.0%) | 0 (0.0%) |
| Finance & Insurance | 0 (0.0%) | 0 (0.0%) |
| Real Estate, Rental & Leasing | 0 (0.0%) | 0 (0.0%) |
| Professional & Scientific | 0 (0.0%) | 0 (0.0%) |
| Enterprise Management | 0 (0.0%) | 0 (0.0%) |
| Administrative & Support | 9 (100.0%) | 0 (0.0%) |
| Educational Services | 0 (0.0%) | 12 (100.0%) |
| Health Care & Social Assistance | 0 (0.0%) | 31 (100.0%) |
| Arts, Entertainment & Recreation | 0 (0.0%) | 17 (100.0%) |
| Accommodation & Food Services | 33 (57.9%) | 24 (42.1%) |
| Public Administration | 0 (0.0%) | 0 (0.0%) |
| Total | 179 (59.5%) | 122 (40.5%) |
Education in Riegelwood
School Enrollment in Riegelwood
The most common levels of schooling among the 128 students in Riegelwood are college / undergraduate (57 | 44.5%), elementary school (25 | 19.5%), and graduate / professional (24 | 18.8%).
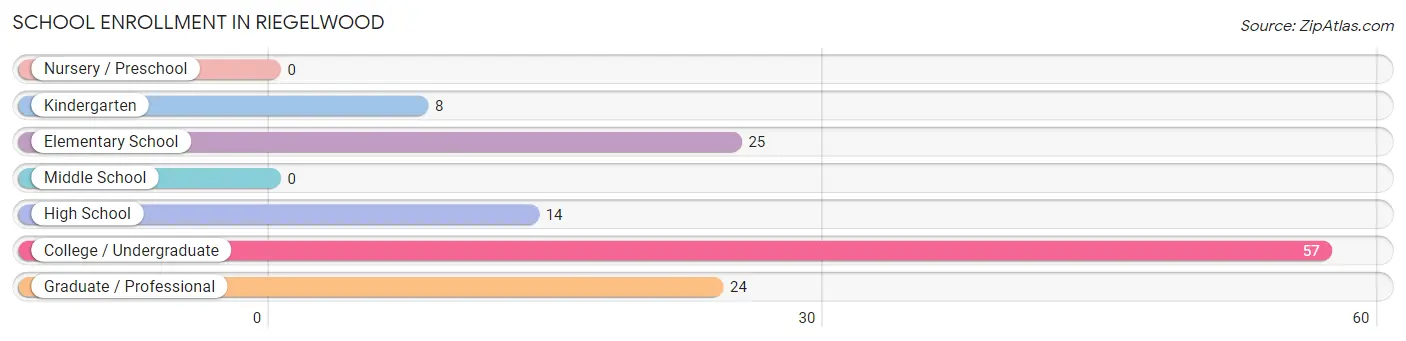
| School Level | # Students | % Students |
| Nursery / Preschool | 0 | 0.0% |
| Kindergarten | 8 | 6.2% |
| Elementary School | 25 | 19.5% |
| Middle School | 0 | 0.0% |
| High School | 14 | 10.9% |
| College / Undergraduate | 57 | 44.5% |
| Graduate / Professional | 24 | 18.8% |
| Total | 128 | 100.0% |
School Enrollment by Age by Funding Source in Riegelwood
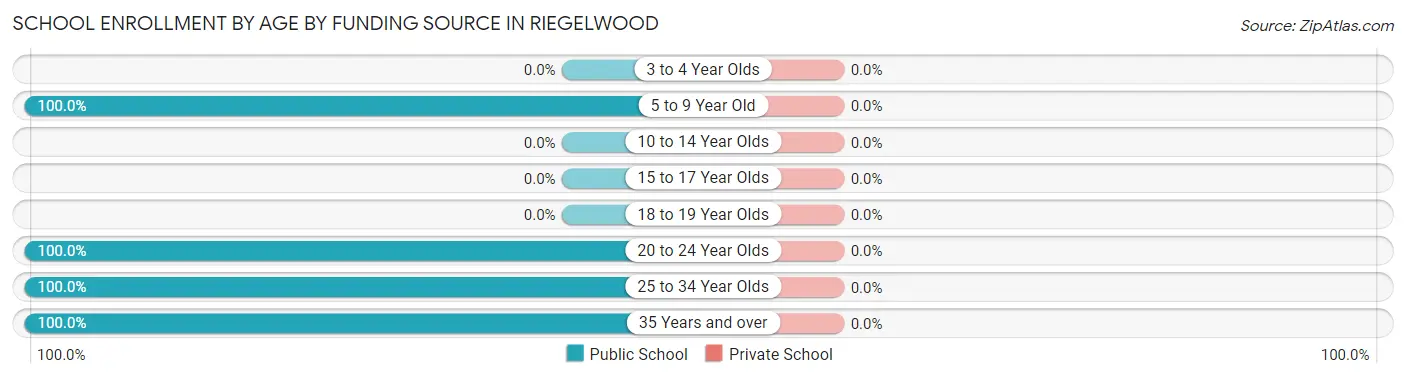
| Age Bracket | Public School | Private School |
| 3 to 4 Year Olds | 0 (0.0%) | 0 (0.0%) |
| 5 to 9 Year Old | 33 (100.0%) | 0 (0.0%) |
| 10 to 14 Year Olds | 0 (0.0%) | 0 (0.0%) |
| 15 to 17 Year Olds | 0 (0.0%) | 0 (0.0%) |
| 18 to 19 Year Olds | 0 (0.0%) | 0 (0.0%) |
| 20 to 24 Year Olds | 57 (100.0%) | 0 (0.0%) |
| 25 to 34 Year Olds | 12 (100.0%) | 0 (0.0%) |
| 35 Years and over | 26 (100.0%) | 0 (0.0%) |
| Total | 128 (100.0%) | 0 (0.0%) |
Educational Attainment by Field of Study in Riegelwood
Business (10 | 55.6%), and science & technology (8 | 44.4%) are the most common fields of study among 18 individuals in Riegelwood who have obtained a bachelor's degree or higher.
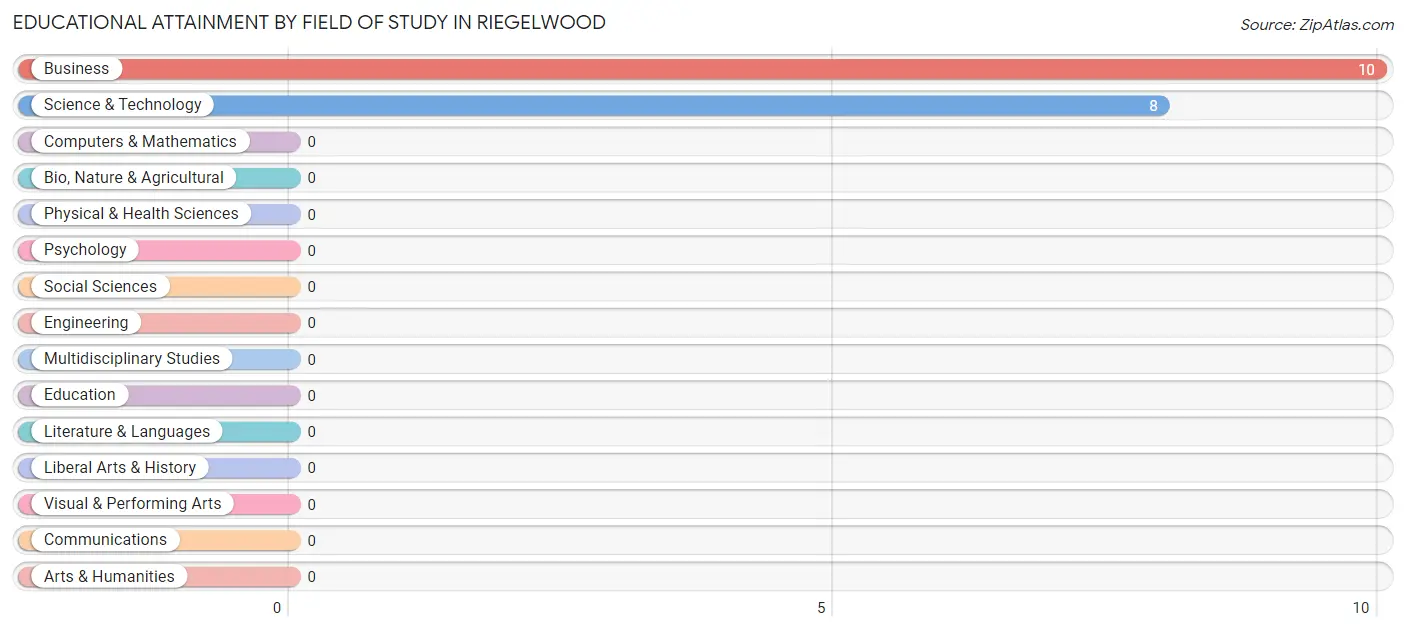
| Field of Study | # Graduates | % Graduates |
| Computers & Mathematics | 0 | 0.0% |
| Bio, Nature & Agricultural | 0 | 0.0% |
| Physical & Health Sciences | 0 | 0.0% |
| Psychology | 0 | 0.0% |
| Social Sciences | 0 | 0.0% |
| Engineering | 0 | 0.0% |
| Multidisciplinary Studies | 0 | 0.0% |
| Science & Technology | 8 | 44.4% |
| Business | 10 | 55.6% |
| Education | 0 | 0.0% |
| Literature & Languages | 0 | 0.0% |
| Liberal Arts & History | 0 | 0.0% |
| Visual & Performing Arts | 0 | 0.0% |
| Communications | 0 | 0.0% |
| Arts & Humanities | 0 | 0.0% |
| Total | 18 | 100.0% |
Transportation & Commute in Riegelwood
Vehicle Availability by Sex in Riegelwood
The most prevalent vehicle ownership categories in Riegelwood are males with 3 vehicles (64, accounting for 35.7%) and females with 3 vehicles (37, making up 52.5%).
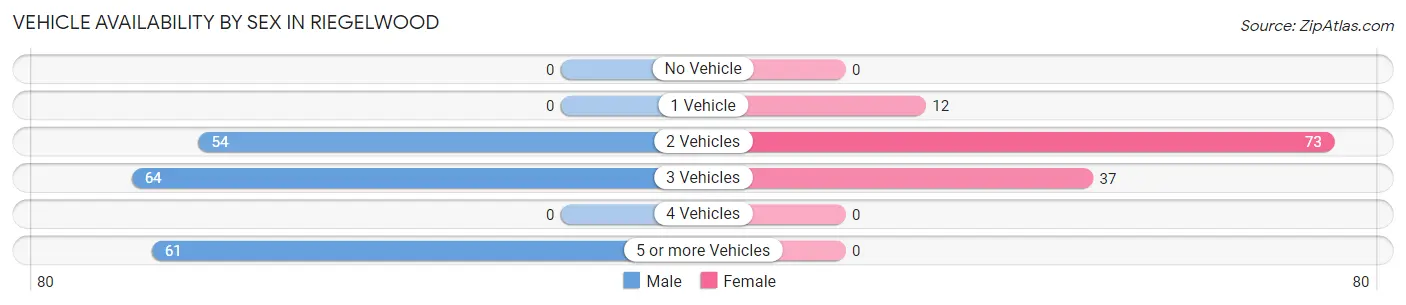
| Vehicles Available | Male | Female |
| No Vehicle | 0 (0.0%) | 0 (0.0%) |
| 1 Vehicle | 0 (0.0%) | 12 (9.8%) |
| 2 Vehicles | 54 (30.2%) | 73 (59.8%) |
| 3 Vehicles | 64 (35.7%) | 37 (30.3%) |
| 4 Vehicles | 0 (0.0%) | 0 (0.0%) |
| 5 or more Vehicles | 61 (34.1%) | 0 (0.0%) |
| Total | 179 (100.0%) | 122 (100.0%) |
Commute Time in Riegelwood
The most frequently occuring commute durations in Riegelwood are 5 to 9 minutes (88 commuters, 32.0%), less than 5 minutes (45 commuters, 16.4%), and 30 to 34 minutes (40 commuters, 14.5%).
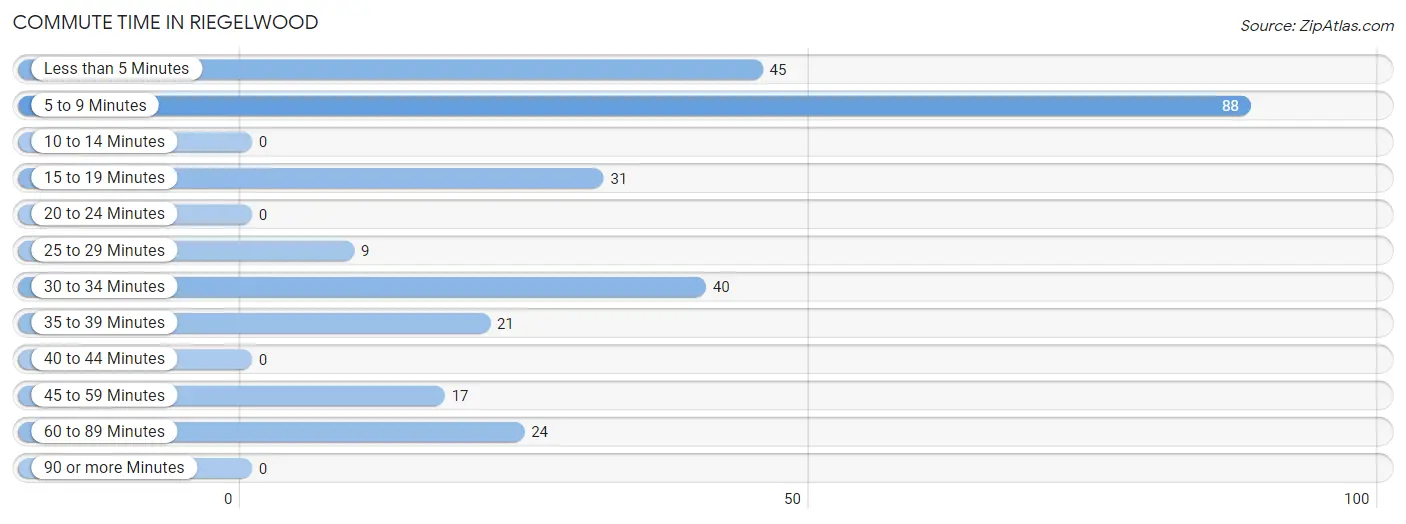
| Commute Time | # Commuters | % Commuters |
| Less than 5 Minutes | 45 | 16.4% |
| 5 to 9 Minutes | 88 | 32.0% |
| 10 to 14 Minutes | 0 | 0.0% |
| 15 to 19 Minutes | 31 | 11.3% |
| 20 to 24 Minutes | 0 | 0.0% |
| 25 to 29 Minutes | 9 | 3.3% |
| 30 to 34 Minutes | 40 | 14.5% |
| 35 to 39 Minutes | 21 | 7.6% |
| 40 to 44 Minutes | 0 | 0.0% |
| 45 to 59 Minutes | 17 | 6.2% |
| 60 to 89 Minutes | 24 | 8.7% |
| 90 or more Minutes | 0 | 0.0% |
Commute Time by Sex in Riegelwood
The most common commute times in Riegelwood are 5 to 9 minutes (88 commuters, 54.7%) for males and 30 to 34 minutes (40 commuters, 35.1%) for females.
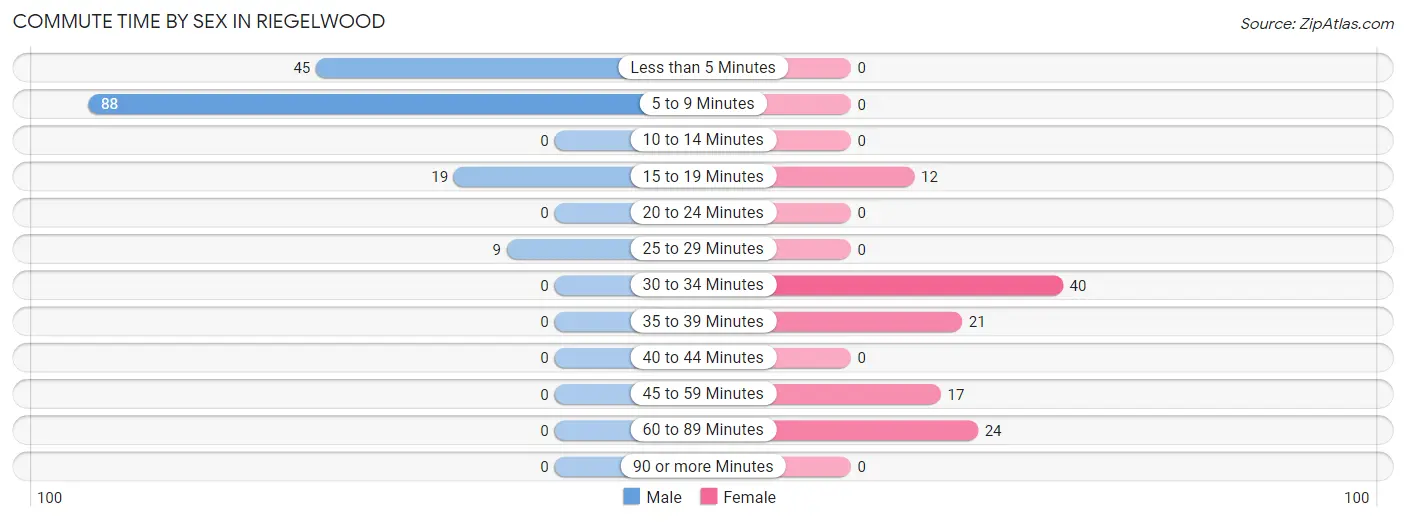
| Commute Time | Male | Female |
| Less than 5 Minutes | 45 (28.0%) | 0 (0.0%) |
| 5 to 9 Minutes | 88 (54.7%) | 0 (0.0%) |
| 10 to 14 Minutes | 0 (0.0%) | 0 (0.0%) |
| 15 to 19 Minutes | 19 (11.8%) | 12 (10.5%) |
| 20 to 24 Minutes | 0 (0.0%) | 0 (0.0%) |
| 25 to 29 Minutes | 9 (5.6%) | 0 (0.0%) |
| 30 to 34 Minutes | 0 (0.0%) | 40 (35.1%) |
| 35 to 39 Minutes | 0 (0.0%) | 21 (18.4%) |
| 40 to 44 Minutes | 0 (0.0%) | 0 (0.0%) |
| 45 to 59 Minutes | 0 (0.0%) | 17 (14.9%) |
| 60 to 89 Minutes | 0 (0.0%) | 24 (21.0%) |
| 90 or more Minutes | 0 (0.0%) | 0 (0.0%) |
Time of Departure to Work by Sex in Riegelwood
The most frequent times of departure to work in Riegelwood are 6:30 AM to 6:59 AM (56, 34.8%) for males and 8:00 AM to 8:29 AM (76, 66.7%) for females.
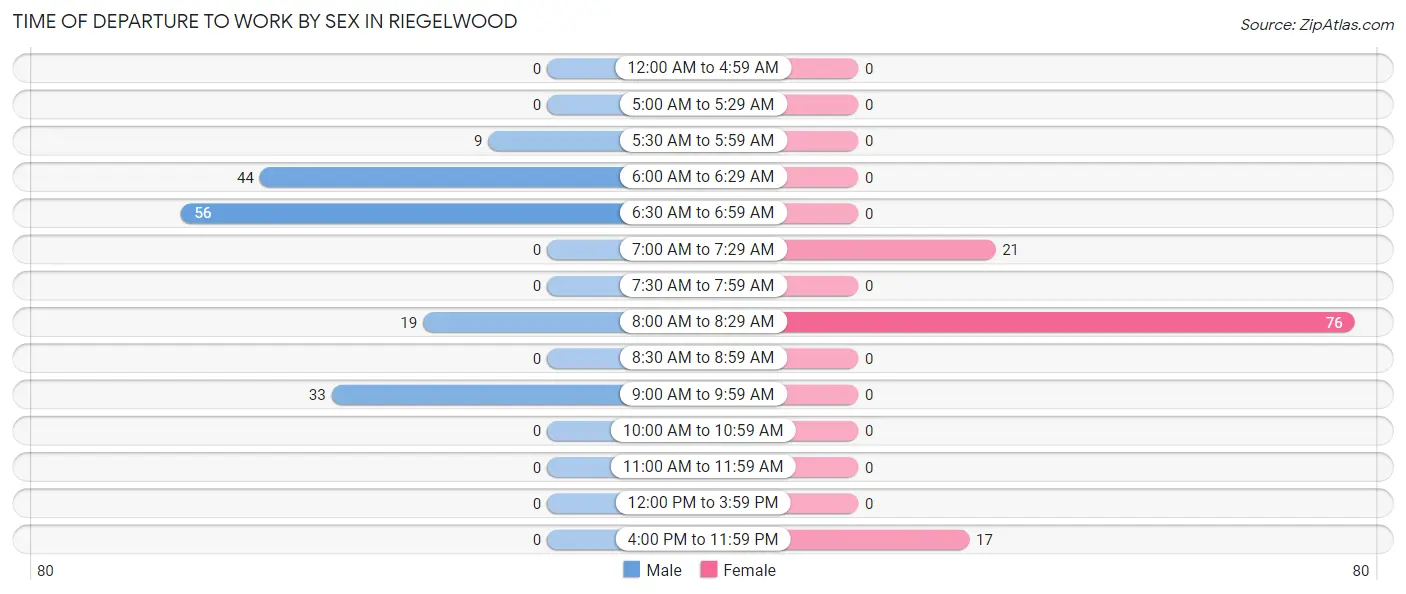
| Time of Departure | Male | Female |
| 12:00 AM to 4:59 AM | 0 (0.0%) | 0 (0.0%) |
| 5:00 AM to 5:29 AM | 0 (0.0%) | 0 (0.0%) |
| 5:30 AM to 5:59 AM | 9 (5.6%) | 0 (0.0%) |
| 6:00 AM to 6:29 AM | 44 (27.3%) | 0 (0.0%) |
| 6:30 AM to 6:59 AM | 56 (34.8%) | 0 (0.0%) |
| 7:00 AM to 7:29 AM | 0 (0.0%) | 21 (18.4%) |
| 7:30 AM to 7:59 AM | 0 (0.0%) | 0 (0.0%) |
| 8:00 AM to 8:29 AM | 19 (11.8%) | 76 (66.7%) |
| 8:30 AM to 8:59 AM | 0 (0.0%) | 0 (0.0%) |
| 9:00 AM to 9:59 AM | 33 (20.5%) | 0 (0.0%) |
| 10:00 AM to 10:59 AM | 0 (0.0%) | 0 (0.0%) |
| 11:00 AM to 11:59 AM | 0 (0.0%) | 0 (0.0%) |
| 12:00 PM to 3:59 PM | 0 (0.0%) | 0 (0.0%) |
| 4:00 PM to 11:59 PM | 0 (0.0%) | 17 (14.9%) |
| Total | 161 (100.0%) | 114 (100.0%) |
Housing Occupancy in Riegelwood
Occupancy by Ownership in Riegelwood
Of the total 256 dwellings in Riegelwood, owner-occupied units account for 200 (78.1%), while renter-occupied units make up 56 (21.9%).
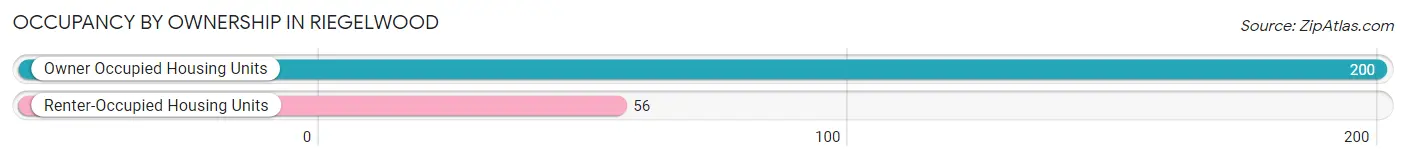
| Occupancy | # Housing Units | % Housing Units |
| Owner Occupied Housing Units | 200 | 78.1% |
| Renter-Occupied Housing Units | 56 | 21.9% |
| Total Occupied Housing Units | 256 | 100.0% |
Occupancy by Household Size in Riegelwood
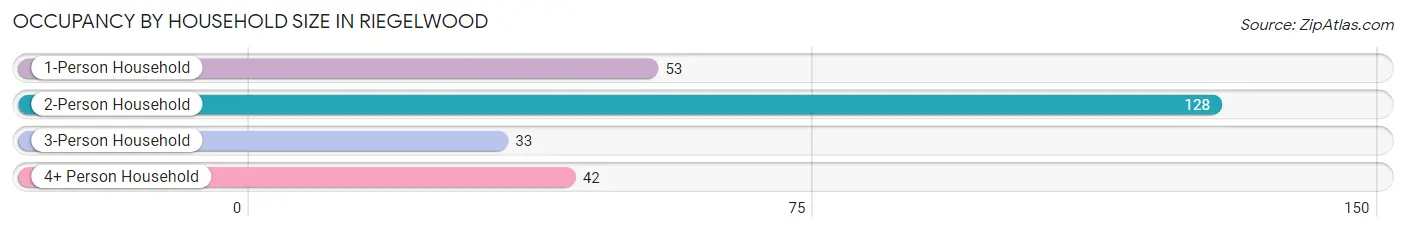
| Household Size | # Housing Units | % Housing Units |
| 1-Person Household | 53 | 20.7% |
| 2-Person Household | 128 | 50.0% |
| 3-Person Household | 33 | 12.9% |
| 4+ Person Household | 42 | 16.4% |
| Total Housing Units | 256 | 100.0% |
Occupancy by Ownership by Household Size in Riegelwood
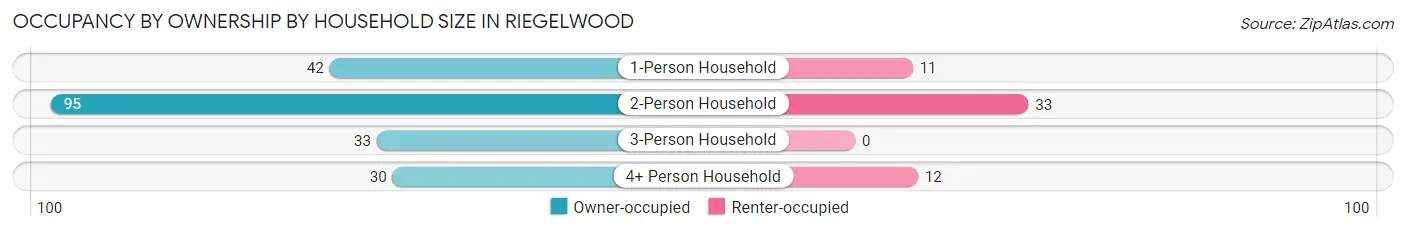
| Household Size | Owner-occupied | Renter-occupied |
| 1-Person Household | 42 (79.2%) | 11 (20.7%) |
| 2-Person Household | 95 (74.2%) | 33 (25.8%) |
| 3-Person Household | 33 (100.0%) | 0 (0.0%) |
| 4+ Person Household | 30 (71.4%) | 12 (28.6%) |
| Total Housing Units | 200 (78.1%) | 56 (21.9%) |
Occupancy by Educational Attainment in Riegelwood
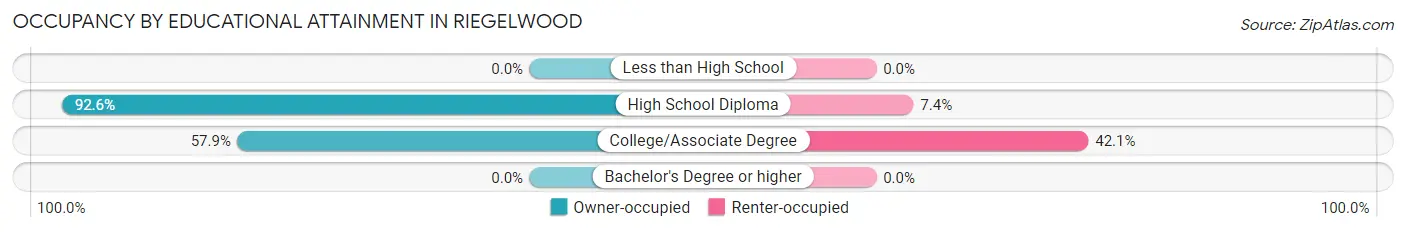
| Household Size | Owner-occupied | Renter-occupied |
| Less than High School | 0 (0.0%) | 0 (0.0%) |
| High School Diploma | 138 (92.6%) | 11 (7.4%) |
| College/Associate Degree | 62 (57.9%) | 45 (42.1%) |
| Bachelor's Degree or higher | 0 (0.0%) | 0 (0.0%) |
Occupancy by Age of Householder in Riegelwood
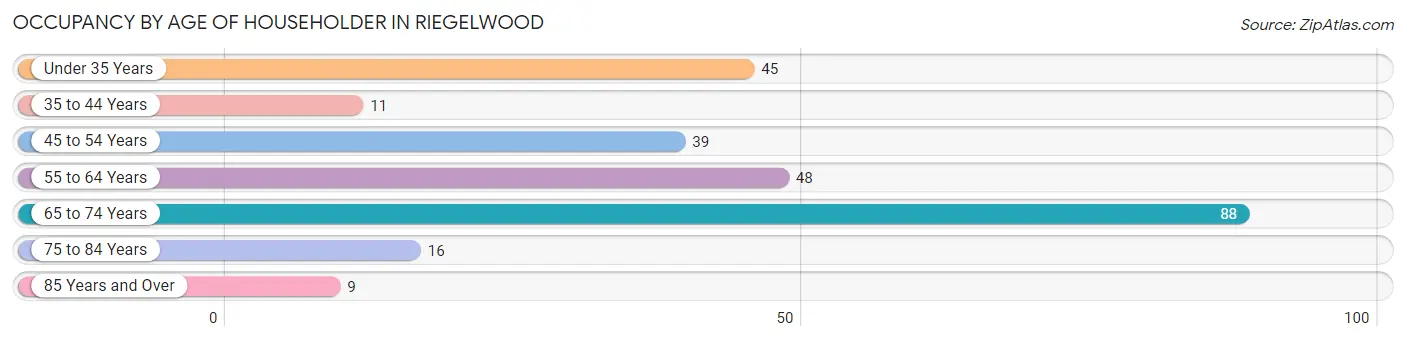
| Age Bracket | # Households | % Households |
| Under 35 Years | 45 | 17.6% |
| 35 to 44 Years | 11 | 4.3% |
| 45 to 54 Years | 39 | 15.2% |
| 55 to 64 Years | 48 | 18.8% |
| 65 to 74 Years | 88 | 34.4% |
| 75 to 84 Years | 16 | 6.2% |
| 85 Years and Over | 9 | 3.5% |
| Total | 256 | 100.0% |
Housing Finances in Riegelwood
Median Income by Occupancy in Riegelwood
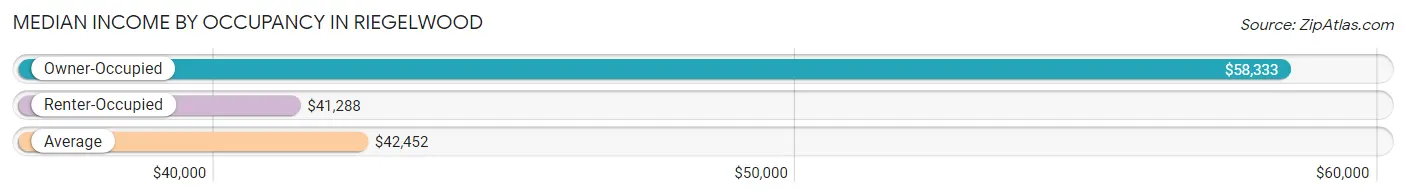
| Occupancy Type | # Households | Median Income |
| Owner-Occupied | 200 (78.1%) | $58,333 |
| Renter-Occupied | 56 (21.9%) | $41,288 |
| Average | 256 (100.0%) | $42,452 |
Occupancy by Householder Income Bracket in Riegelwood
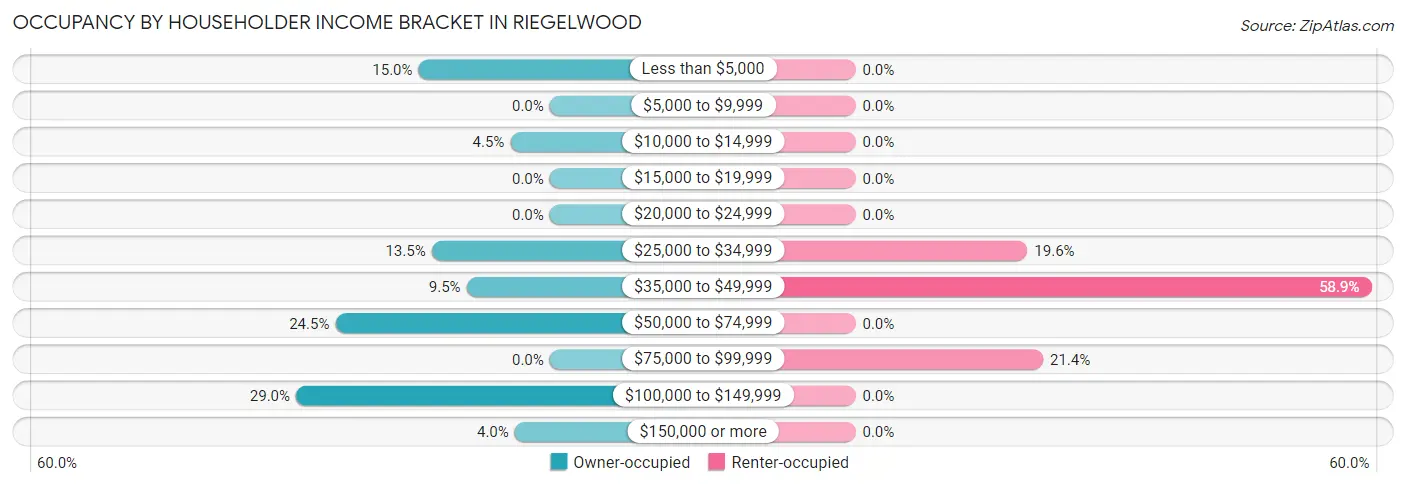
| Income Bracket | Owner-occupied | Renter-occupied |
| Less than $5,000 | 30 (15.0%) | 0 (0.0%) |
| $5,000 to $9,999 | 0 (0.0%) | 0 (0.0%) |
| $10,000 to $14,999 | 9 (4.5%) | 0 (0.0%) |
| $15,000 to $19,999 | 0 (0.0%) | 0 (0.0%) |
| $20,000 to $24,999 | 0 (0.0%) | 0 (0.0%) |
| $25,000 to $34,999 | 27 (13.5%) | 11 (19.6%) |
| $35,000 to $49,999 | 19 (9.5%) | 33 (58.9%) |
| $50,000 to $74,999 | 49 (24.5%) | 0 (0.0%) |
| $75,000 to $99,999 | 0 (0.0%) | 12 (21.4%) |
| $100,000 to $149,999 | 58 (29.0%) | 0 (0.0%) |
| $150,000 or more | 8 (4.0%) | 0 (0.0%) |
| Total | 200 (100.0%) | 56 (100.0%) |
Monthly Housing Cost Tiers in Riegelwood
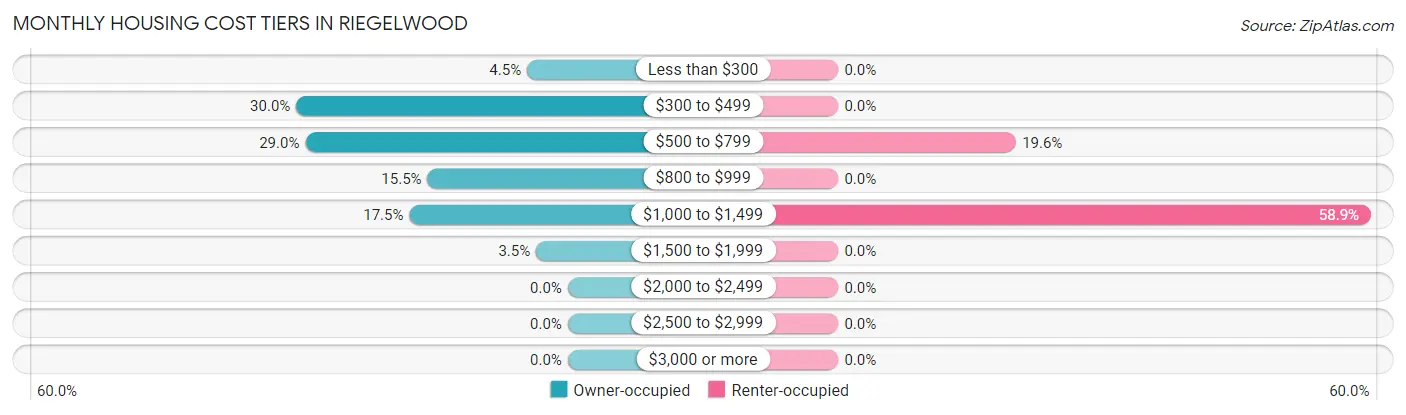
| Monthly Cost | Owner-occupied | Renter-occupied |
| Less than $300 | 9 (4.5%) | 0 (0.0%) |
| $300 to $499 | 60 (30.0%) | 0 (0.0%) |
| $500 to $799 | 58 (29.0%) | 11 (19.6%) |
| $800 to $999 | 31 (15.5%) | 0 (0.0%) |
| $1,000 to $1,499 | 35 (17.5%) | 33 (58.9%) |
| $1,500 to $1,999 | 7 (3.5%) | 0 (0.0%) |
| $2,000 to $2,499 | 0 (0.0%) | 0 (0.0%) |
| $2,500 to $2,999 | 0 (0.0%) | 0 (0.0%) |
| $3,000 or more | 0 (0.0%) | 0 (0.0%) |
| Total | 200 (100.0%) | 56 (100.0%) |
Physical Housing Characteristics in Riegelwood
Housing Structures in Riegelwood
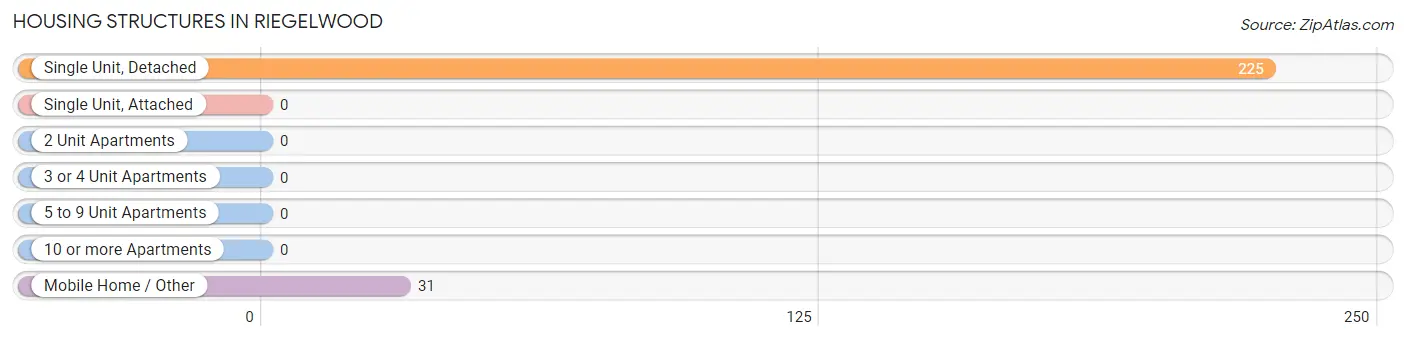
| Structure Type | # Housing Units | % Housing Units |
| Single Unit, Detached | 225 | 87.9% |
| Single Unit, Attached | 0 | 0.0% |
| 2 Unit Apartments | 0 | 0.0% |
| 3 or 4 Unit Apartments | 0 | 0.0% |
| 5 to 9 Unit Apartments | 0 | 0.0% |
| 10 or more Apartments | 0 | 0.0% |
| Mobile Home / Other | 31 | 12.1% |
| Total | 256 | 100.0% |
Housing Structures by Occupancy in Riegelwood
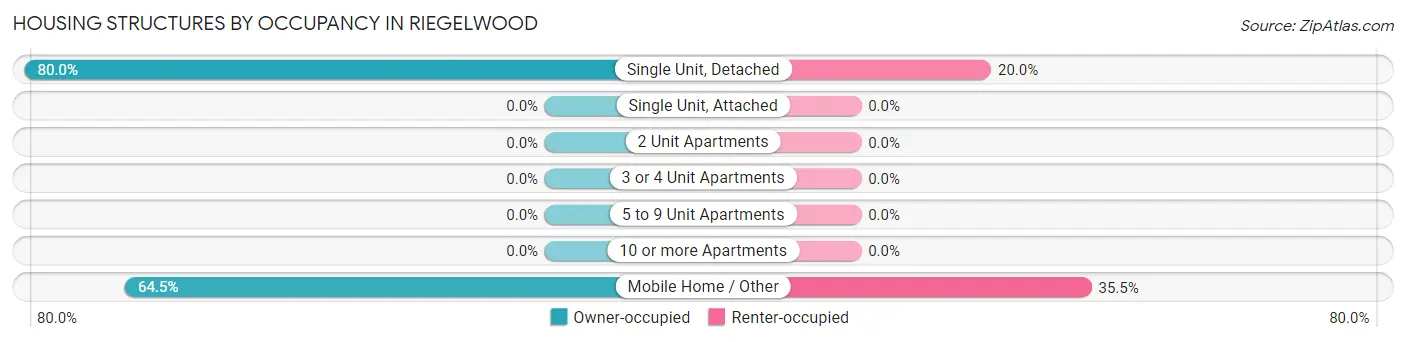
| Structure Type | Owner-occupied | Renter-occupied |
| Single Unit, Detached | 180 (80.0%) | 45 (20.0%) |
| Single Unit, Attached | 0 (0.0%) | 0 (0.0%) |
| 2 Unit Apartments | 0 (0.0%) | 0 (0.0%) |
| 3 or 4 Unit Apartments | 0 (0.0%) | 0 (0.0%) |
| 5 to 9 Unit Apartments | 0 (0.0%) | 0 (0.0%) |
| 10 or more Apartments | 0 (0.0%) | 0 (0.0%) |
| Mobile Home / Other | 20 (64.5%) | 11 (35.5%) |
| Total | 200 (78.1%) | 56 (21.9%) |
Housing Structures by Number of Rooms in Riegelwood
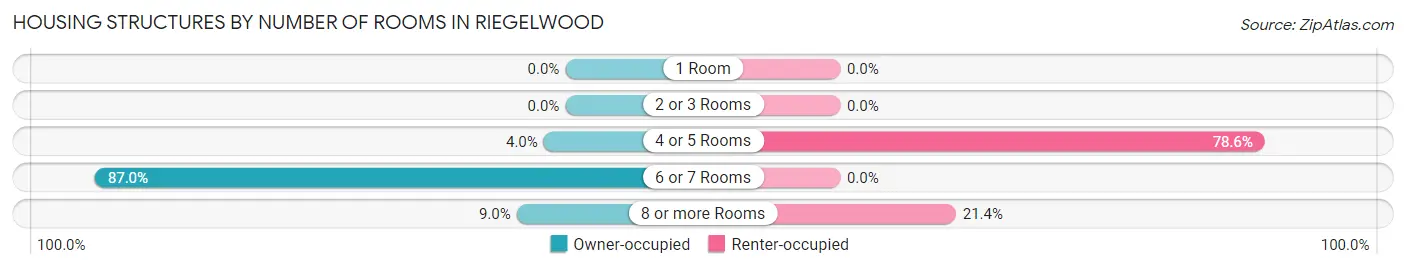
| Number of Rooms | Owner-occupied | Renter-occupied |
| 1 Room | 0 (0.0%) | 0 (0.0%) |
| 2 or 3 Rooms | 0 (0.0%) | 0 (0.0%) |
| 4 or 5 Rooms | 8 (4.0%) | 44 (78.6%) |
| 6 or 7 Rooms | 174 (87.0%) | 0 (0.0%) |
| 8 or more Rooms | 18 (9.0%) | 12 (21.4%) |
| Total | 200 (100.0%) | 56 (100.0%) |
Housing Structure by Heating Type in Riegelwood
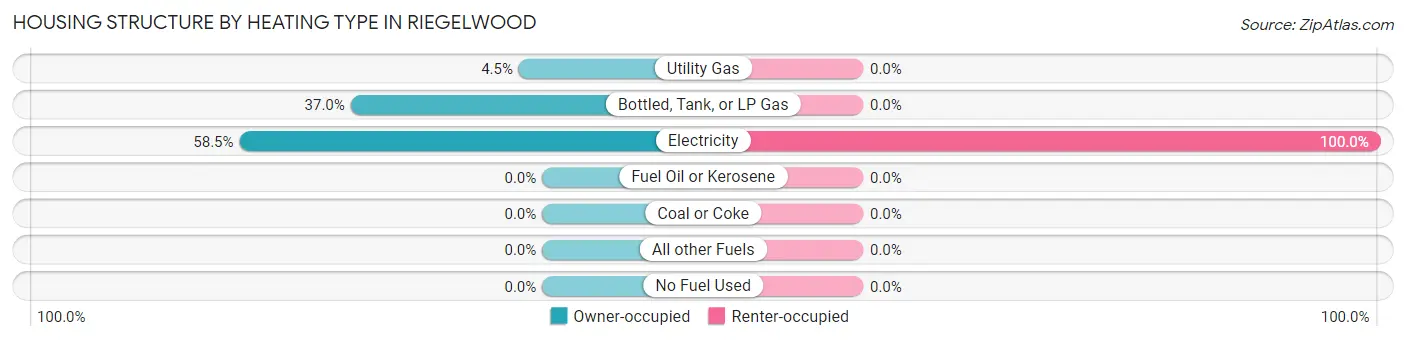
| Heating Type | Owner-occupied | Renter-occupied |
| Utility Gas | 9 (4.5%) | 0 (0.0%) |
| Bottled, Tank, or LP Gas | 74 (37.0%) | 0 (0.0%) |
| Electricity | 117 (58.5%) | 56 (100.0%) |
| Fuel Oil or Kerosene | 0 (0.0%) | 0 (0.0%) |
| Coal or Coke | 0 (0.0%) | 0 (0.0%) |
| All other Fuels | 0 (0.0%) | 0 (0.0%) |
| No Fuel Used | 0 (0.0%) | 0 (0.0%) |
| Total | 200 (100.0%) | 56 (100.0%) |
Household Vehicle Usage in Riegelwood
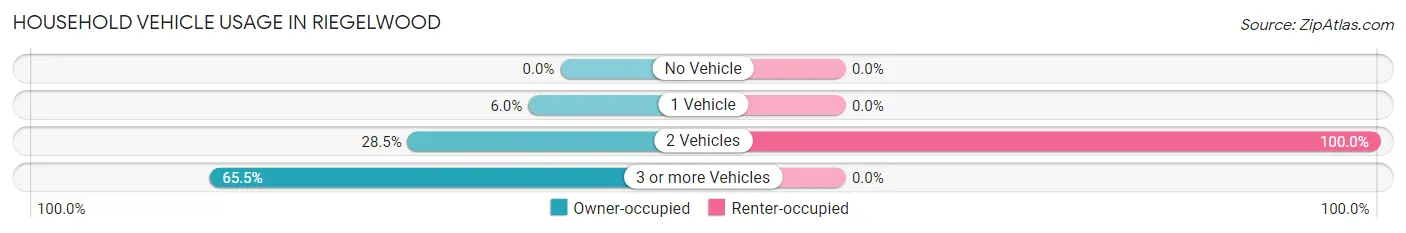
| Vehicles per Household | Owner-occupied | Renter-occupied |
| No Vehicle | 0 (0.0%) | 0 (0.0%) |
| 1 Vehicle | 12 (6.0%) | 0 (0.0%) |
| 2 Vehicles | 57 (28.5%) | 56 (100.0%) |
| 3 or more Vehicles | 131 (65.5%) | 0 (0.0%) |
| Total | 200 (100.0%) | 56 (100.0%) |
Real Estate & Mortgages in Riegelwood
Real Estate and Mortgage Overview in Riegelwood
| Characteristic | Without Mortgage | With Mortgage |
| Housing Units | 127 | 73 |
| Median Property Value | $208,100 | $183,900 |
| Median Household Income | - | - |
| Monthly Housing Costs | $431 | $0 |
| Real Estate Taxes | $1,622 | $0 |
Property Value by Mortgage Status in Riegelwood
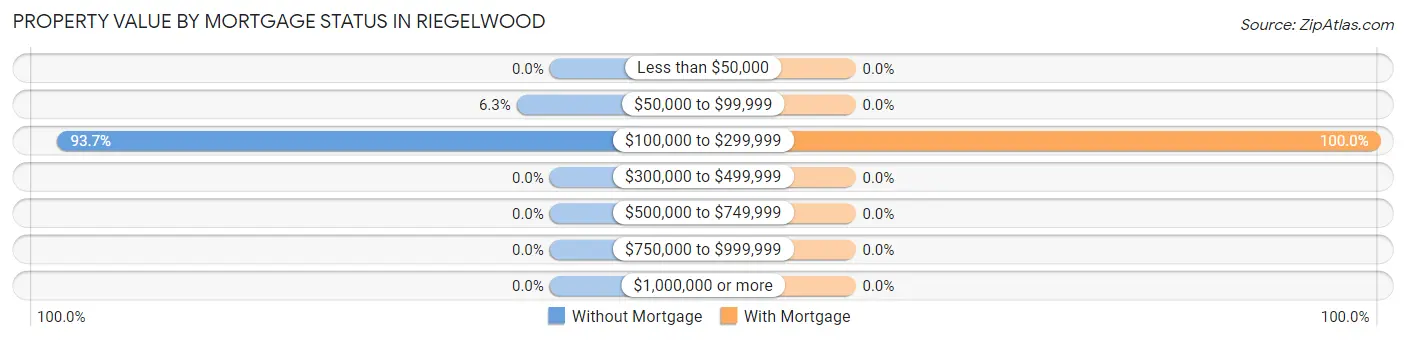
| Property Value | Without Mortgage | With Mortgage |
| Less than $50,000 | 0 (0.0%) | 0 (0.0%) |
| $50,000 to $99,999 | 8 (6.3%) | 0 (0.0%) |
| $100,000 to $299,999 | 119 (93.7%) | 73 (100.0%) |
| $300,000 to $499,999 | 0 (0.0%) | 0 (0.0%) |
| $500,000 to $749,999 | 0 (0.0%) | 0 (0.0%) |
| $750,000 to $999,999 | 0 (0.0%) | 0 (0.0%) |
| $1,000,000 or more | 0 (0.0%) | 0 (0.0%) |
| Total | 127 (100.0%) | 73 (100.0%) |
Household Income by Mortgage Status in Riegelwood
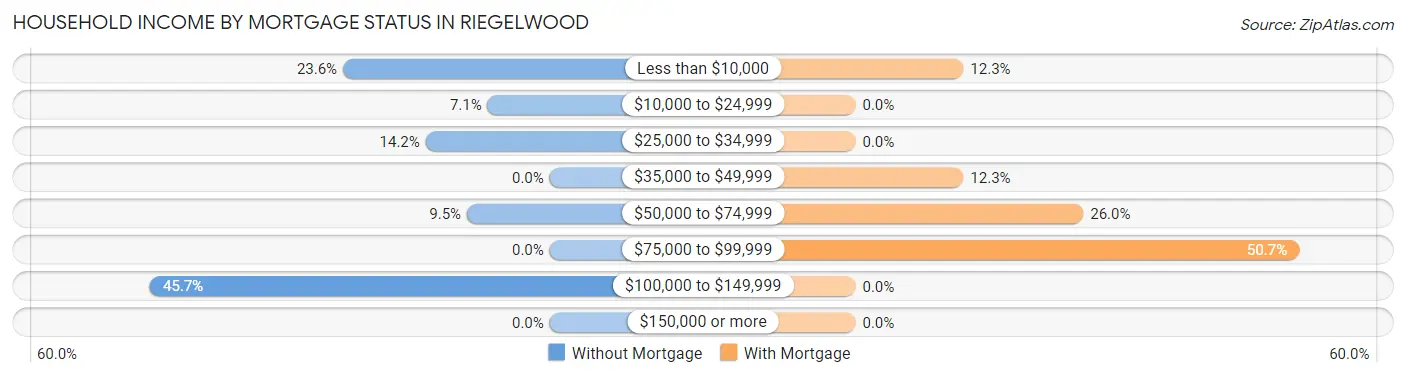
| Household Income | Without Mortgage | With Mortgage |
| Less than $10,000 | 30 (23.6%) | 9 (12.3%) |
| $10,000 to $24,999 | 9 (7.1%) | 0 (0.0%) |
| $25,000 to $34,999 | 18 (14.2%) | 0 (0.0%) |
| $35,000 to $49,999 | 0 (0.0%) | 9 (12.3%) |
| $50,000 to $74,999 | 12 (9.5%) | 19 (26.0%) |
| $75,000 to $99,999 | 0 (0.0%) | 37 (50.7%) |
| $100,000 to $149,999 | 58 (45.7%) | 0 (0.0%) |
| $150,000 or more | 0 (0.0%) | 0 (0.0%) |
| Total | 127 (100.0%) | 73 (100.0%) |
Property Value to Household Income Ratio in Riegelwood
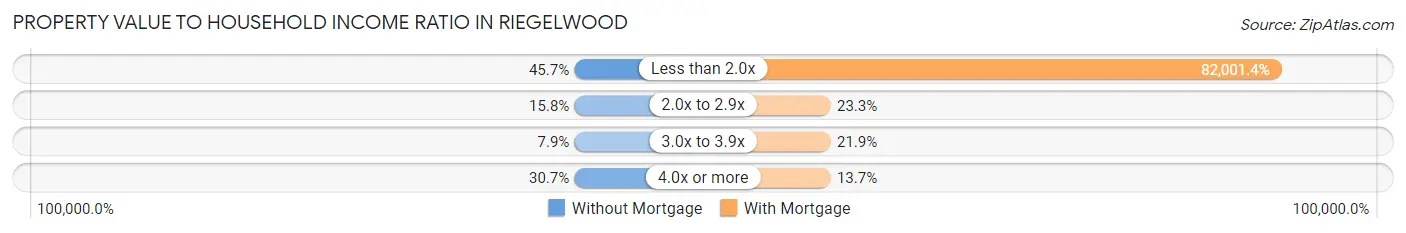
| Value-to-Income Ratio | Without Mortgage | With Mortgage |
| Less than 2.0x | 58 (45.7%) | 59,861 (82,001.4%) |
| 2.0x to 2.9x | 20 (15.8%) | 17 (23.3%) |
| 3.0x to 3.9x | 10 (7.9%) | 16 (21.9%) |
| 4.0x or more | 39 (30.7%) | 10 (13.7%) |
| Total | 127 (100.0%) | 73 (100.0%) |
Real Estate Taxes by Mortgage Status in Riegelwood
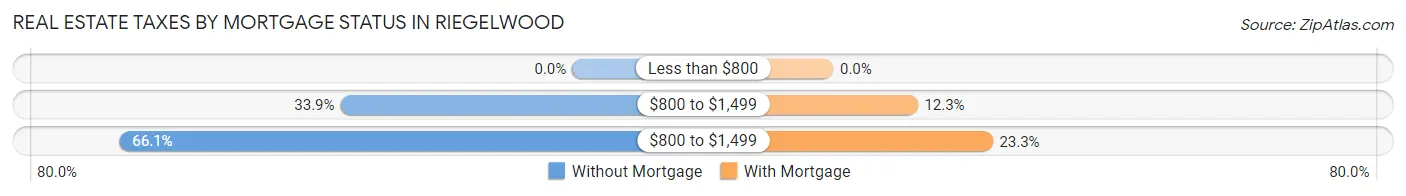
| Property Taxes | Without Mortgage | With Mortgage |
| Less than $800 | 0 (0.0%) | 0 (0.0%) |
| $800 to $1,499 | 43 (33.9%) | 9 (12.3%) |
| $800 to $1,499 | 84 (66.1%) | 17 (23.3%) |
| Total | 127 (100.0%) | 73 (100.0%) |
Health & Disability in Riegelwood
Health Insurance Coverage by Age in Riegelwood
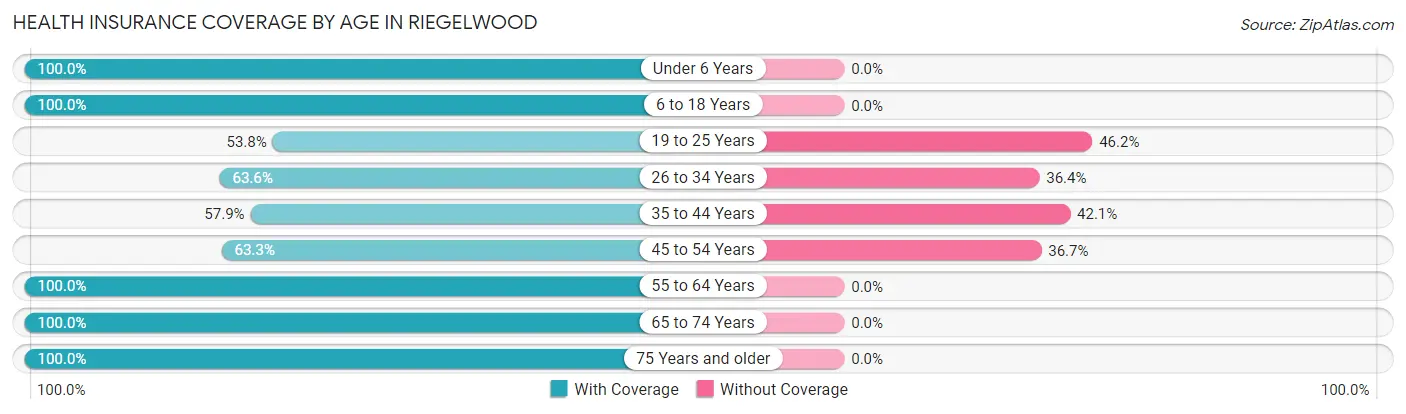
| Age Bracket | With Coverage | Without Coverage |
| Under 6 Years | 32 (100.0%) | 0 (0.0%) |
| 6 to 18 Years | 25 (100.0%) | 0 (0.0%) |
| 19 to 25 Years | 50 (53.8%) | 43 (46.2%) |
| 26 to 34 Years | 77 (63.6%) | 44 (36.4%) |
| 35 to 44 Years | 11 (57.9%) | 8 (42.1%) |
| 45 to 54 Years | 31 (63.3%) | 18 (36.7%) |
| 55 to 64 Years | 180 (100.0%) | 0 (0.0%) |
| 65 to 74 Years | 114 (100.0%) | 0 (0.0%) |
| 75 Years and older | 25 (100.0%) | 0 (0.0%) |
| Total | 545 (82.8%) | 113 (17.2%) |
Health Insurance Coverage by Citizenship Status in Riegelwood
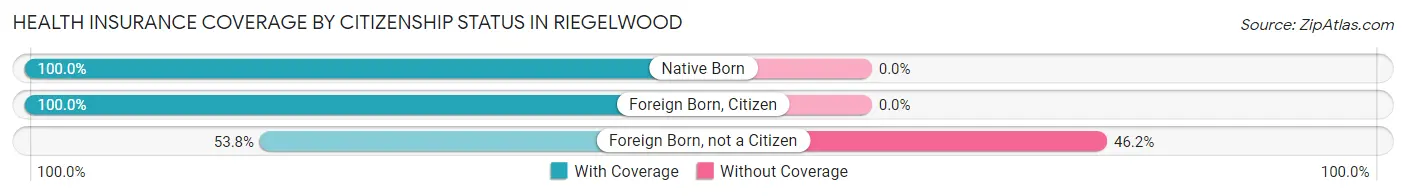
| Citizenship Status | With Coverage | Without Coverage |
| Native Born | 32 (100.0%) | 0 (0.0%) |
| Foreign Born, Citizen | 25 (100.0%) | 0 (0.0%) |
| Foreign Born, not a Citizen | 50 (53.8%) | 43 (46.2%) |
Health Insurance Coverage by Household Income in Riegelwood
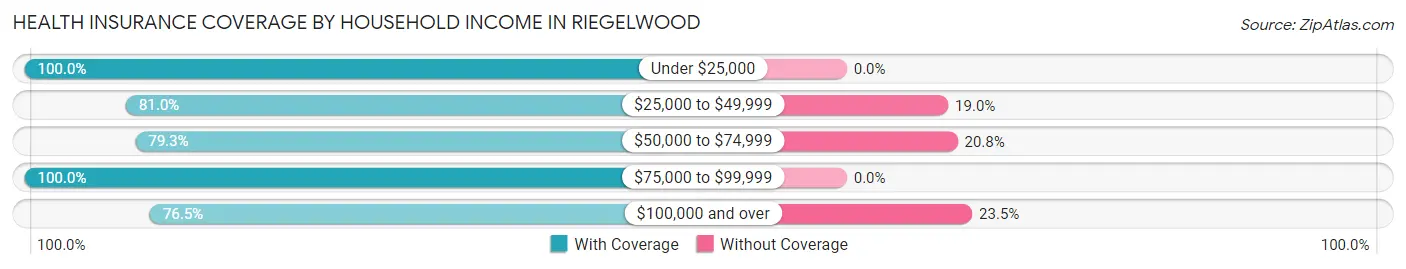
| Household Income | With Coverage | Without Coverage |
| Under $25,000 | 76 (100.0%) | 0 (0.0%) |
| $25,000 to $49,999 | 145 (81.0%) | 34 (19.0%) |
| $50,000 to $74,999 | 168 (79.2%) | 44 (20.7%) |
| $75,000 to $99,999 | 42 (100.0%) | 0 (0.0%) |
| $100,000 and over | 114 (76.5%) | 35 (23.5%) |
Public vs Private Health Insurance Coverage by Age in Riegelwood
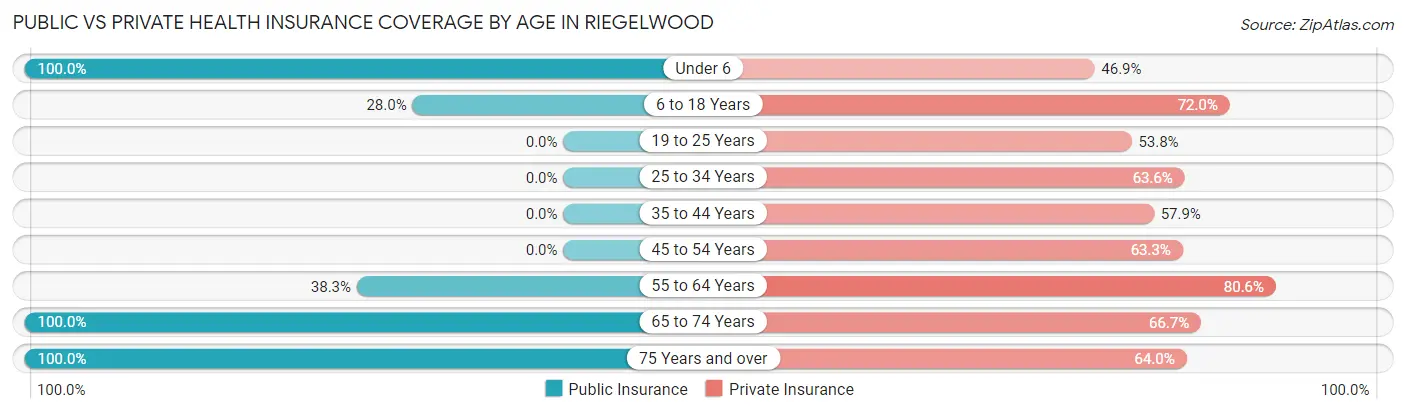
| Age Bracket | Public Insurance | Private Insurance |
| Under 6 | 32 (100.0%) | 15 (46.9%) |
| 6 to 18 Years | 7 (28.0%) | 18 (72.0%) |
| 19 to 25 Years | 0 (0.0%) | 50 (53.8%) |
| 25 to 34 Years | 0 (0.0%) | 77 (63.6%) |
| 35 to 44 Years | 0 (0.0%) | 11 (57.9%) |
| 45 to 54 Years | 0 (0.0%) | 31 (63.3%) |
| 55 to 64 Years | 69 (38.3%) | 145 (80.6%) |
| 65 to 74 Years | 114 (100.0%) | 76 (66.7%) |
| 75 Years and over | 25 (100.0%) | 16 (64.0%) |
| Total | 247 (37.5%) | 439 (66.7%) |
Disability Status by Sex by Age in Riegelwood
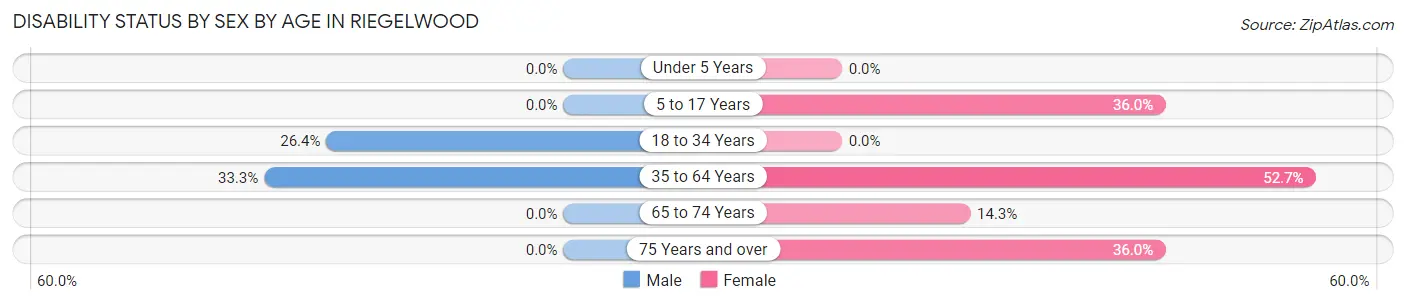
| Age Bracket | Male | Female |
| Under 5 Years | 0 (0.0%) | 0 (0.0%) |
| 5 to 17 Years | 0 (0.0%) | 9 (36.0%) |
| 18 to 34 Years | 33 (26.4%) | 0 (0.0%) |
| 35 to 64 Years | 34 (33.3%) | 77 (52.7%) |
| 65 to 74 Years | 0 (0.0%) | 8 (14.3%) |
| 75 Years and over | 0 (0.0%) | 9 (36.0%) |
Disability Class by Sex by Age in Riegelwood
Disability Class: Hearing Difficulty
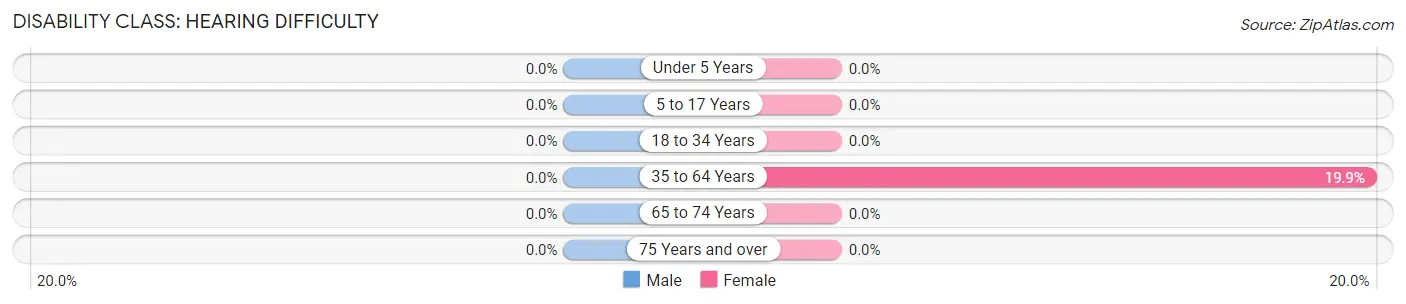
| Age Bracket | Male | Female |
| Under 5 Years | 0 (0.0%) | 0 (0.0%) |
| 5 to 17 Years | 0 (0.0%) | 0 (0.0%) |
| 18 to 34 Years | 0 (0.0%) | 0 (0.0%) |
| 35 to 64 Years | 0 (0.0%) | 29 (19.9%) |
| 65 to 74 Years | 0 (0.0%) | 0 (0.0%) |
| 75 Years and over | 0 (0.0%) | 0 (0.0%) |
Disability Class: Vision Difficulty
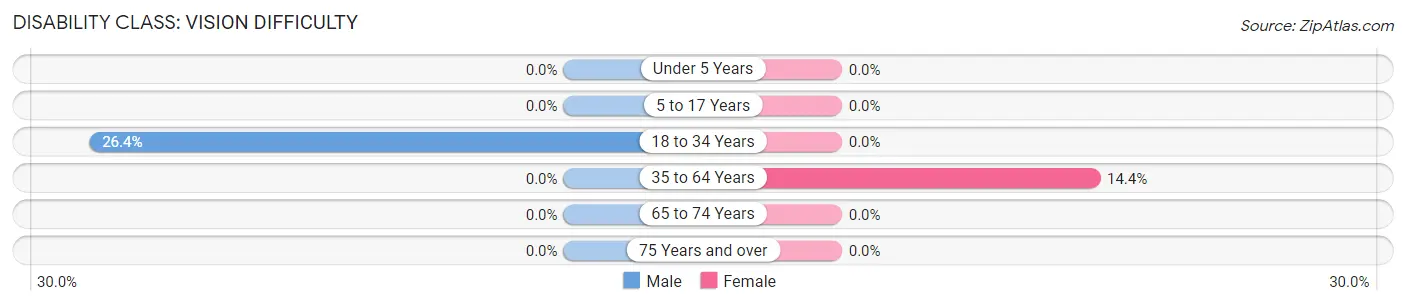
| Age Bracket | Male | Female |
| Under 5 Years | 0 (0.0%) | 0 (0.0%) |
| 5 to 17 Years | 0 (0.0%) | 0 (0.0%) |
| 18 to 34 Years | 33 (26.4%) | 0 (0.0%) |
| 35 to 64 Years | 0 (0.0%) | 21 (14.4%) |
| 65 to 74 Years | 0 (0.0%) | 0 (0.0%) |
| 75 Years and over | 0 (0.0%) | 0 (0.0%) |
Disability Class: Cognitive Difficulty
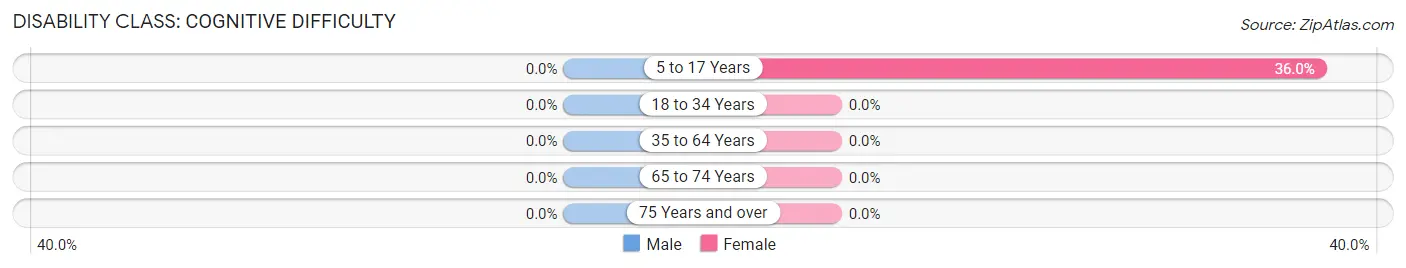
| Age Bracket | Male | Female |
| 5 to 17 Years | 0 (0.0%) | 9 (36.0%) |
| 18 to 34 Years | 0 (0.0%) | 0 (0.0%) |
| 35 to 64 Years | 0 (0.0%) | 0 (0.0%) |
| 65 to 74 Years | 0 (0.0%) | 0 (0.0%) |
| 75 Years and over | 0 (0.0%) | 0 (0.0%) |
Disability Class: Ambulatory Difficulty
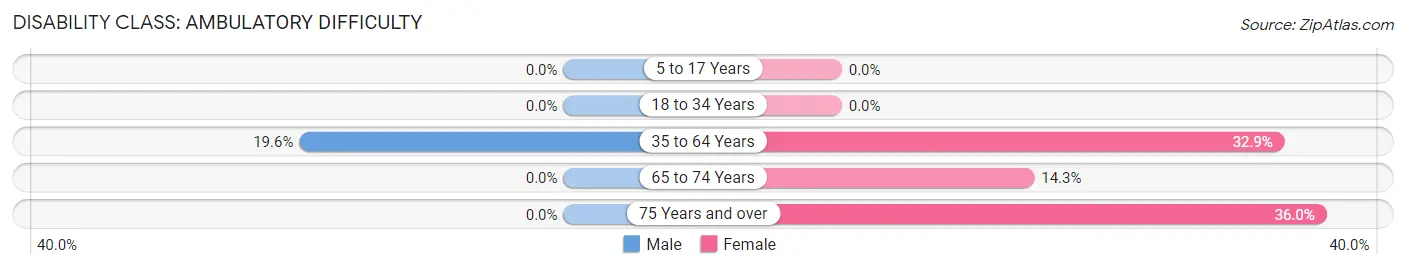
| Age Bracket | Male | Female |
| 5 to 17 Years | 0 (0.0%) | 0 (0.0%) |
| 18 to 34 Years | 0 (0.0%) | 0 (0.0%) |
| 35 to 64 Years | 20 (19.6%) | 48 (32.9%) |
| 65 to 74 Years | 0 (0.0%) | 8 (14.3%) |
| 75 Years and over | 0 (0.0%) | 9 (36.0%) |
Disability Class: Self-Care Difficulty
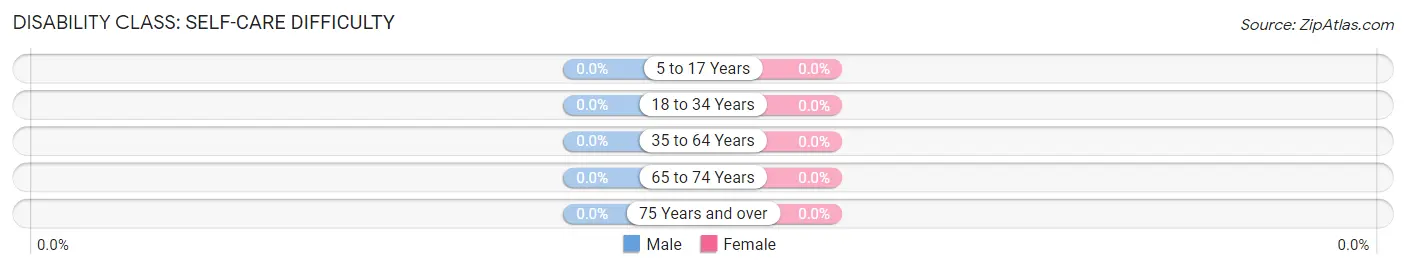
| Age Bracket | Male | Female |
| 5 to 17 Years | 0 (0.0%) | 0 (0.0%) |
| 18 to 34 Years | 0 (0.0%) | 0 (0.0%) |
| 35 to 64 Years | 0 (0.0%) | 0 (0.0%) |
| 65 to 74 Years | 0 (0.0%) | 0 (0.0%) |
| 75 Years and over | 0 (0.0%) | 0 (0.0%) |
Technology Access in Riegelwood
Computing Device Access in Riegelwood
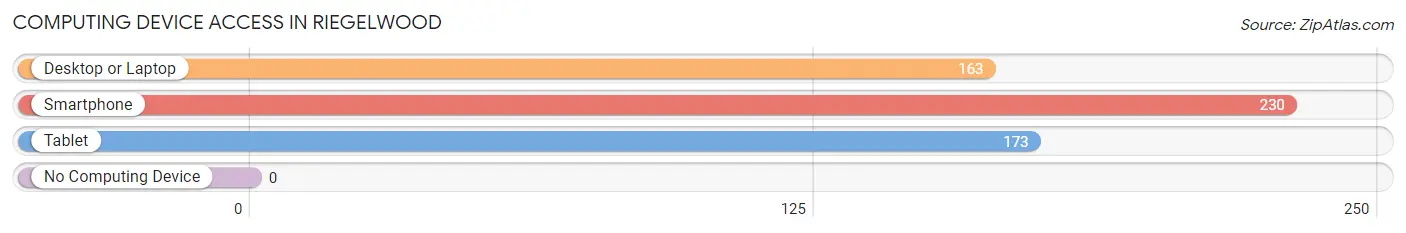
| Device Type | # Households | % Households |
| Desktop or Laptop | 163 | 63.7% |
| Smartphone | 230 | 89.8% |
| Tablet | 173 | 67.6% |
| No Computing Device | 0 | 0.0% |
| Total | 256 | 100.0% |
Internet Access in Riegelwood
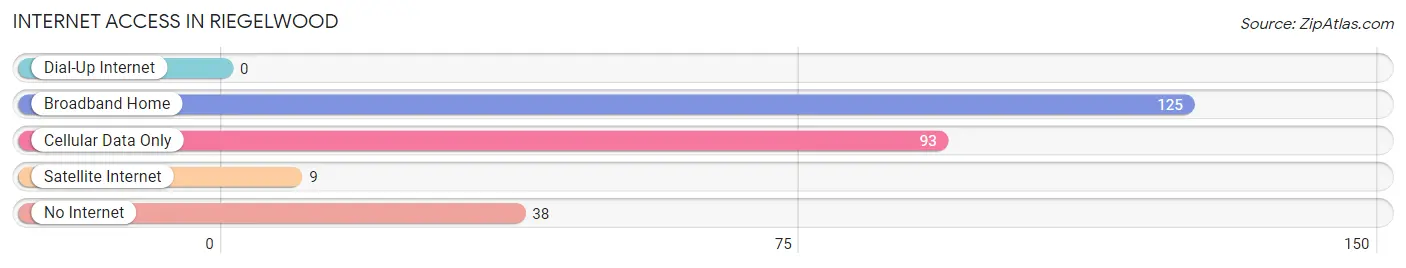
| Internet Type | # Households | % Households |
| Dial-Up Internet | 0 | 0.0% |
| Broadband Home | 125 | 48.8% |
| Cellular Data Only | 93 | 36.3% |
| Satellite Internet | 9 | 3.5% |
| No Internet | 38 | 14.8% |
| Total | 256 | 100.0% |
Riegelwood Summary
Riegelwood is a small unincorporated community located in Columbus County, North Carolina. It is situated along the banks of the Cape Fear River, approximately 20 miles south of Wilmington. The town was founded in the late 19th century and has a population of approximately 1,000 people.
History
Riegelwood was founded in 1887 by German immigrant, John Riegel. He purchased a large tract of land along the banks of the Cape Fear River and began to develop the area. He built a sawmill and a gristmill, which provided employment for the local residents. The town was named after him and grew steadily over the years.
In the early 20th century, the town was a major producer of lumber and turpentine. The turpentine industry was especially important to the local economy, as it provided employment for many of the town’s residents. The town also had a thriving agricultural sector, with many of the local farmers growing cotton, corn, and tobacco.
In the 1950s, the town began to decline as the lumber and turpentine industries moved away. The town’s population began to decline as well, and by the 1970s, the town was in a state of decline. In the 1980s, the town began to experience a resurgence as new businesses began to move into the area.
Geography
Riegelwood is located in the southeastern corner of Columbus County, North Carolina. It is situated along the banks of the Cape Fear River, approximately 20 miles south of Wilmington. The town is surrounded by a mix of rural and suburban areas, with the nearest major city being Wilmington.
The town has a humid subtropical climate, with hot, humid summers and mild winters. The average annual temperature is around 70 degrees Fahrenheit, with the average high temperature in the summer months reaching around 90 degrees Fahrenheit.
Economy
Riegelwood’s economy is largely based on agriculture and manufacturing. The town is home to several small businesses, including a lumber mill, a sawmill, and a gristmill. The town also has a thriving agricultural sector, with many of the local farmers growing cotton, corn, and tobacco.
The town is also home to several large employers, including a paper mill, a chemical plant, and a food processing plant. These businesses provide employment for many of the town’s residents.
Demographics
As of the 2010 census, the population of Riegelwood was 1,000 people. The racial makeup of the town was 94.2% White, 3.2% African American, 0.7% Native American, 0.3% Asian, and 1.6% from other races. The median household income was $31,250, and the median family income was $37,500.
Riegelwood is a small, rural community with a strong sense of community and a rich history. The town is home to a diverse population and a thriving economy. The town is a great place to live and work, and it is a great place to raise a family.
Common Questions
What is Per Capita Income in Riegelwood?
Per Capita income in Riegelwood is $28,369.
What is the Median Household income in Riegelwood?
Median Household Income in Riegelwood is $42,452.
What is Income or Wage Gap in Riegelwood?
Income or Wage Gap in Riegelwood is 44.0%.
Women in Riegelwood earn 56.0 cents for every dollar earned by a man.
What is Inequality or Gini Index in Riegelwood?
Inequality or Gini Index in Riegelwood is 0.43.
What is the Total Population of Riegelwood?
Total Population of Riegelwood is 658.
What is the Total Male Population of Riegelwood?
Total Male Population of Riegelwood is 302.
What is the Total Female Population of Riegelwood?
Total Female Population of Riegelwood is 356.
What is the Ratio of Males per 100 Females in Riegelwood?
There are 84.83 Males per 100 Females in Riegelwood.
What is the Ratio of Females per 100 Males in Riegelwood?
There are 117.88 Females per 100 Males in Riegelwood.
What is the Median Population Age in Riegelwood?
Median Population Age in Riegelwood is 54.2 Years.
What is the Average Family Size in Riegelwood
Average Family Size in Riegelwood is 2.8 People.
What is the Average Household Size in Riegelwood
Average Household Size in Riegelwood is 2.6 People.
How Large is the Labor Force in Riegelwood?
There are 312 People in the Labor Forcein in Riegelwood.
What is the Percentage of People in the Labor Force in Riegelwood?
51.9% of People are in the Labor Force in Riegelwood.
What is the Unemployment Rate in Riegelwood?
Unemployment Rate in Riegelwood is 3.5%.