Cities with the Most Immigrants from El Salvador in North Carolina
RELATED REPORTS & OPTIONS
El Salvador
North Carolina
Compare Cities
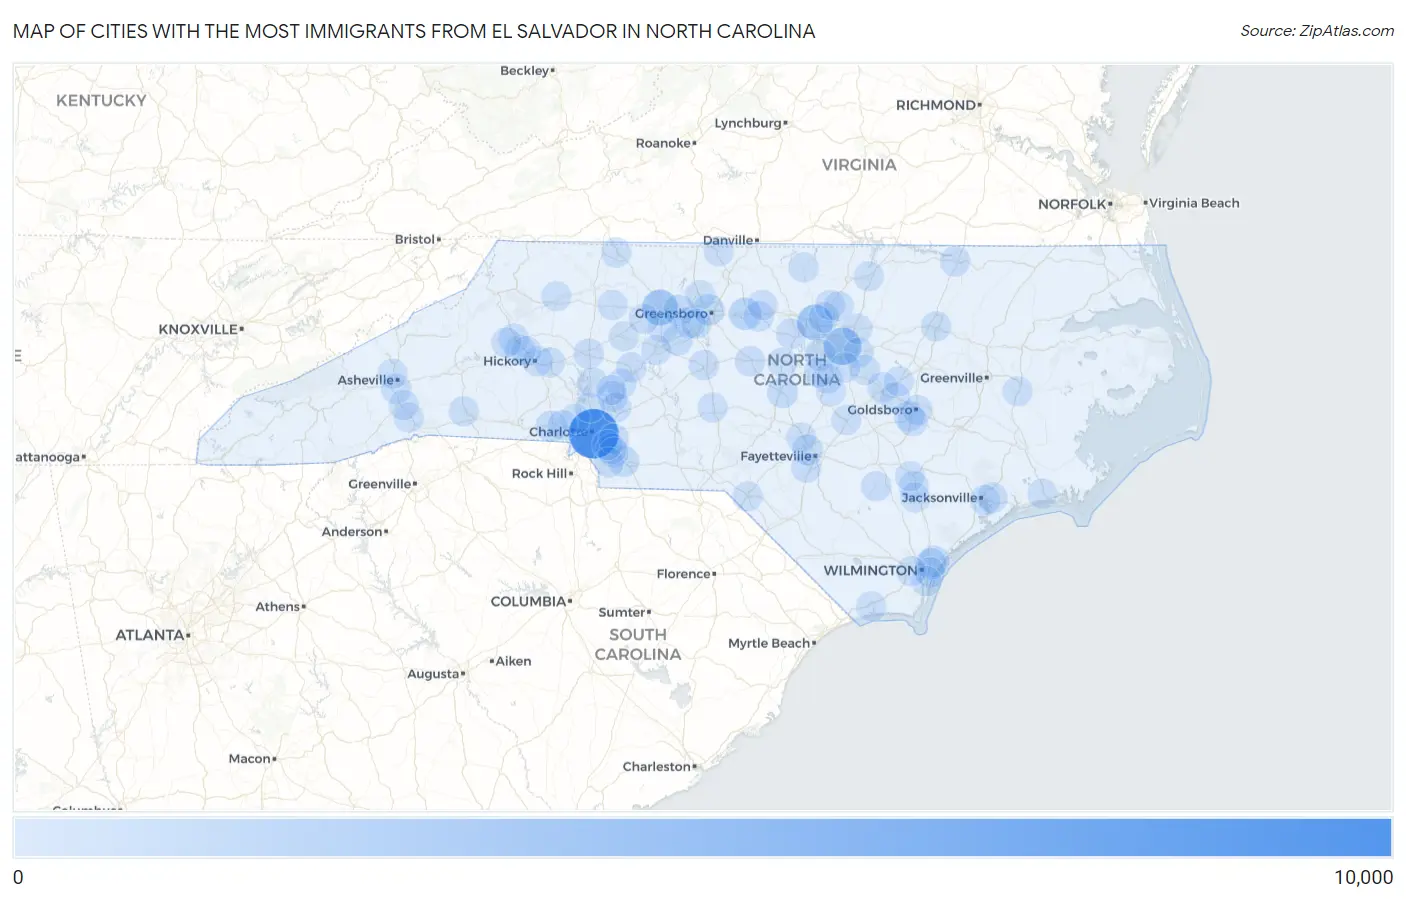
Map of Cities with the Most Immigrants from El Salvador in North Carolina
0
10,000
Cities with the Most Immigrants from El Salvador in North Carolina
| City | El Salvador | vs State | vs National | |
| 1. | Charlotte | 8,038 | 33,379(24.08%)#1 | 1,408,349(0.57%)#9 |
| 2. | Raleigh | 2,950 | 33,379(8.84%)#2 | 1,408,349(0.21%)#68 |
| 3. | Winston Salem | 2,293 | 33,379(6.87%)#3 | 1,408,349(0.16%)#95 |
| 4. | Durham | 2,268 | 33,379(6.79%)#4 | 1,408,349(0.16%)#96 |
| 5. | Burlington | 898 | 33,379(2.69%)#5 | 1,408,349(0.06%)#248 |
| 6. | Cary | 545 | 33,379(1.63%)#6 | 1,408,349(0.04%)#372 |
| 7. | High Point | 541 | 33,379(1.62%)#7 | 1,408,349(0.04%)#375 |
| 8. | Greensboro | 501 | 33,379(1.50%)#8 | 1,408,349(0.04%)#403 |
| 9. | Murraysville | 489 | 33,379(1.46%)#9 | 1,408,349(0.03%)#409 |
| 10. | Monroe | 429 | 33,379(1.29%)#10 | 1,408,349(0.03%)#455 |
| 11. | Gastonia | 408 | 33,379(1.22%)#11 | 1,408,349(0.03%)#480 |
| 12. | Sanford | 387 | 33,379(1.16%)#12 | 1,408,349(0.03%)#511 |
| 13. | Kernersville | 368 | 33,379(1.10%)#13 | 1,408,349(0.03%)#537 |
| 14. | Fayetteville | 323 | 33,379(0.97%)#14 | 1,408,349(0.02%)#610 |
| 15. | Kings Grant | 252 | 33,379(0.75%)#15 | 1,408,349(0.02%)#733 |
| 16. | Thomasville | 248 | 33,379(0.74%)#16 | 1,408,349(0.02%)#742 |
| 17. | Gorman | 181 | 33,379(0.54%)#17 | 1,408,349(0.01%)#900 |
| 18. | Selma | 179 | 33,379(0.54%)#18 | 1,408,349(0.01%)#911 |
| 19. | Emma | 179 | 33,379(0.54%)#19 | 1,408,349(0.01%)#912 |
| 20. | Graham | 172 | 33,379(0.52%)#20 | 1,408,349(0.01%)#941 |
| 21. | Lenoir | 169 | 33,379(0.51%)#21 | 1,408,349(0.01%)#952 |
| 22. | Statesville | 168 | 33,379(0.50%)#22 | 1,408,349(0.01%)#957 |
| 23. | Carrboro | 157 | 33,379(0.47%)#23 | 1,408,349(0.01%)#1,000 |
| 24. | Piney Green | 157 | 33,379(0.47%)#24 | 1,408,349(0.01%)#1,002 |
| 25. | Asheboro | 155 | 33,379(0.46%)#25 | 1,408,349(0.01%)#1,012 |
| 26. | Roanoke Rapids | 137 | 33,379(0.41%)#26 | 1,408,349(0.01%)#1,089 |
| 27. | Siler City | 124 | 33,379(0.37%)#27 | 1,408,349(0.01%)#1,153 |
| 28. | China Grove | 124 | 33,379(0.37%)#28 | 1,408,349(0.01%)#1,154 |
| 29. | Ingold | 122 | 33,379(0.37%)#29 | 1,408,349(0.01%)#1,163 |
| 30. | Jacksonville | 117 | 33,379(0.35%)#30 | 1,408,349(0.01%)#1,195 |
| 31. | Kannapolis | 114 | 33,379(0.34%)#31 | 1,408,349(0.01%)#1,215 |
| 32. | Hickory | 107 | 33,379(0.32%)#32 | 1,408,349(0.01%)#1,254 |
| 33. | Salisbury | 105 | 33,379(0.31%)#33 | 1,408,349(0.01%)#1,263 |
| 34. | Concord | 99 | 33,379(0.30%)#34 | 1,408,349(0.01%)#1,307 |
| 35. | Stallings | 98 | 33,379(0.29%)#35 | 1,408,349(0.01%)#1,317 |
| 36. | Mar Mac | 97 | 33,379(0.29%)#36 | 1,408,349(0.01%)#1,326 |
| 37. | Rocky Mount | 96 | 33,379(0.29%)#37 | 1,408,349(0.01%)#1,327 |
| 38. | Mint Hill | 96 | 33,379(0.29%)#38 | 1,408,349(0.01%)#1,332 |
| 39. | Wilmington | 77 | 33,379(0.23%)#39 | 1,408,349(0.01%)#1,502 |
| 40. | Hope Mills | 77 | 33,379(0.23%)#40 | 1,408,349(0.01%)#1,506 |
| 41. | Asheville | 72 | 33,379(0.22%)#41 | 1,408,349(0.01%)#1,550 |
| 42. | Star | 67 | 33,379(0.20%)#42 | 1,408,349(0.00%)#1,628 |
| 43. | Wake Forest | 66 | 33,379(0.20%)#43 | 1,408,349(0.00%)#1,632 |
| 44. | Princeton | 62 | 33,379(0.19%)#44 | 1,408,349(0.00%)#1,701 |
| 45. | Yadkinville | 61 | 33,379(0.18%)#45 | 1,408,349(0.00%)#1,718 |
| 46. | Shallotte | 58 | 33,379(0.17%)#46 | 1,408,349(0.00%)#1,760 |
| 47. | Midway | 55 | 33,379(0.16%)#47 | 1,408,349(0.00%)#1,811 |
| 48. | Eden | 52 | 33,379(0.16%)#48 | 1,408,349(0.00%)#1,853 |
| 49. | Sawmills | 52 | 33,379(0.16%)#49 | 1,408,349(0.00%)#1,858 |
| 50. | Mooresville | 51 | 33,379(0.15%)#50 | 1,408,349(0.00%)#1,862 |
| 51. | Rose Hill | 50 | 33,379(0.15%)#51 | 1,408,349(0.00%)#1,896 |
| 52. | Hendersonville | 48 | 33,379(0.14%)#52 | 1,408,349(0.00%)#1,917 |
| 53. | Goldsboro | 47 | 33,379(0.14%)#53 | 1,408,349(0.00%)#1,926 |
| 54. | Brogden | 46 | 33,379(0.14%)#54 | 1,408,349(0.00%)#1,960 |
| 55. | Angier | 45 | 33,379(0.13%)#55 | 1,408,349(0.00%)#1,980 |
| 56. | Indian Trail | 44 | 33,379(0.13%)#56 | 1,408,349(0.00%)#1,985 |
| 57. | Spring Lake | 43 | 33,379(0.13%)#57 | 1,408,349(0.00%)#2,006 |
| 58. | Butner | 42 | 33,379(0.13%)#58 | 1,408,349(0.00%)#2,027 |
| 59. | Rutherfordton | 40 | 33,379(0.12%)#59 | 1,408,349(0.00%)#2,080 |
| 60. | Knightdale | 39 | 33,379(0.12%)#60 | 1,408,349(0.00%)#2,093 |
| 61. | Summerfield | 39 | 33,379(0.12%)#61 | 1,408,349(0.00%)#2,096 |
| 62. | Wallace | 38 | 33,379(0.11%)#62 | 1,408,349(0.00%)#2,126 |
| 63. | Toast | 38 | 33,379(0.11%)#63 | 1,408,349(0.00%)#2,130 |
| 64. | Newport | 37 | 33,379(0.11%)#64 | 1,408,349(0.00%)#2,150 |
| 65. | Kenly | 37 | 33,379(0.11%)#65 | 1,408,349(0.00%)#2,154 |
| 66. | Clayton | 36 | 33,379(0.11%)#66 | 1,408,349(0.00%)#2,163 |
| 67. | Lexington | 36 | 33,379(0.11%)#67 | 1,408,349(0.00%)#2,164 |
| 68. | Green Level | 36 | 33,379(0.11%)#68 | 1,408,349(0.00%)#2,172 |
| 69. | Anderson Creek | 34 | 33,379(0.10%)#69 | 1,408,349(0.00%)#2,203 |
| 70. | Mocksville | 34 | 33,379(0.10%)#70 | 1,408,349(0.00%)#2,208 |
| 71. | Chocowinity | 33 | 33,379(0.10%)#71 | 1,408,349(0.00%)#2,236 |
| 72. | Fuquay Varina | 30 | 33,379(0.09%)#72 | 1,408,349(0.00%)#2,296 |
| 73. | Henderson | 30 | 33,379(0.09%)#73 | 1,408,349(0.00%)#2,302 |
| 74. | Wesley Chapel | 30 | 33,379(0.09%)#74 | 1,408,349(0.00%)#2,307 |
| 75. | Roxboro | 29 | 33,379(0.09%)#75 | 1,408,349(0.00%)#2,343 |
| 76. | Enochville | 28 | 33,379(0.08%)#76 | 1,408,349(0.00%)#2,367 |
| 77. | Arrowhead Beach | 28 | 33,379(0.08%)#77 | 1,408,349(0.00%)#2,373 |
| 78. | Spout Springs | 26 | 33,379(0.08%)#78 | 1,408,349(0.00%)#2,417 |
| 79. | Holly Springs | 25 | 33,379(0.07%)#79 | 1,408,349(0.00%)#2,440 |
| 80. | Creedmoor | 25 | 33,379(0.07%)#80 | 1,408,349(0.00%)#2,457 |
| 81. | Garner | 24 | 33,379(0.07%)#81 | 1,408,349(0.00%)#2,475 |
| 82. | Mount Holly | 24 | 33,379(0.07%)#82 | 1,408,349(0.00%)#2,481 |
| 83. | Granite Falls | 24 | 33,379(0.07%)#83 | 1,408,349(0.00%)#2,497 |
| 84. | Laurinburg | 23 | 33,379(0.07%)#84 | 1,408,349(0.00%)#2,524 |
| 85. | Pittsboro | 23 | 33,379(0.07%)#85 | 1,408,349(0.00%)#2,538 |
| 86. | Huntersville | 22 | 33,379(0.07%)#86 | 1,408,349(0.00%)#2,553 |
| 87. | Matthews | 22 | 33,379(0.07%)#87 | 1,408,349(0.00%)#2,562 |
| 88. | Dudley | 22 | 33,379(0.07%)#88 | 1,408,349(0.00%)#2,587 |
| 89. | Woodfin | 20 | 33,379(0.06%)#89 | 1,408,349(0.00%)#2,662 |
| 90. | Jamestown | 19 | 33,379(0.06%)#90 | 1,408,349(0.00%)#2,710 |
| 91. | Fairplains | 19 | 33,379(0.06%)#91 | 1,408,349(0.00%)#2,719 |
| 92. | Magnolia | 19 | 33,379(0.06%)#92 | 1,408,349(0.00%)#2,728 |
| 93. | Conover | 18 | 33,379(0.05%)#93 | 1,408,349(0.00%)#2,753 |
| 94. | Silver Lake | 17 | 33,379(0.05%)#94 | 1,408,349(0.00%)#2,797 |
| 95. | Lowell | 17 | 33,379(0.05%)#95 | 1,408,349(0.00%)#2,800 |
| 96. | Dunn | 16 | 33,379(0.05%)#96 | 1,408,349(0.00%)#2,830 |
| 97. | Clemmons | 15 | 33,379(0.04%)#97 | 1,408,349(0.00%)#2,873 |
| 98. | Fletcher | 15 | 33,379(0.04%)#98 | 1,408,349(0.00%)#2,892 |
| 99. | Gamewell | 14 | 33,379(0.04%)#99 | 1,408,349(0.00%)#2,958 |
| 100. | Leland | 13 | 33,379(0.04%)#100 | 1,408,349(0.00%)#2,988 |
Common Questions
What are the Top 10 Cities with the Most Immigrants from El Salvador in North Carolina?
Top 10 Cities with the Most Immigrants from El Salvador in North Carolina are:
#1
8,038
#2
2,950
#3
2,293
#4
2,268
#5
898
#6
545
#7
541
#8
501
#9
489
#10
429
What city has the Most Immigrants from El Salvador in North Carolina?
Charlotte has the Most Immigrants from El Salvador in North Carolina with 8,038.
What is the Total Immigrants from El Salvador in the State of North Carolina?
Total Immigrants from El Salvador in North Carolina is 33,379.
What is the Total Immigrants from El Salvador in the United States?
Total Immigrants from El Salvador in the United States is 1,408,349.