Henrietta, NC Map & Demographics
Henrietta Map
Henrietta Overview
$16,529
PER CAPITA INCOME
$45,444
AVG HOUSEHOLD INCOME
0.35
INEQUALITY / GINI INDEX
341
TOTAL POPULATION
118
MALE POPULATION
223
FEMALE POPULATION
52.91
MALES / 100 FEMALES
188.98
FEMALES / 100 MALES
49.3
MEDIAN AGE
3.0
AVG FAMILY SIZE
2.4
AVG HOUSEHOLD SIZE
88
LABOR FORCE [ PEOPLE ]
25.8%
PERCENT IN LABOR FORCE
Henrietta Zip Codes
Henrietta Area Codes
Income in Henrietta
Income Overview in Henrietta
| Characteristic | Number | Measure |
| Per Capita Income | 341 | $16,529 |
| Median Family Income | 78 | $0 |
| Mean Family Income | 78 | $0 |
| Median Household Income | 140 | $45,444 |
| Mean Household Income | 140 | $41,417 |
| Income Deficit | 78 | $0 |
| Wage / Income Gap (%) | 341 | 0.00% |
| Wage / Income Gap ($) | 341 | 100.00¢ per $1 |
| Gini / Inequality Index | 341 | 0.35 |
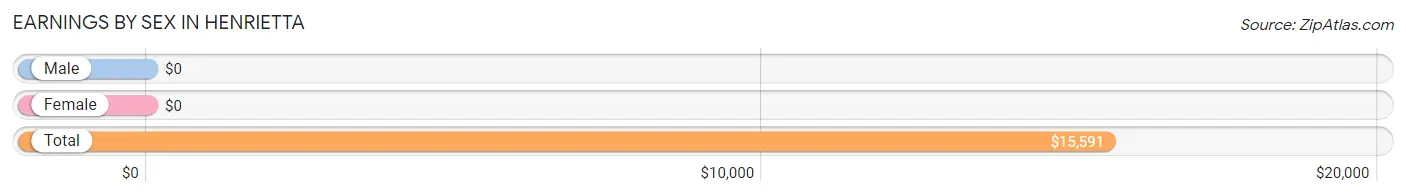
Earnings by Sex in Henrietta
| Sex | Number | Average Earnings |
| Male | 88 (58.7%) | $0 |
| Female | 62 (41.3%) | $0 |
| Total | 150 (100.0%) | $15,591 |
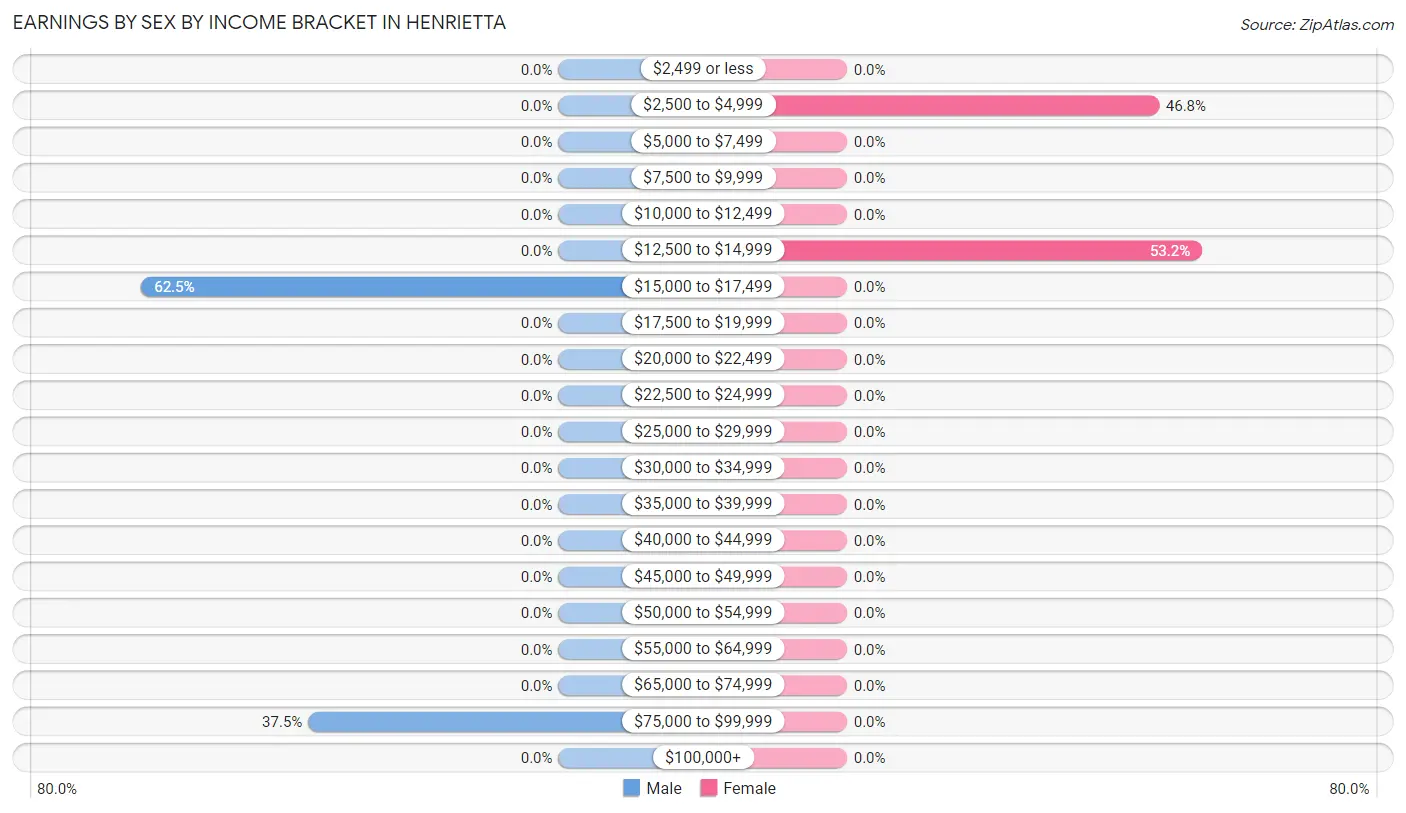
Earnings by Sex by Income Bracket in Henrietta
The most common earnings brackets in Henrietta are $15,000 to $17,499 for men (55 | 62.5%) and $12,500 to $14,999 for women (33 | 53.2%).
| Income | Male | Female |
| $2,499 or less | 0 (0.0%) | 0 (0.0%) |
| $2,500 to $4,999 | 0 (0.0%) | 29 (46.8%) |
| $5,000 to $7,499 | 0 (0.0%) | 0 (0.0%) |
| $7,500 to $9,999 | 0 (0.0%) | 0 (0.0%) |
| $10,000 to $12,499 | 0 (0.0%) | 0 (0.0%) |
| $12,500 to $14,999 | 0 (0.0%) | 33 (53.2%) |
| $15,000 to $17,499 | 55 (62.5%) | 0 (0.0%) |
| $17,500 to $19,999 | 0 (0.0%) | 0 (0.0%) |
| $20,000 to $22,499 | 0 (0.0%) | 0 (0.0%) |
| $22,500 to $24,999 | 0 (0.0%) | 0 (0.0%) |
| $25,000 to $29,999 | 0 (0.0%) | 0 (0.0%) |
| $30,000 to $34,999 | 0 (0.0%) | 0 (0.0%) |
| $35,000 to $39,999 | 0 (0.0%) | 0 (0.0%) |
| $40,000 to $44,999 | 0 (0.0%) | 0 (0.0%) |
| $45,000 to $49,999 | 0 (0.0%) | 0 (0.0%) |
| $50,000 to $54,999 | 0 (0.0%) | 0 (0.0%) |
| $55,000 to $64,999 | 0 (0.0%) | 0 (0.0%) |
| $65,000 to $74,999 | 0 (0.0%) | 0 (0.0%) |
| $75,000 to $99,999 | 33 (37.5%) | 0 (0.0%) |
| $100,000+ | 0 (0.0%) | 0 (0.0%) |
| Total | 88 (100.0%) | 62 (100.0%) |
Earnings by Sex by Educational Attainment in Henrietta
| Educational Attainment | Male Income | Female Income |
| Less than High School | - | - |
| High School Diploma | - | - |
| College or Associate's Degree | - | - |
| Bachelor's Degree | - | - |
| Graduate Degree | - | - |
| Total | - | - |
Family Income in Henrietta
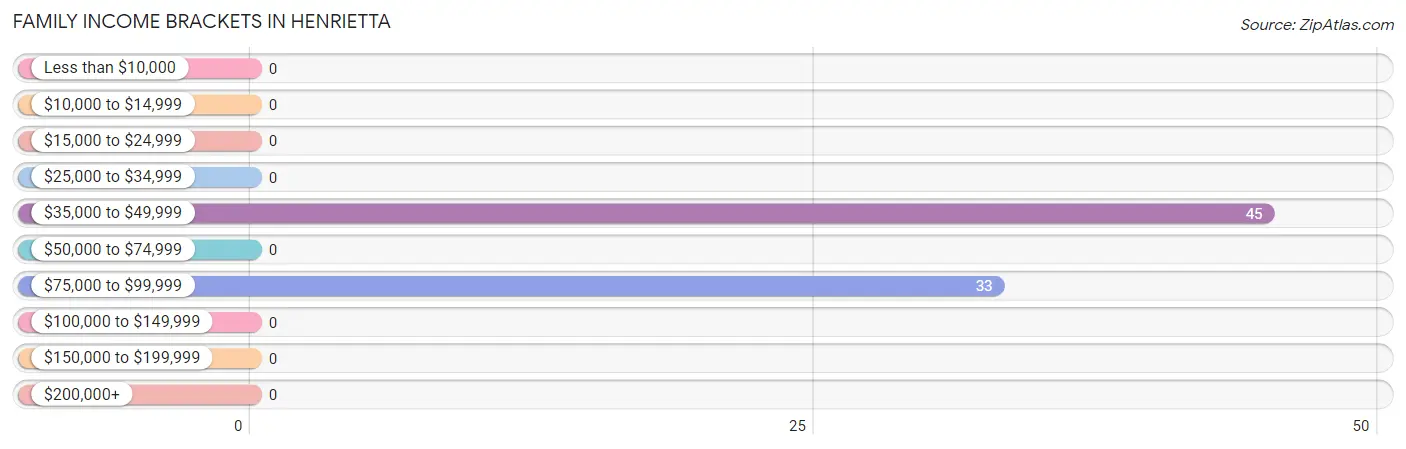
Family Income Brackets in Henrietta
According to the Henrietta family income data, there are 45 families falling into the $35,000 to $49,999 income range, which is the most common income bracket and makes up 57.7% of all families.
| Income Bracket | # Families | % Families |
| Less than $10,000 | 0 | 0.0% |
| $10,000 to $14,999 | 0 | 0.0% |
| $15,000 to $24,999 | 0 | 0.0% |
| $25,000 to $34,999 | 0 | 0.0% |
| $35,000 to $49,999 | 45 | 57.7% |
| $50,000 to $74,999 | 0 | 0.0% |
| $75,000 to $99,999 | 33 | 42.3% |
| $100,000 to $149,999 | 0 | 0.0% |
| $150,000 to $199,999 | 0 | 0.0% |
| $200,000+ | 0 | 0.0% |
Family Income by Famaliy Size in Henrietta
| Income Bracket | # Families | Median Income |
| 2-Person Families | 0 (0.0%) | $0 |
| 3-Person Families | 78 (100.0%) | $0 |
| 4-Person Families | 0 (0.0%) | $0 |
| 5-Person Families | 0 (0.0%) | $0 |
| 6-Person Families | 0 (0.0%) | $0 |
| 7+ Person Families | 0 (0.0%) | $0 |
| Total | 78 (100.0%) | $0 |
Family Income by Number of Earners in Henrietta
| Number of Earners | # Families | Median Income |
| No Earners | 0 (0.0%) | $0 |
| 1 Earner | 78 (100.0%) | $0 |
| 2 Earners | 0 (0.0%) | $0 |
| 3+ Earners | 0 (0.0%) | $0 |
| Total | 78 (100.0%) | $0 |
Household Income in Henrietta
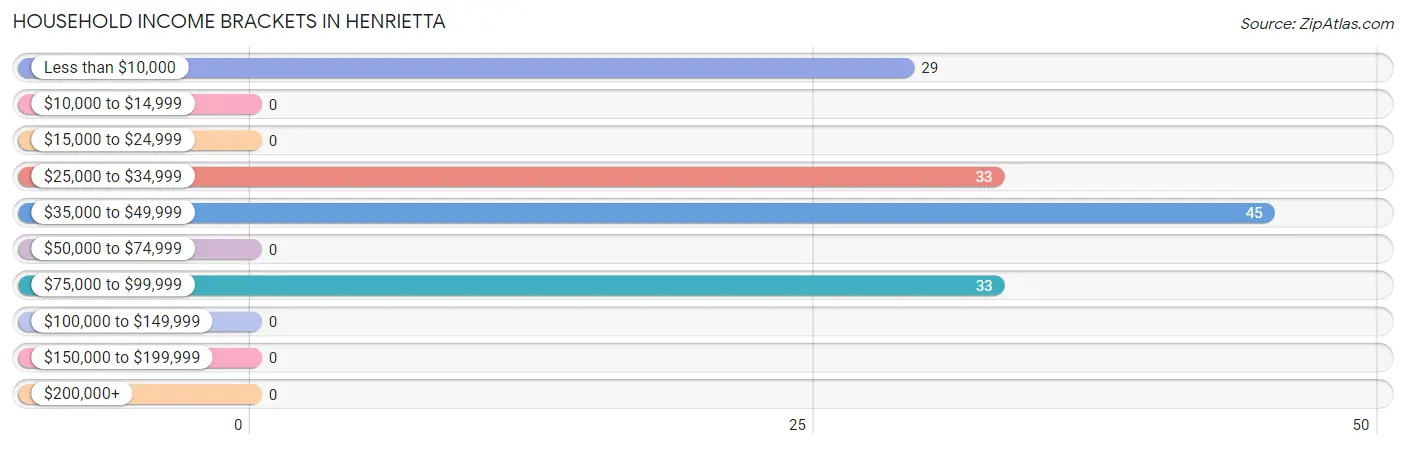
Household Income Brackets in Henrietta
With 45 households falling in the category, the $35,000 to $49,999 income range is the most frequent in Henrietta, accounting for 32.1% of all households.
| Income Bracket | # Households | % Households |
| Less than $10,000 | 29 | 20.7% |
| $10,000 to $14,999 | 0 | 0.0% |
| $15,000 to $24,999 | 0 | 0.0% |
| $25,000 to $34,999 | 33 | 23.6% |
| $35,000 to $49,999 | 45 | 32.1% |
| $50,000 to $74,999 | 0 | 0.0% |
| $75,000 to $99,999 | 33 | 23.6% |
| $100,000 to $149,999 | 0 | 0.0% |
| $150,000 to $199,999 | 0 | 0.0% |
| $200,000+ | 0 | 0.0% |
Household Income by Householder Age in Henrietta
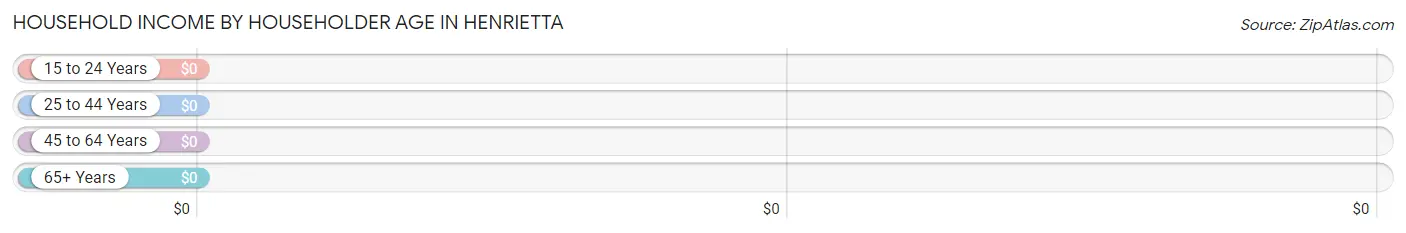
| Income Bracket | # Households | Median Income |
| 15 to 24 Years | 29 (20.7%) | $0 |
| 25 to 44 Years | 0 (0.0%) | $0 |
| 45 to 64 Years | 66 (47.1%) | $0 |
| 65+ Years | 45 (32.1%) | $0 |
| Total | 140 (100.0%) | $45,444 |
Poverty in Henrietta
Income Below Poverty by Sex and Age in Henrietta
With 5.9% poverty level for males and 30.9% for females among the residents of Henrietta, 55 to 64 year old males and 55 to 64 year old females are the most vulnerable to poverty, with 7 males (100.0%) and 40 females (54.8%) in their respective age groups living below the poverty level.
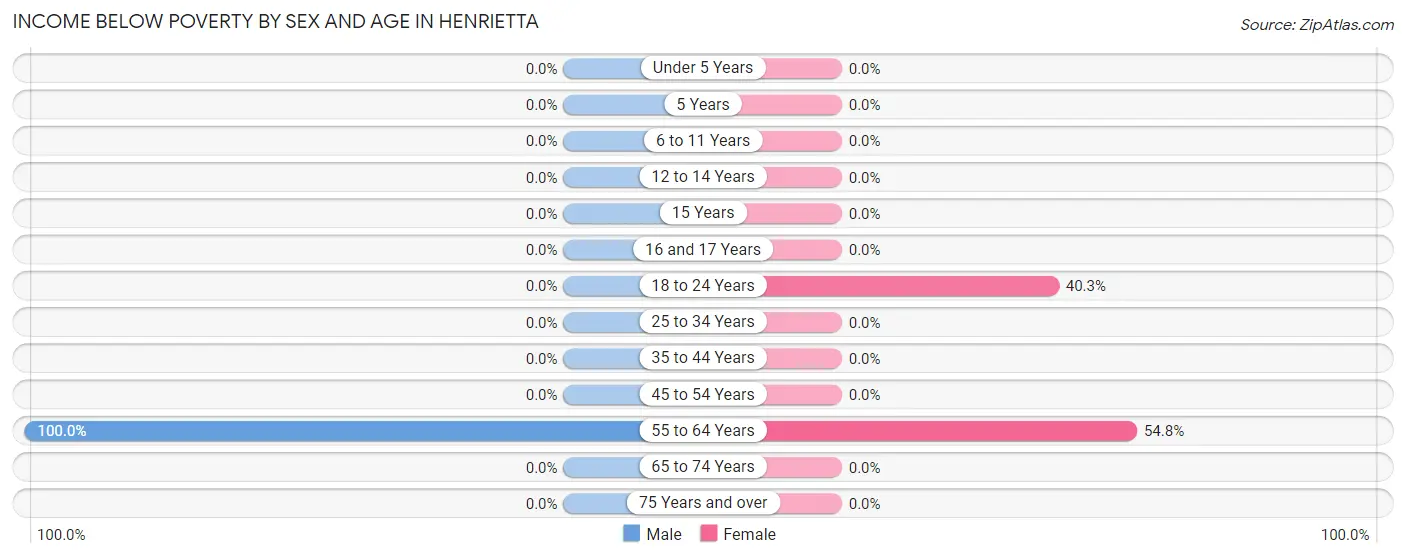
| Age Bracket | Male | Female |
| Under 5 Years | 0 (0.0%) | 0 (0.0%) |
| 5 Years | 0 (0.0%) | 0 (0.0%) |
| 6 to 11 Years | 0 (0.0%) | 0 (0.0%) |
| 12 to 14 Years | 0 (0.0%) | 0 (0.0%) |
| 15 Years | 0 (0.0%) | 0 (0.0%) |
| 16 and 17 Years | 0 (0.0%) | 0 (0.0%) |
| 18 to 24 Years | 0 (0.0%) | 29 (40.3%) |
| 25 to 34 Years | 0 (0.0%) | 0 (0.0%) |
| 35 to 44 Years | 0 (0.0%) | 0 (0.0%) |
| 45 to 54 Years | 0 (0.0%) | 0 (0.0%) |
| 55 to 64 Years | 7 (100.0%) | 40 (54.8%) |
| 65 to 74 Years | 0 (0.0%) | 0 (0.0%) |
| 75 Years and over | 0 (0.0%) | 0 (0.0%) |
| Total | 7 (5.9%) | 69 (30.9%) |
Income Above Poverty by Sex and Age in Henrietta
According to the poverty statistics in Henrietta, males aged 25 to 34 years and females aged 35 to 44 years are the age groups that are most secure financially, with 100.0% of males and 100.0% of females in these age groups living above the poverty line.
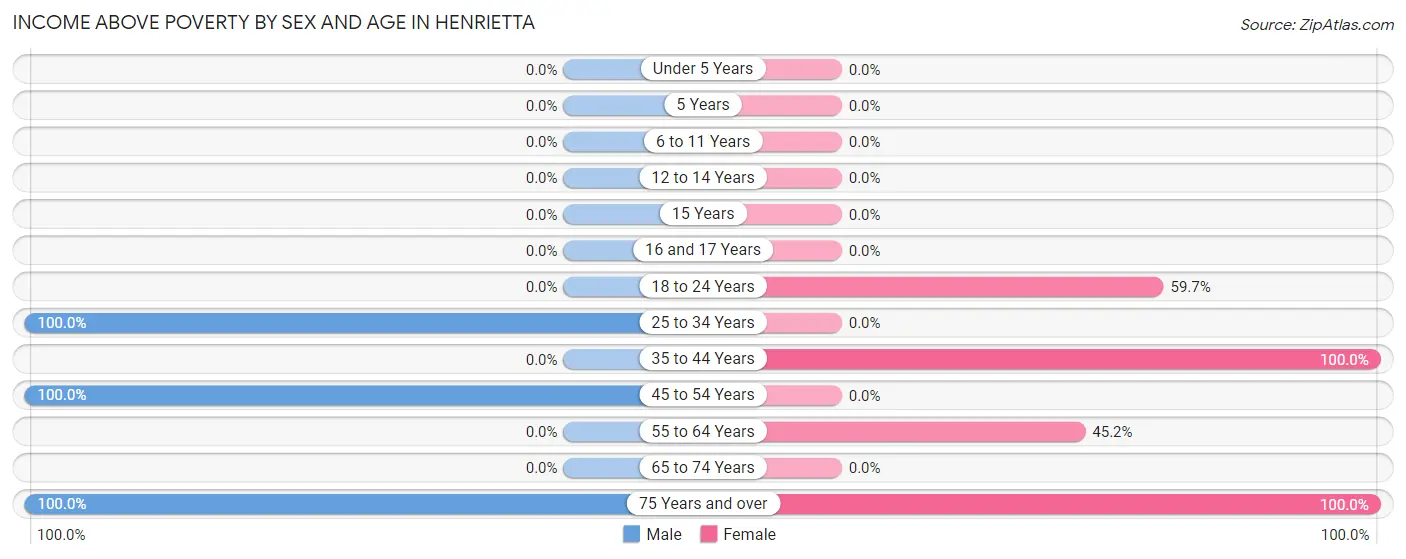
| Age Bracket | Male | Female |
| Under 5 Years | 0 (0.0%) | 0 (0.0%) |
| 5 Years | 0 (0.0%) | 0 (0.0%) |
| 6 to 11 Years | 0 (0.0%) | 0 (0.0%) |
| 12 to 14 Years | 0 (0.0%) | 0 (0.0%) |
| 15 Years | 0 (0.0%) | 0 (0.0%) |
| 16 and 17 Years | 0 (0.0%) | 0 (0.0%) |
| 18 to 24 Years | 0 (0.0%) | 43 (59.7%) |
| 25 to 34 Years | 55 (100.0%) | 0 (0.0%) |
| 35 to 44 Years | 0 (0.0%) | 33 (100.0%) |
| 45 to 54 Years | 33 (100.0%) | 0 (0.0%) |
| 55 to 64 Years | 0 (0.0%) | 33 (45.2%) |
| 65 to 74 Years | 0 (0.0%) | 0 (0.0%) |
| 75 Years and over | 23 (100.0%) | 45 (100.0%) |
| Total | 111 (94.1%) | 154 (69.1%) |
Income Below Poverty Among Married-Couple Families in Henrietta
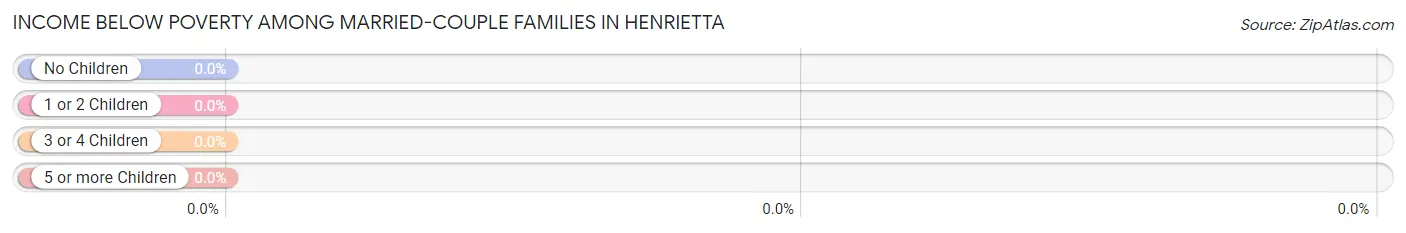
| Children | Above Poverty | Below Poverty |
| No Children | 78 (100.0%) | 0 (0.0%) |
| 1 or 2 Children | 0 (0.0%) | 0 (0.0%) |
| 3 or 4 Children | 0 (0.0%) | 0 (0.0%) |
| 5 or more Children | 0 (0.0%) | 0 (0.0%) |
| Total | 78 (100.0%) | 0 (0.0%) |
Income Below Poverty Among Single-Parent Households in Henrietta
| Children | Single Father | Single Mother |
| No Children | 0 (0.0%) | 0 (0.0%) |
| 1 or 2 Children | 0 (0.0%) | 0 (0.0%) |
| 3 or 4 Children | 0 (0.0%) | 0 (0.0%) |
| 5 or more Children | 0 (0.0%) | 0 (0.0%) |
| Total | 0 (0.0%) | 0 (0.0%) |
Income Below Poverty Among Married-Couple vs Single-Parent Households in Henrietta
| Children | Married-Couple Families | Single-Parent Households |
| No Children | 0 (0.0%) | 0 (0.0%) |
| 1 or 2 Children | 0 (0.0%) | 0 (0.0%) |
| 3 or 4 Children | 0 (0.0%) | 0 (0.0%) |
| 5 or more Children | 0 (0.0%) | 0 (0.0%) |
| Total | 0 (0.0%) | 0 (0.0%) |
Race in Henrietta
The most populous races in Henrietta are White / Caucasian (218 | 63.9%), and Black / African American (123 | 36.1%).
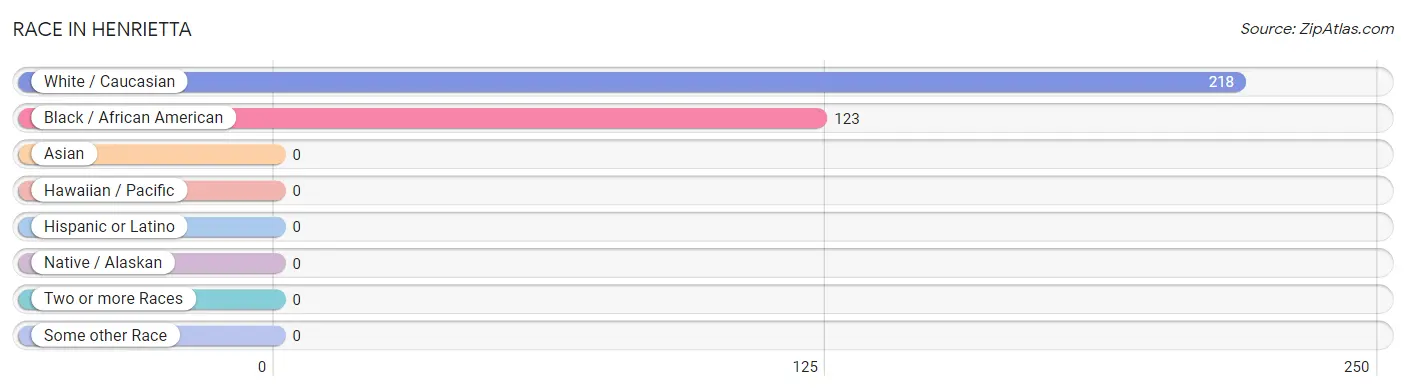
| Race | # Population | % Population |
| Asian | 0 | 0.0% |
| Black / African American | 123 | 36.1% |
| Hawaiian / Pacific | 0 | 0.0% |
| Hispanic or Latino | 0 | 0.0% |
| Native / Alaskan | 0 | 0.0% |
| White / Caucasian | 218 | 63.9% |
| Two or more Races | 0 | 0.0% |
| Some other Race | 0 | 0.0% |
| Total | 341 | 100.0% |
Ancestry in Henrietta
The most populous ancestries reported in Henrietta are American (73 | 21.4%), Armenian (33 | 9.7%), and French (33 | 9.7%), together accounting for 40.8% of all Henrietta residents.
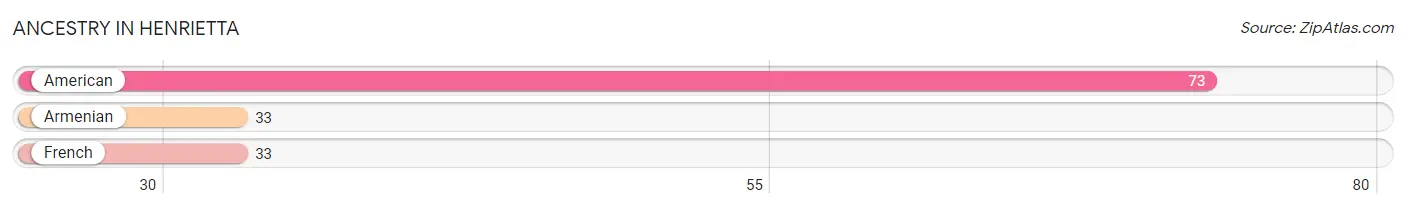
| Ancestry | # Population | % Population |
| American | 73 | 21.4% |
| Armenian | 33 | 9.7% |
| French | 33 | 9.7% | View All 3 Rows |
Immigrants in Henrietta

| Immigration Origin | # Population | % Population | View All 0 Rows |
Sex and Age in Henrietta
Sex and Age in Henrietta
The most populous age groups in Henrietta are 25 to 29 Years (55 | 46.6%) for men and 60 to 64 Years (73 | 32.7%) for women.
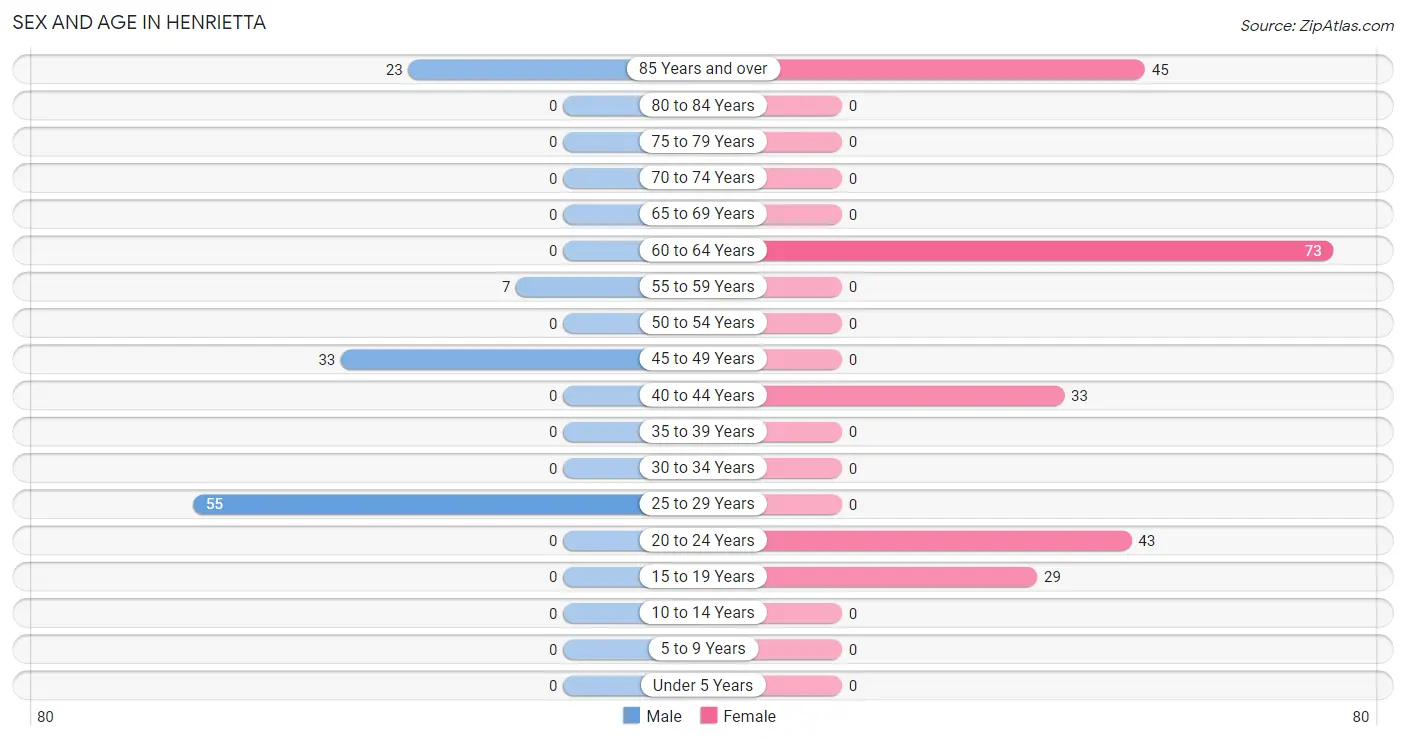
| Age Bracket | Male | Female |
| Under 5 Years | 0 (0.0%) | 0 (0.0%) |
| 5 to 9 Years | 0 (0.0%) | 0 (0.0%) |
| 10 to 14 Years | 0 (0.0%) | 0 (0.0%) |
| 15 to 19 Years | 0 (0.0%) | 29 (13.0%) |
| 20 to 24 Years | 0 (0.0%) | 43 (19.3%) |
| 25 to 29 Years | 55 (46.6%) | 0 (0.0%) |
| 30 to 34 Years | 0 (0.0%) | 0 (0.0%) |
| 35 to 39 Years | 0 (0.0%) | 0 (0.0%) |
| 40 to 44 Years | 0 (0.0%) | 33 (14.8%) |
| 45 to 49 Years | 33 (28.0%) | 0 (0.0%) |
| 50 to 54 Years | 0 (0.0%) | 0 (0.0%) |
| 55 to 59 Years | 7 (5.9%) | 0 (0.0%) |
| 60 to 64 Years | 0 (0.0%) | 73 (32.7%) |
| 65 to 69 Years | 0 (0.0%) | 0 (0.0%) |
| 70 to 74 Years | 0 (0.0%) | 0 (0.0%) |
| 75 to 79 Years | 0 (0.0%) | 0 (0.0%) |
| 80 to 84 Years | 0 (0.0%) | 0 (0.0%) |
| 85 Years and over | 23 (19.5%) | 45 (20.2%) |
| Total | 118 (100.0%) | 223 (100.0%) |
Families and Households in Henrietta
Median Family Size in Henrietta
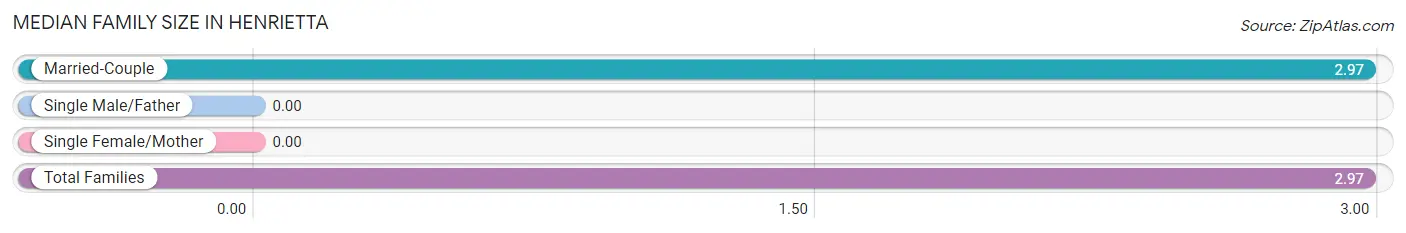
| Family Type | # Families | Family Size |
| Married-Couple | 78 (100.0%) | 2.97 |
| Single Male/Father | 0 (0.0%) | - |
| Single Female/Mother | 0 (0.0%) | - |
| Total Families | 78 (100.0%) | 2.97 |
Median Household Size in Henrietta
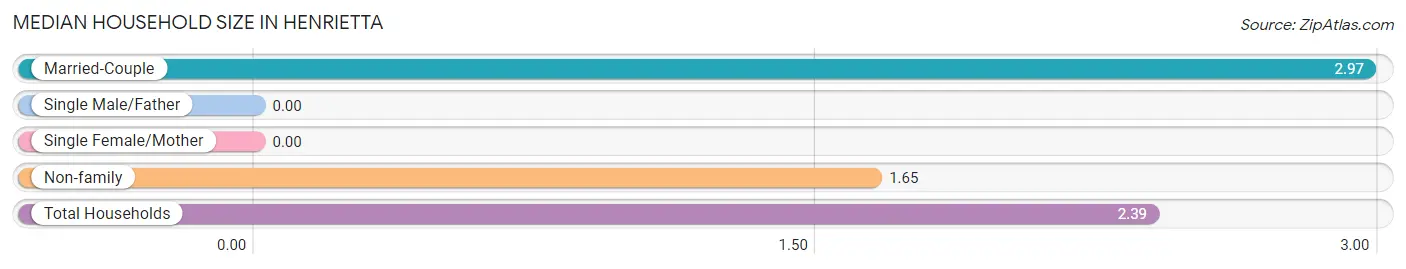
| Household Type | # Households | Household Size |
| Married-Couple | 78 (55.7%) | 2.97 |
| Single Male/Father | 0 (0.0%) | - |
| Single Female/Mother | 0 (0.0%) | - |
| Non-family | 62 (44.3%) | 1.65 |
| Total Households | 140 (100.0%) | 2.39 |
Household Size by Marriage Status in Henrietta
Out of a total of 140 households in Henrietta, 78 (55.7%) are family households, while 62 (44.3%) are nonfamily households. The most numerous type of family households are 3-person households, comprising 78, and the most common type of nonfamily households are 2-person households, comprising 33.
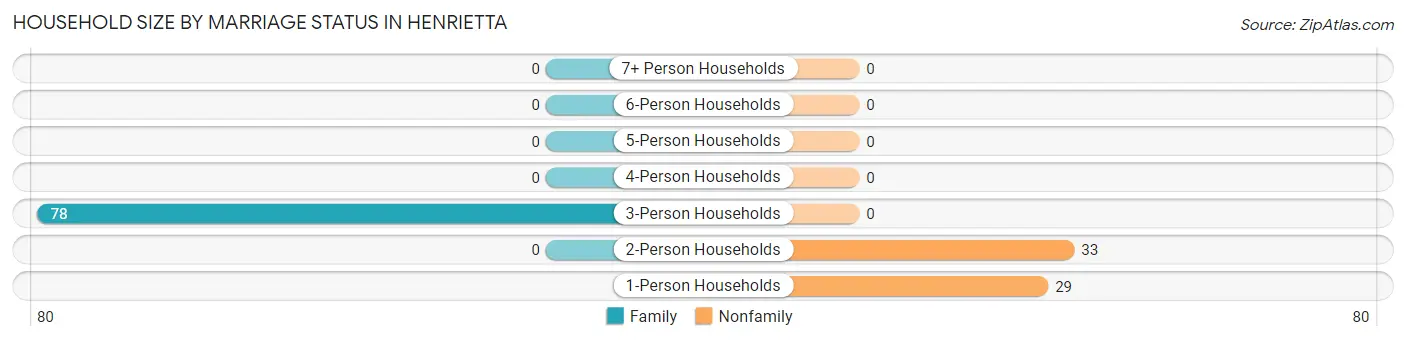
| Household Size | Family Households | Nonfamily Households |
| 1-Person Households | - | 29 (20.7%) |
| 2-Person Households | 0 (0.0%) | 33 (23.6%) |
| 3-Person Households | 78 (55.7%) | 0 (0.0%) |
| 4-Person Households | 0 (0.0%) | 0 (0.0%) |
| 5-Person Households | 0 (0.0%) | 0 (0.0%) |
| 6-Person Households | 0 (0.0%) | 0 (0.0%) |
| 7+ Person Households | 0 (0.0%) | 0 (0.0%) |
| Total | 78 (55.7%) | 62 (44.3%) |
Female Fertility in Henrietta
Fertility by Age in Henrietta
| Age Bracket | Women with Births | Births / 1,000 Women |
| 15 to 19 years | 0 (0.0%) | 0.0 |
| 20 to 34 years | 0 (0.0%) | 0.0 |
| 35 to 50 years | 0 (0.0%) | 0.0 |
| Total | 0 (0.0%) | 0.0 |
Fertility by Age by Marriage Status in Henrietta

| Age Bracket | Married | Unmarried |
| 15 to 19 years | 0 (0.0%) | 0 (0.0%) |
| 20 to 34 years | 0 (0.0%) | 0 (0.0%) |
| 35 to 50 years | 0 (0.0%) | 0 (0.0%) |
| Total | 0 (0.0%) | 0 (0.0%) |
Fertility by Education in Henrietta
| Educational Attainment | Women with Births | Births / 1,000 Women |
| Less than High School | 0 (0.0%) | 0.0 |
| High School Diploma | 0 (0.0%) | 0.0 |
| College or Associate's Degree | 0 (0.0%) | 0.0 |
| Bachelor's Degree | 0 (0.0%) | 0.0 |
| Graduate Degree | 0 (0.0%) | 0.0 |
| Total | 0 (0.0%) | 0.0 |
Fertility by Education by Marriage Status in Henrietta
| Educational Attainment | Married | Unmarried |
| Less than High School | 0 (0.0%) | 0 (0.0%) |
| High School Diploma | 0 (0.0%) | 0 (0.0%) |
| College or Associate's Degree | 0 (0.0%) | 0 (0.0%) |
| Bachelor's Degree | 0 (0.0%) | 0 (0.0%) |
| Graduate Degree | 0 (0.0%) | 0 (0.0%) |
| Total | 0 (0.0%) | 0 (0.0%) |
Employment Characteristics in Henrietta
Employment by Class of Employer in Henrietta
Among the 88 employed individuals in Henrietta, , and private company employees (88 | 100.0%) make up the most common classes of employment.
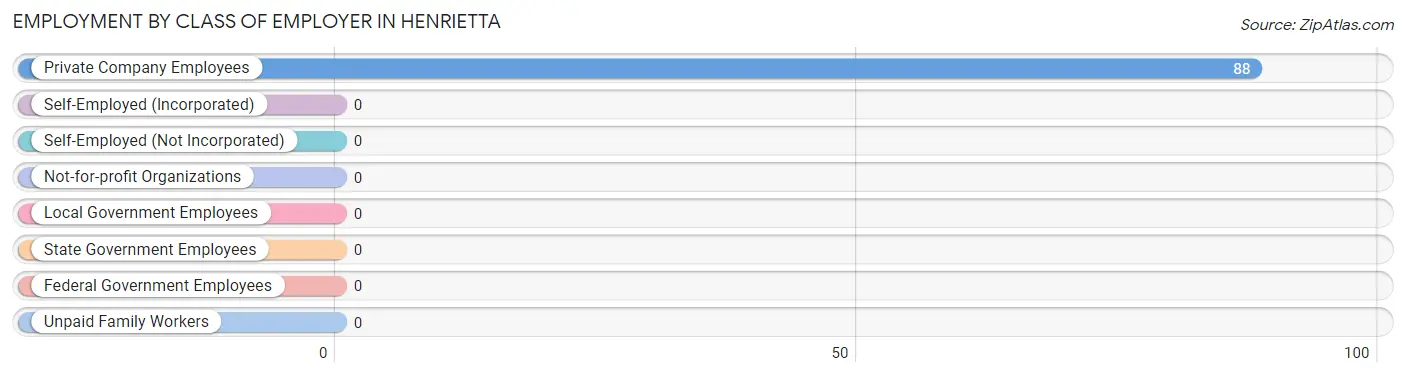
| Employer Class | # Employees | % Employees |
| Private Company Employees | 88 | 100.0% |
| Self-Employed (Incorporated) | 0 | 0.0% |
| Self-Employed (Not Incorporated) | 0 | 0.0% |
| Not-for-profit Organizations | 0 | 0.0% |
| Local Government Employees | 0 | 0.0% |
| State Government Employees | 0 | 0.0% |
| Federal Government Employees | 0 | 0.0% |
| Unpaid Family Workers | 0 | 0.0% |
| Total | 88 | 100.0% |
Employment Status by Age in Henrietta
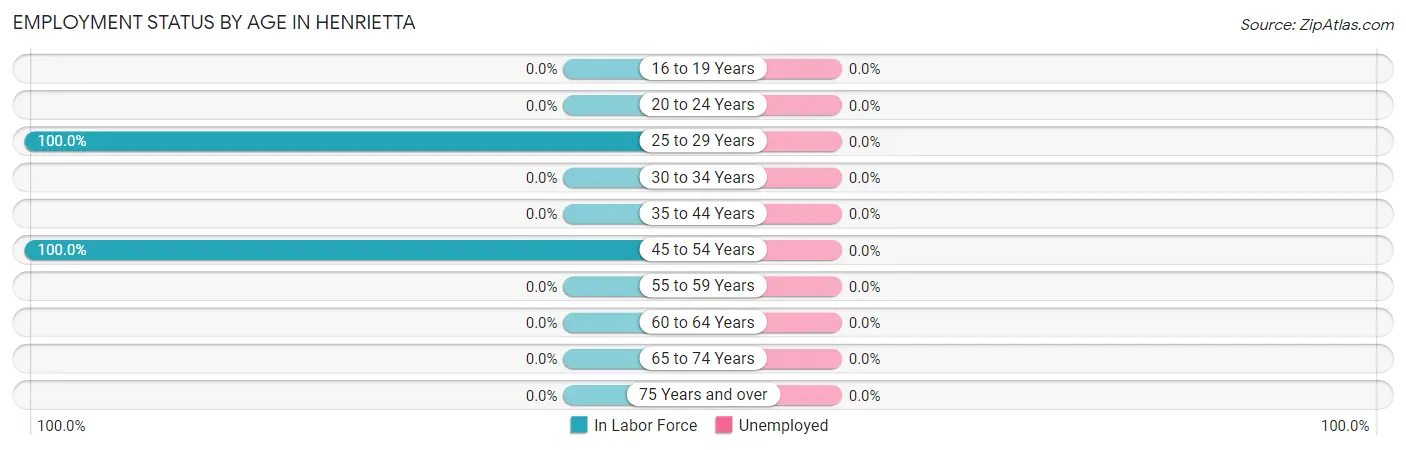
| Age Bracket | In Labor Force | Unemployed |
| 16 to 19 Years | 0 (0.0%) | 0 (0.0%) |
| 20 to 24 Years | 0 (0.0%) | 0 (0.0%) |
| 25 to 29 Years | 55 (100.0%) | 0 (0.0%) |
| 30 to 34 Years | 0 (0.0%) | 0 (0.0%) |
| 35 to 44 Years | 0 (0.0%) | 0 (0.0%) |
| 45 to 54 Years | 33 (100.0%) | 0 (0.0%) |
| 55 to 59 Years | 0 (0.0%) | 0 (0.0%) |
| 60 to 64 Years | 0 (0.0%) | 0 (0.0%) |
| 65 to 74 Years | 0 (0.0%) | 0 (0.0%) |
| 75 Years and over | 0 (0.0%) | 0 (0.0%) |
| Total | 88 (25.8%) | 0 (0.0%) |
Employment Status by Educational Attainment in Henrietta
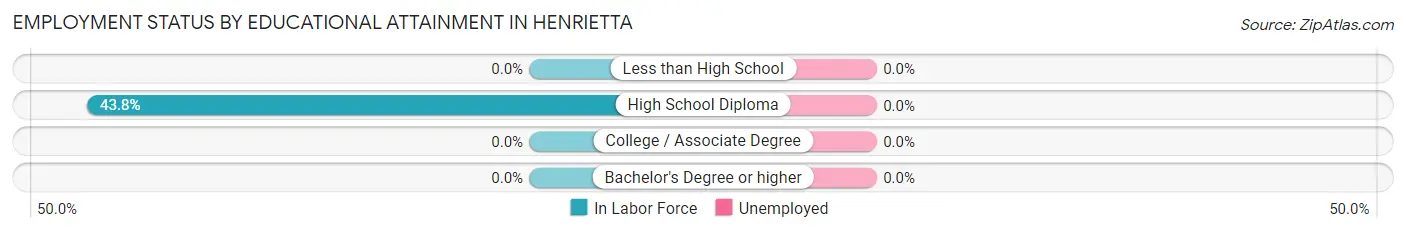
| Educational Attainment | In Labor Force | Unemployed |
| Less than High School | 0 (0.0%) | 0 (0.0%) |
| High School Diploma | 88 (43.8%) | 0 (0.0%) |
| College / Associate Degree | 0 (0.0%) | 0 (0.0%) |
| Bachelor's Degree or higher | 0 (0.0%) | 0 (0.0%) |
| Total | 88 (43.8%) | 0 (0.0%) |
Employment Occupations by Sex in Henrietta
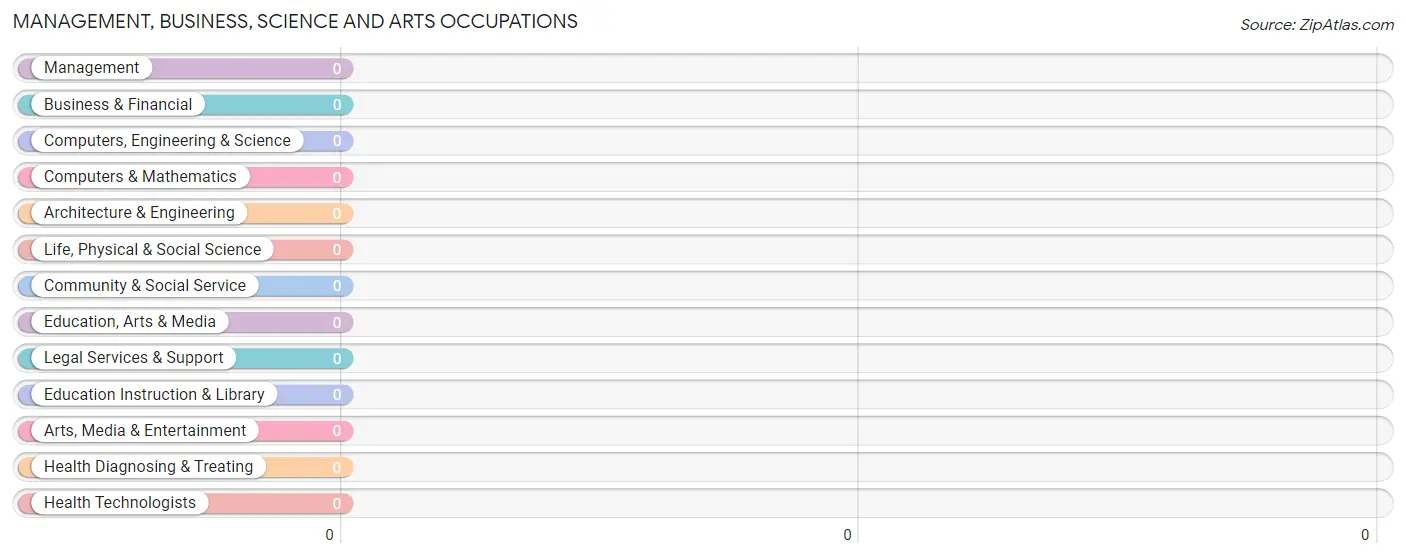
Management, Business, Science and Arts Occupations
Management, Business, Science and Arts Occupations by Sex
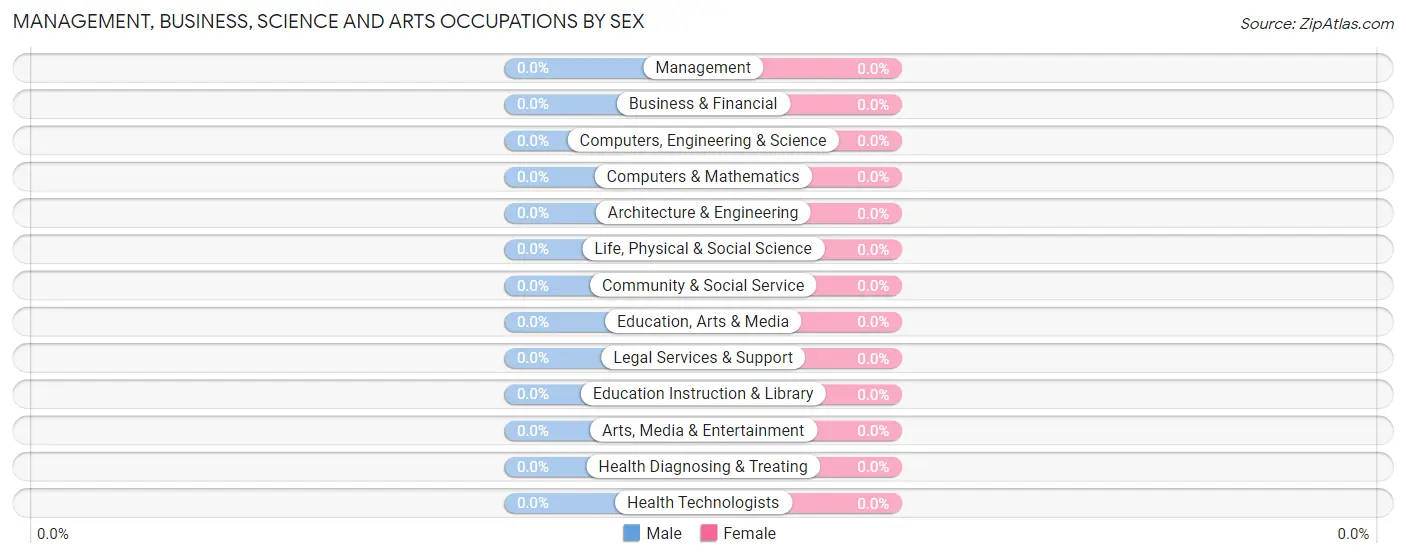
| Occupation | Male | Female |
| Management | 0 (0.0%) | 0 (0.0%) |
| Business & Financial | 0 (0.0%) | 0 (0.0%) |
| Computers, Engineering & Science | 0 (0.0%) | 0 (0.0%) |
| Computers & Mathematics | 0 (0.0%) | 0 (0.0%) |
| Architecture & Engineering | 0 (0.0%) | 0 (0.0%) |
| Life, Physical & Social Science | 0 (0.0%) | 0 (0.0%) |
| Community & Social Service | 0 (0.0%) | 0 (0.0%) |
| Education, Arts & Media | 0 (0.0%) | 0 (0.0%) |
| Legal Services & Support | 0 (0.0%) | 0 (0.0%) |
| Education Instruction & Library | 0 (0.0%) | 0 (0.0%) |
| Arts, Media & Entertainment | 0 (0.0%) | 0 (0.0%) |
| Health Diagnosing & Treating | 0 (0.0%) | 0 (0.0%) |
| Health Technologists | 0 (0.0%) | 0 (0.0%) |
| Total (Category) | 0 (0.0%) | 0 (0.0%) |
| Total (Overall) | 88 (100.0%) | 0 (0.0%) |
Services Occupations
Services Occupations by Sex
| Occupation | Male | Female |
| Healthcare Support | 0 (0.0%) | 0 (0.0%) |
| Security & Protection | 0 (0.0%) | 0 (0.0%) |
| Firefighting & Prevention | 0 (0.0%) | 0 (0.0%) |
| Law Enforcement | 0 (0.0%) | 0 (0.0%) |
| Food Preparation & Serving | 0 (0.0%) | 0 (0.0%) |
| Cleaning & Maintenance | 0 (0.0%) | 0 (0.0%) |
| Personal Care & Service | 0 (0.0%) | 0 (0.0%) |
| Total (Category) | 0 (0.0%) | 0 (0.0%) |
| Total (Overall) | 88 (100.0%) | 0 (0.0%) |
Sales and Office Occupations
The most common Sales and Office occupations in Henrietta are , and Sales & Related (55 | 62.5%).
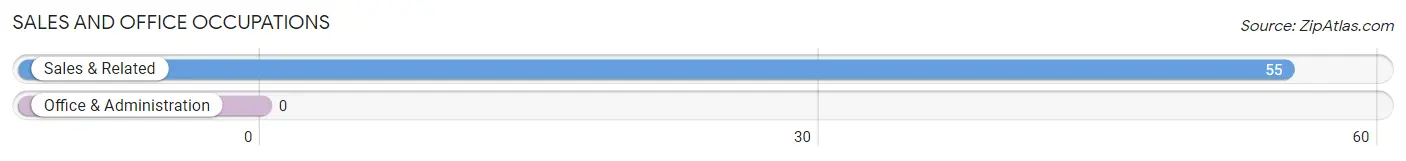
Sales and Office Occupations by Sex
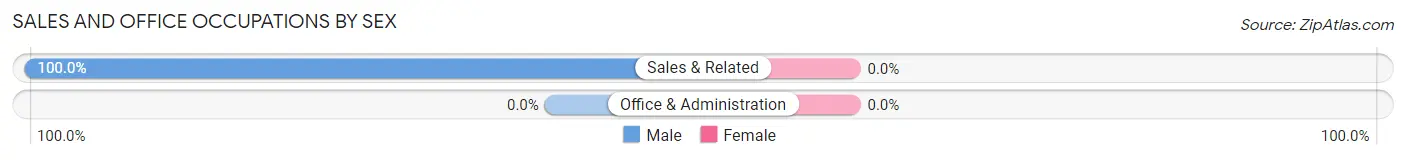
| Occupation | Male | Female |
| Sales & Related | 55 (100.0%) | 0 (0.0%) |
| Office & Administration | 0 (0.0%) | 0 (0.0%) |
| Total (Category) | 55 (100.0%) | 0 (0.0%) |
| Total (Overall) | 88 (100.0%) | 0 (0.0%) |
Natural Resources, Construction and Maintenance Occupations
Natural Resources, Construction and Maintenance Occupations by Sex
| Occupation | Male | Female |
| Farming, Fishing & Forestry | 0 (0.0%) | 0 (0.0%) |
| Construction & Extraction | 0 (0.0%) | 0 (0.0%) |
| Installation, Maintenance & Repair | 0 (0.0%) | 0 (0.0%) |
| Total (Category) | 0 (0.0%) | 0 (0.0%) |
| Total (Overall) | 88 (100.0%) | 0 (0.0%) |
Production, Transportation and Moving Occupations
The most common Production, Transportation and Moving occupations in Henrietta are , and Transportation (33 | 37.5%).
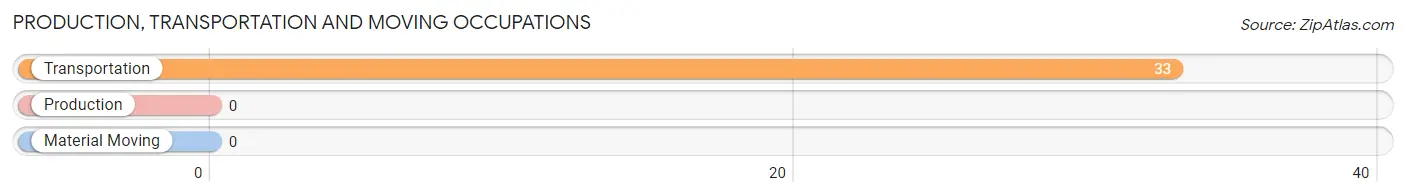
Production, Transportation and Moving Occupations by Sex
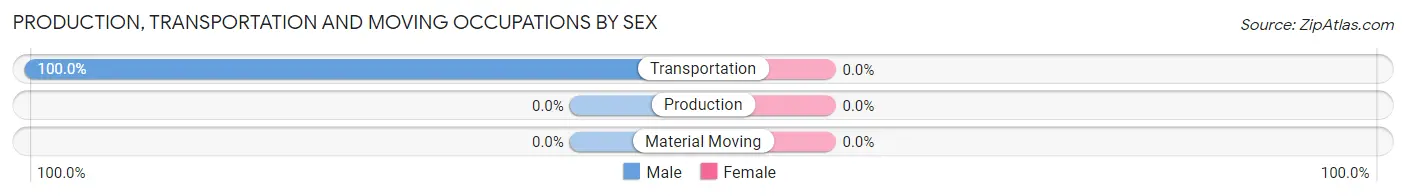
| Occupation | Male | Female |
| Production | 0 (0.0%) | 0 (0.0%) |
| Transportation | 33 (100.0%) | 0 (0.0%) |
| Material Moving | 0 (0.0%) | 0 (0.0%) |
| Total (Category) | 33 (100.0%) | 0 (0.0%) |
| Total (Overall) | 88 (100.0%) | 0 (0.0%) |
Employment Industries by Sex in Henrietta
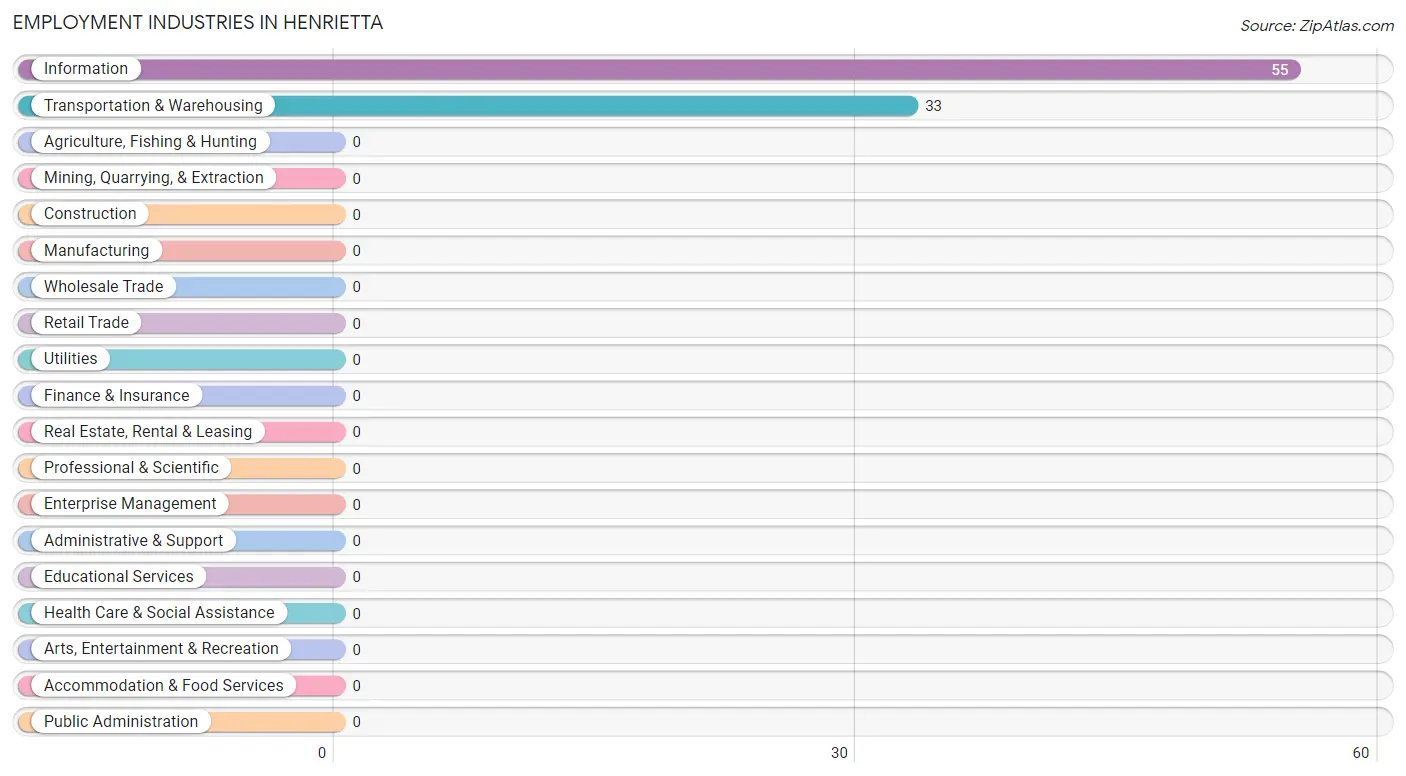
Employment Industries in Henrietta
The major employment industries in Henrietta include Information (55 | 62.5%), and Transportation & Warehousing (33 | 37.5%).
Employment Industries by Sex in Henrietta
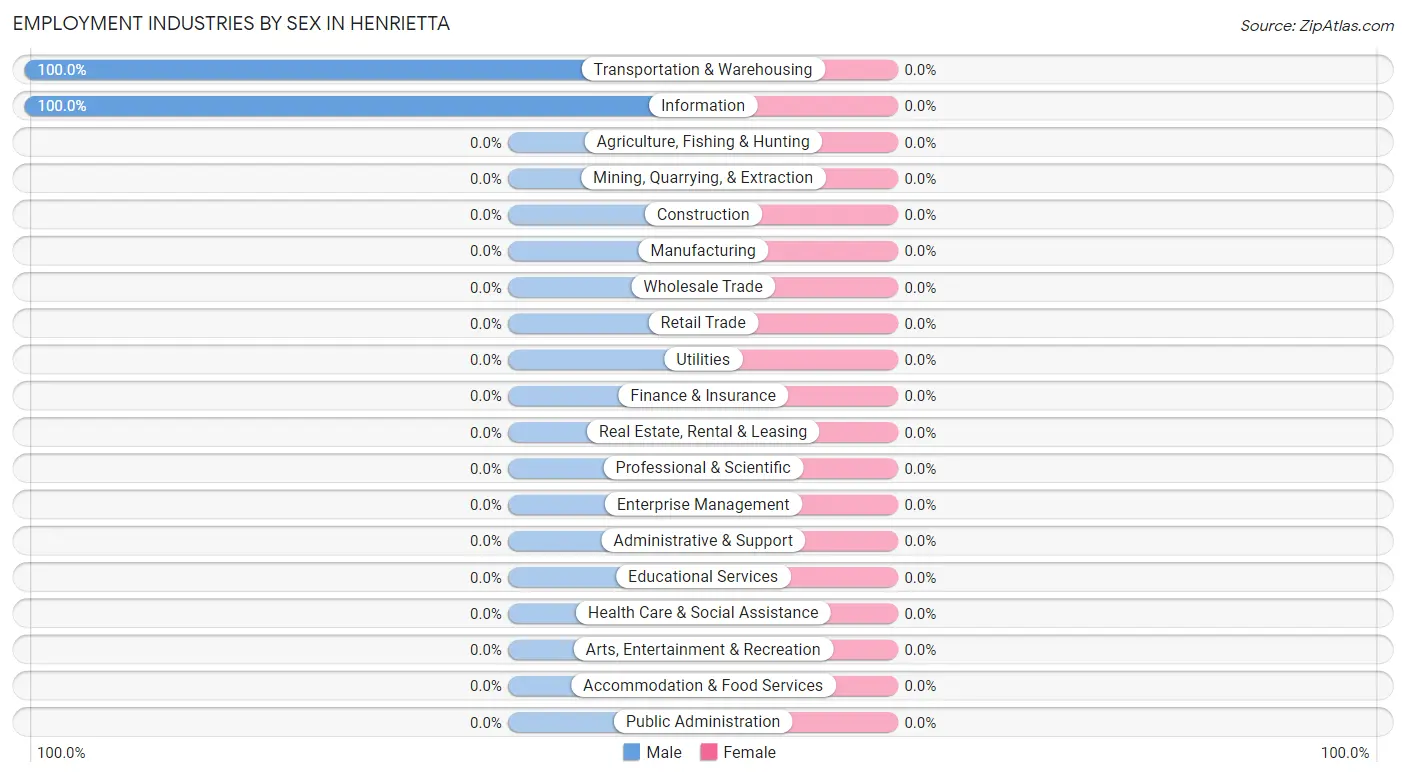
| Industry | Male | Female |
| Agriculture, Fishing & Hunting | 0 (0.0%) | 0 (0.0%) |
| Mining, Quarrying, & Extraction | 0 (0.0%) | 0 (0.0%) |
| Construction | 0 (0.0%) | 0 (0.0%) |
| Manufacturing | 0 (0.0%) | 0 (0.0%) |
| Wholesale Trade | 0 (0.0%) | 0 (0.0%) |
| Retail Trade | 0 (0.0%) | 0 (0.0%) |
| Transportation & Warehousing | 33 (100.0%) | 0 (0.0%) |
| Utilities | 0 (0.0%) | 0 (0.0%) |
| Information | 55 (100.0%) | 0 (0.0%) |
| Finance & Insurance | 0 (0.0%) | 0 (0.0%) |
| Real Estate, Rental & Leasing | 0 (0.0%) | 0 (0.0%) |
| Professional & Scientific | 0 (0.0%) | 0 (0.0%) |
| Enterprise Management | 0 (0.0%) | 0 (0.0%) |
| Administrative & Support | 0 (0.0%) | 0 (0.0%) |
| Educational Services | 0 (0.0%) | 0 (0.0%) |
| Health Care & Social Assistance | 0 (0.0%) | 0 (0.0%) |
| Arts, Entertainment & Recreation | 0 (0.0%) | 0 (0.0%) |
| Accommodation & Food Services | 0 (0.0%) | 0 (0.0%) |
| Public Administration | 0 (0.0%) | 0 (0.0%) |
| Total | 88 (100.0%) | 0 (0.0%) |
Education in Henrietta
School Enrollment in Henrietta
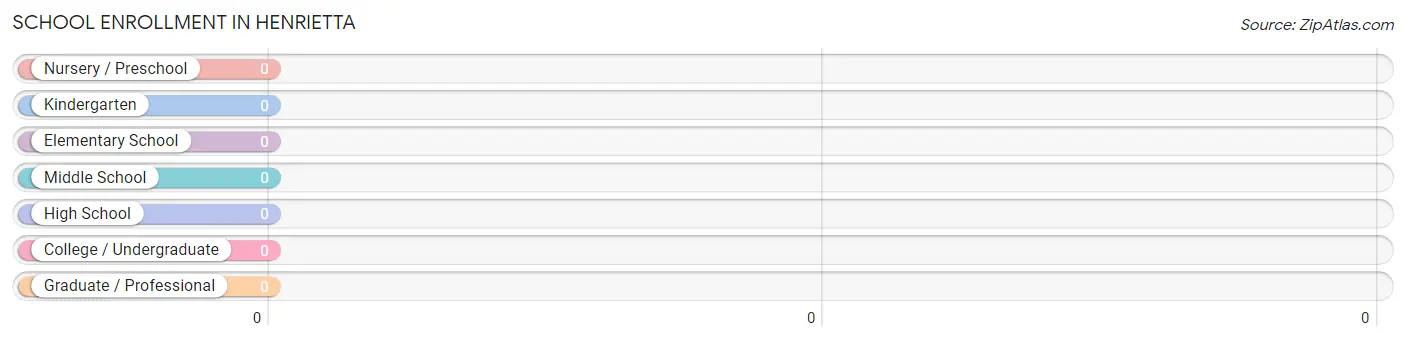
| School Level | # Students | % Students |
| Nursery / Preschool | 0 | 0.0% |
| Kindergarten | 0 | 0.0% |
| Elementary School | 0 | 0.0% |
| Middle School | 0 | 0.0% |
| High School | 0 | 0.0% |
| College / Undergraduate | 0 | 0.0% |
| Graduate / Professional | 0 | 0.0% |
| Total | 0 | 0.0% |
School Enrollment by Age by Funding Source in Henrietta
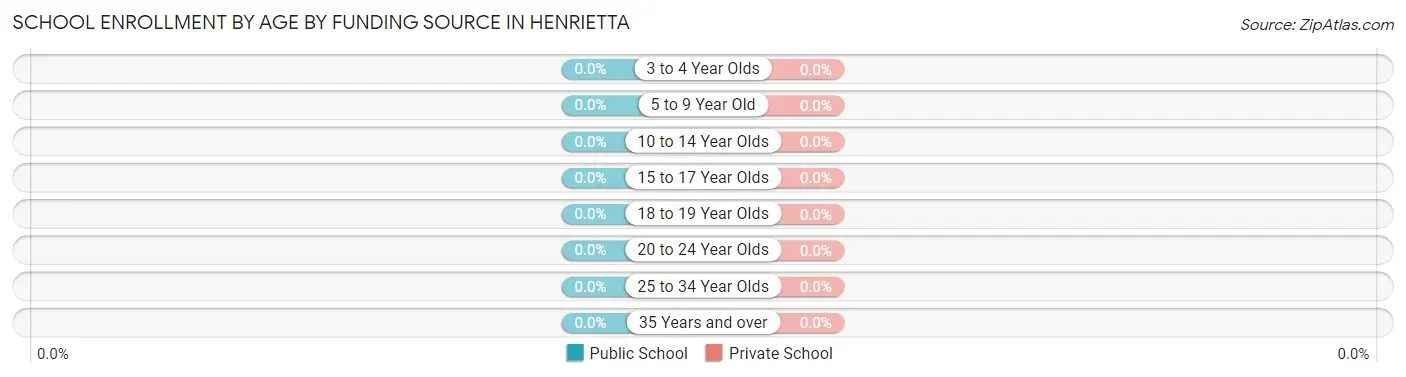
| Age Bracket | Public School | Private School |
| 3 to 4 Year Olds | 0 (0.0%) | 0 (0.0%) |
| 5 to 9 Year Old | 0 (0.0%) | 0 (0.0%) |
| 10 to 14 Year Olds | 0 (0.0%) | 0 (0.0%) |
| 15 to 17 Year Olds | 0 (0.0%) | 0 (0.0%) |
| 18 to 19 Year Olds | 0 (0.0%) | 0 (0.0%) |
| 20 to 24 Year Olds | 0 (0.0%) | 0 (0.0%) |
| 25 to 34 Year Olds | 0 (0.0%) | 0 (0.0%) |
| 35 Years and over | 0 (0.0%) | 0 (0.0%) |
| Total | 0 (0.0%) | 0 (0.0%) |
Educational Attainment by Field of Study in Henrietta
| Field of Study | # Graduates | % Graduates |
| Computers & Mathematics | 0 | 0.0% |
| Bio, Nature & Agricultural | 0 | 0.0% |
| Physical & Health Sciences | 0 | 0.0% |
| Psychology | 0 | 0.0% |
| Social Sciences | 0 | 0.0% |
| Engineering | 0 | 0.0% |
| Multidisciplinary Studies | 0 | 0.0% |
| Science & Technology | 0 | 0.0% |
| Business | 0 | 0.0% |
| Education | 0 | 0.0% |
| Literature & Languages | 0 | 0.0% |
| Liberal Arts & History | 0 | 0.0% |
| Visual & Performing Arts | 0 | 0.0% |
| Communications | 0 | 0.0% |
| Arts & Humanities | 0 | 0.0% |
| Total | 0 | 0.0% |
Transportation & Commute in Henrietta
Vehicle Availability by Sex in Henrietta
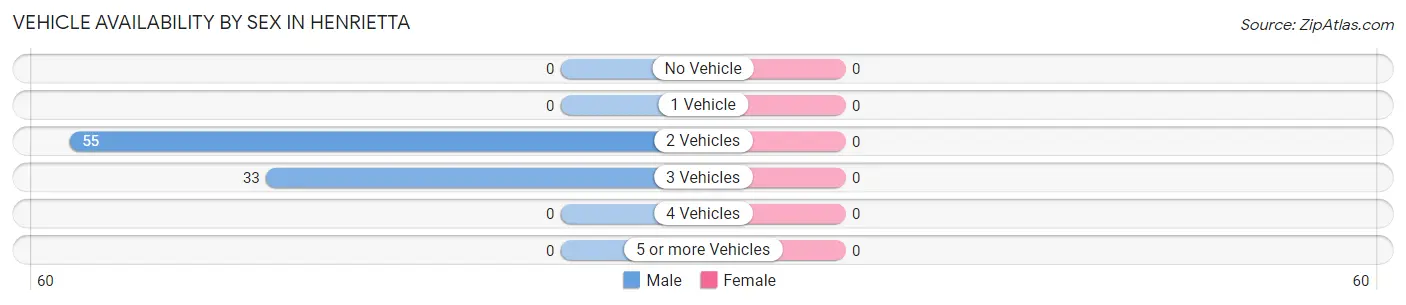
| Vehicles Available | Male | Female |
| No Vehicle | 0 (0.0%) | 0 (0.0%) |
| 1 Vehicle | 0 (0.0%) | 0 (0.0%) |
| 2 Vehicles | 55 (62.5%) | 0 (0.0%) |
| 3 Vehicles | 33 (37.5%) | 0 (0.0%) |
| 4 Vehicles | 0 (0.0%) | 0 (0.0%) |
| 5 or more Vehicles | 0 (0.0%) | 0 (0.0%) |
| Total | 88 (100.0%) | 0 (0.0%) |
Commute Time in Henrietta
The most frequently occuring commute durations in Henrietta are 30 to 34 minutes (55 commuters, 62.5%), 10 to 14 minutes (33 commuters, 37.5%), and less than 5 minutes (0 commuters, 0.0%).
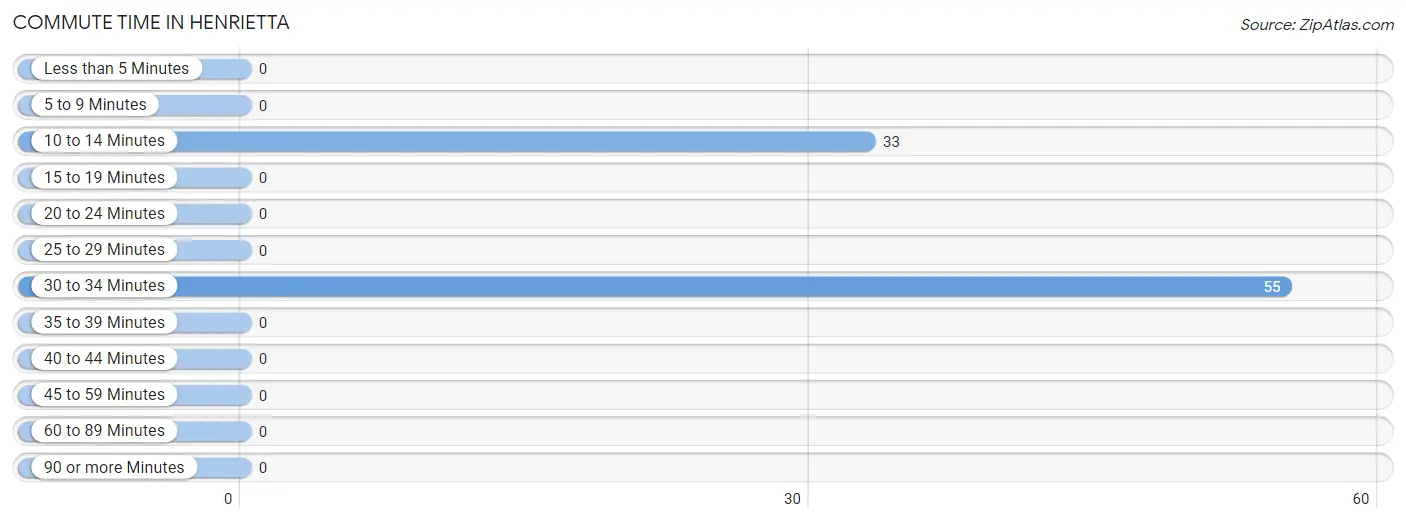
| Commute Time | # Commuters | % Commuters |
| Less than 5 Minutes | 0 | 0.0% |
| 5 to 9 Minutes | 0 | 0.0% |
| 10 to 14 Minutes | 33 | 37.5% |
| 15 to 19 Minutes | 0 | 0.0% |
| 20 to 24 Minutes | 0 | 0.0% |
| 25 to 29 Minutes | 0 | 0.0% |
| 30 to 34 Minutes | 55 | 62.5% |
| 35 to 39 Minutes | 0 | 0.0% |
| 40 to 44 Minutes | 0 | 0.0% |
| 45 to 59 Minutes | 0 | 0.0% |
| 60 to 89 Minutes | 0 | 0.0% |
| 90 or more Minutes | 0 | 0.0% |
Commute Time by Sex in Henrietta
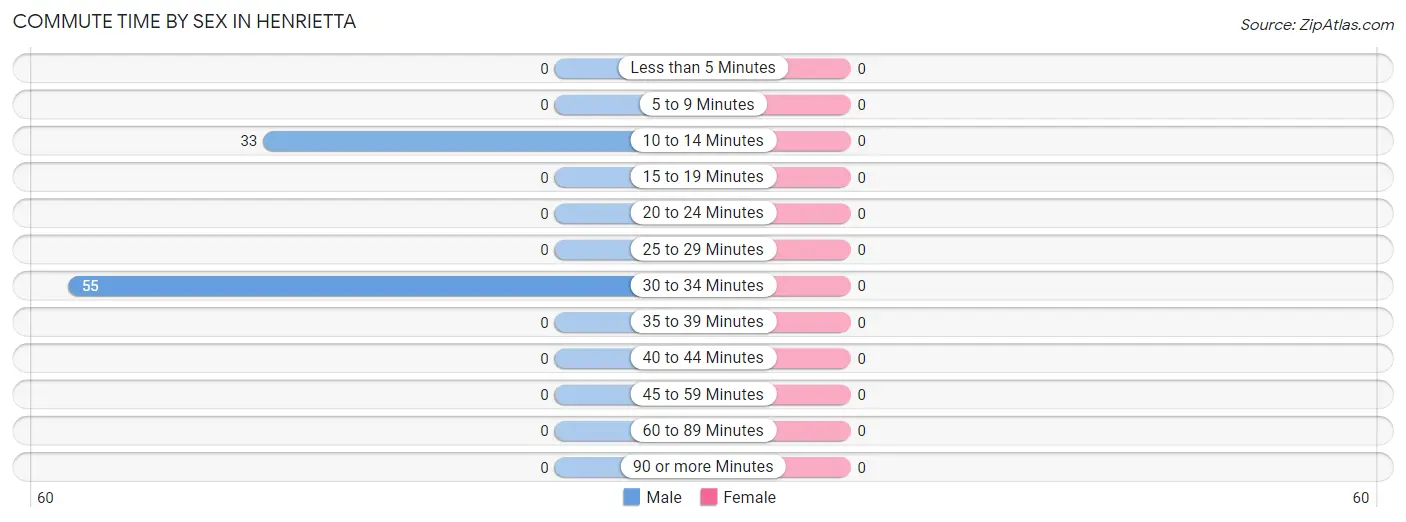
| Commute Time | Male | Female |
| Less than 5 Minutes | 0 (0.0%) | 0 (0.0%) |
| 5 to 9 Minutes | 0 (0.0%) | 0 (0.0%) |
| 10 to 14 Minutes | 33 (37.5%) | 0 (0.0%) |
| 15 to 19 Minutes | 0 (0.0%) | 0 (0.0%) |
| 20 to 24 Minutes | 0 (0.0%) | 0 (0.0%) |
| 25 to 29 Minutes | 0 (0.0%) | 0 (0.0%) |
| 30 to 34 Minutes | 55 (62.5%) | 0 (0.0%) |
| 35 to 39 Minutes | 0 (0.0%) | 0 (0.0%) |
| 40 to 44 Minutes | 0 (0.0%) | 0 (0.0%) |
| 45 to 59 Minutes | 0 (0.0%) | 0 (0.0%) |
| 60 to 89 Minutes | 0 (0.0%) | 0 (0.0%) |
| 90 or more Minutes | 0 (0.0%) | 0 (0.0%) |
Time of Departure to Work by Sex in Henrietta
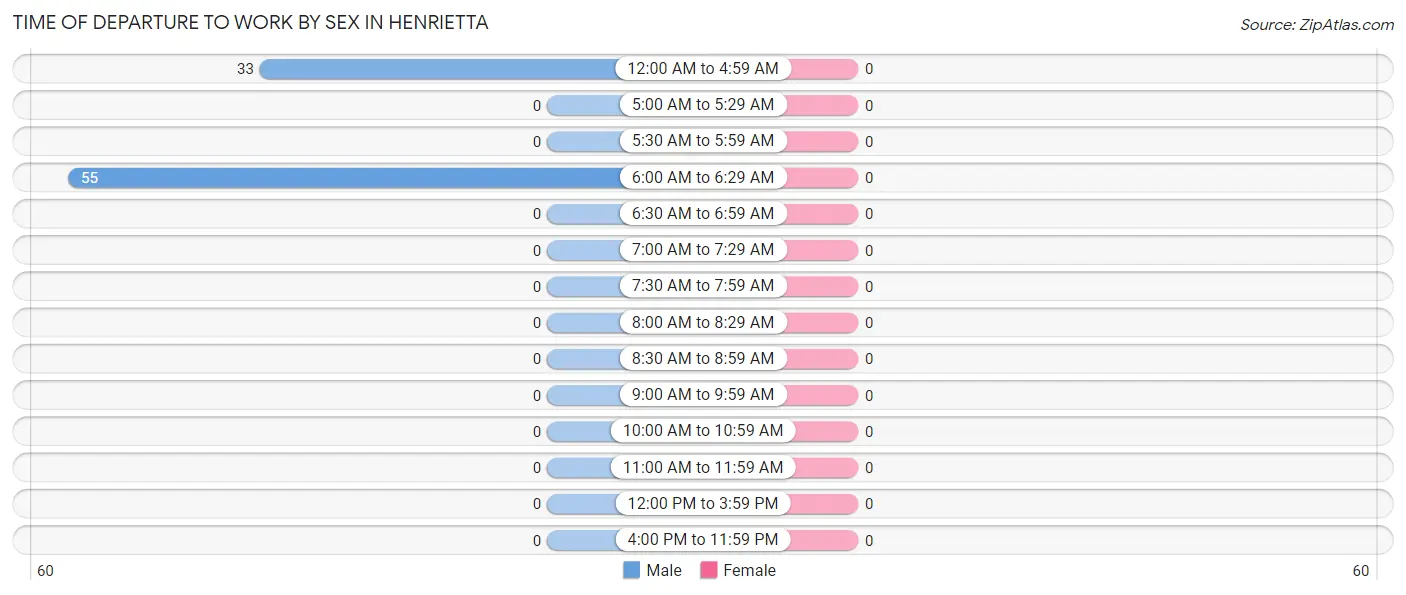
| Time of Departure | Male | Female |
| 12:00 AM to 4:59 AM | 33 (37.5%) | 0 (0.0%) |
| 5:00 AM to 5:29 AM | 0 (0.0%) | 0 (0.0%) |
| 5:30 AM to 5:59 AM | 0 (0.0%) | 0 (0.0%) |
| 6:00 AM to 6:29 AM | 55 (62.5%) | 0 (0.0%) |
| 6:30 AM to 6:59 AM | 0 (0.0%) | 0 (0.0%) |
| 7:00 AM to 7:29 AM | 0 (0.0%) | 0 (0.0%) |
| 7:30 AM to 7:59 AM | 0 (0.0%) | 0 (0.0%) |
| 8:00 AM to 8:29 AM | 0 (0.0%) | 0 (0.0%) |
| 8:30 AM to 8:59 AM | 0 (0.0%) | 0 (0.0%) |
| 9:00 AM to 9:59 AM | 0 (0.0%) | 0 (0.0%) |
| 10:00 AM to 10:59 AM | 0 (0.0%) | 0 (0.0%) |
| 11:00 AM to 11:59 AM | 0 (0.0%) | 0 (0.0%) |
| 12:00 PM to 3:59 PM | 0 (0.0%) | 0 (0.0%) |
| 4:00 PM to 11:59 PM | 0 (0.0%) | 0 (0.0%) |
| Total | 88 (100.0%) | 0 (0.0%) |
Housing Occupancy in Henrietta
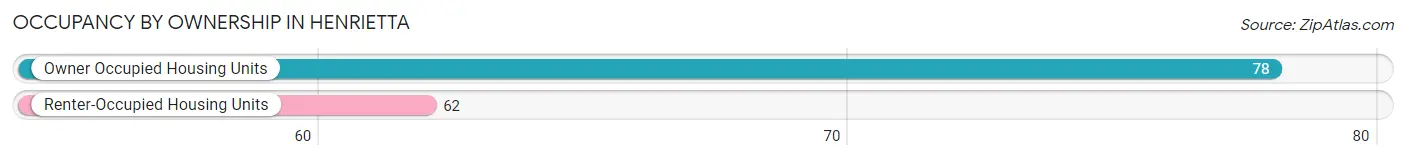
Occupancy by Ownership in Henrietta
Of the total 140 dwellings in Henrietta, owner-occupied units account for 78 (55.7%), while renter-occupied units make up 62 (44.3%).
| Occupancy | # Housing Units | % Housing Units |
| Owner Occupied Housing Units | 78 | 55.7% |
| Renter-Occupied Housing Units | 62 | 44.3% |
| Total Occupied Housing Units | 140 | 100.0% |
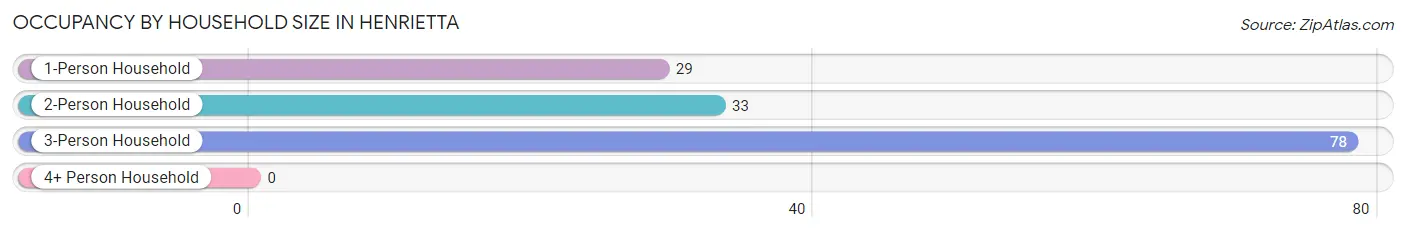
Occupancy by Household Size in Henrietta
| Household Size | # Housing Units | % Housing Units |
| 1-Person Household | 29 | 20.7% |
| 2-Person Household | 33 | 23.6% |
| 3-Person Household | 78 | 55.7% |
| 4+ Person Household | 0 | 0.0% |
| Total Housing Units | 140 | 100.0% |
Occupancy by Ownership by Household Size in Henrietta
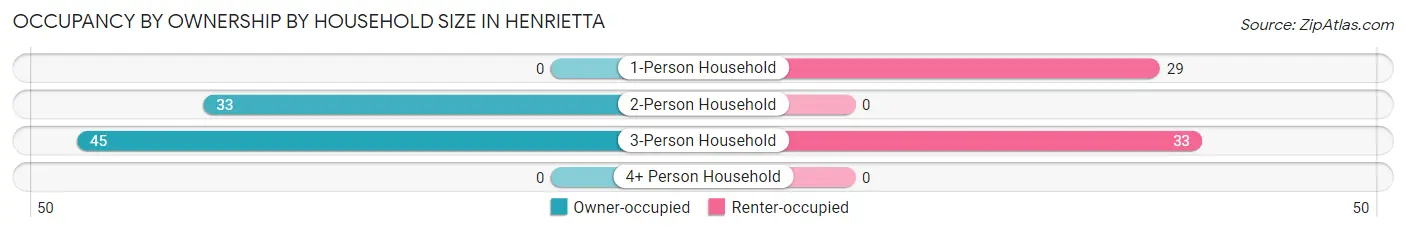
| Household Size | Owner-occupied | Renter-occupied |
| 1-Person Household | 0 (0.0%) | 29 (100.0%) |
| 2-Person Household | 33 (100.0%) | 0 (0.0%) |
| 3-Person Household | 45 (57.7%) | 33 (42.3%) |
| 4+ Person Household | 0 (0.0%) | 0 (0.0%) |
| Total Housing Units | 78 (55.7%) | 62 (44.3%) |
Occupancy by Educational Attainment in Henrietta
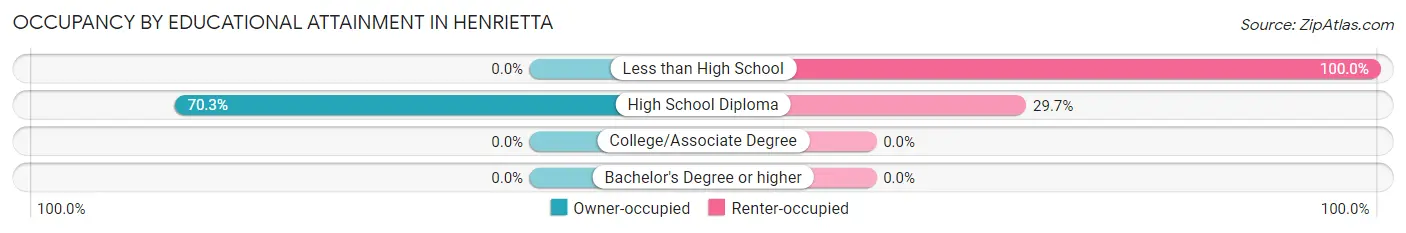
| Household Size | Owner-occupied | Renter-occupied |
| Less than High School | 0 (0.0%) | 29 (100.0%) |
| High School Diploma | 78 (70.3%) | 33 (29.7%) |
| College/Associate Degree | 0 (0.0%) | 0 (0.0%) |
| Bachelor's Degree or higher | 0 (0.0%) | 0 (0.0%) |
Occupancy by Age of Householder in Henrietta
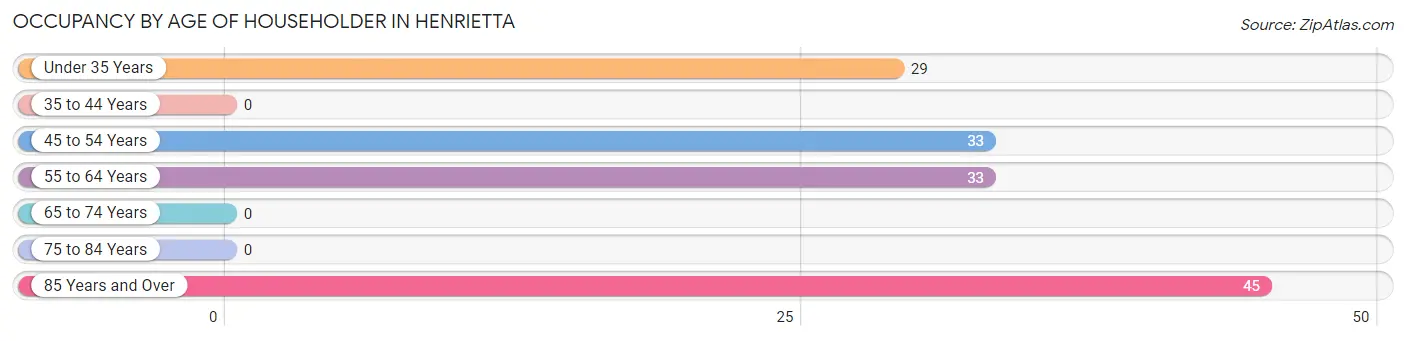
| Age Bracket | # Households | % Households |
| Under 35 Years | 29 | 20.7% |
| 35 to 44 Years | 0 | 0.0% |
| 45 to 54 Years | 33 | 23.6% |
| 55 to 64 Years | 33 | 23.6% |
| 65 to 74 Years | 0 | 0.0% |
| 75 to 84 Years | 0 | 0.0% |
| 85 Years and Over | 45 | 32.1% |
| Total | 140 | 100.0% |
Housing Finances in Henrietta
Median Income by Occupancy in Henrietta
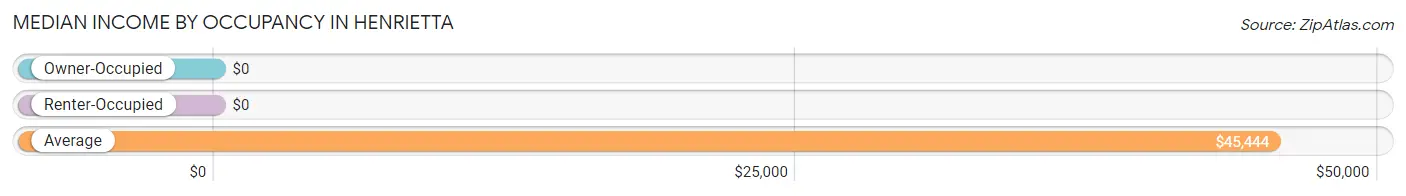
| Occupancy Type | # Households | Median Income |
| Owner-Occupied | 78 (55.7%) | $0 |
| Renter-Occupied | 62 (44.3%) | $0 |
| Average | 140 (100.0%) | $45,444 |
Occupancy by Householder Income Bracket in Henrietta
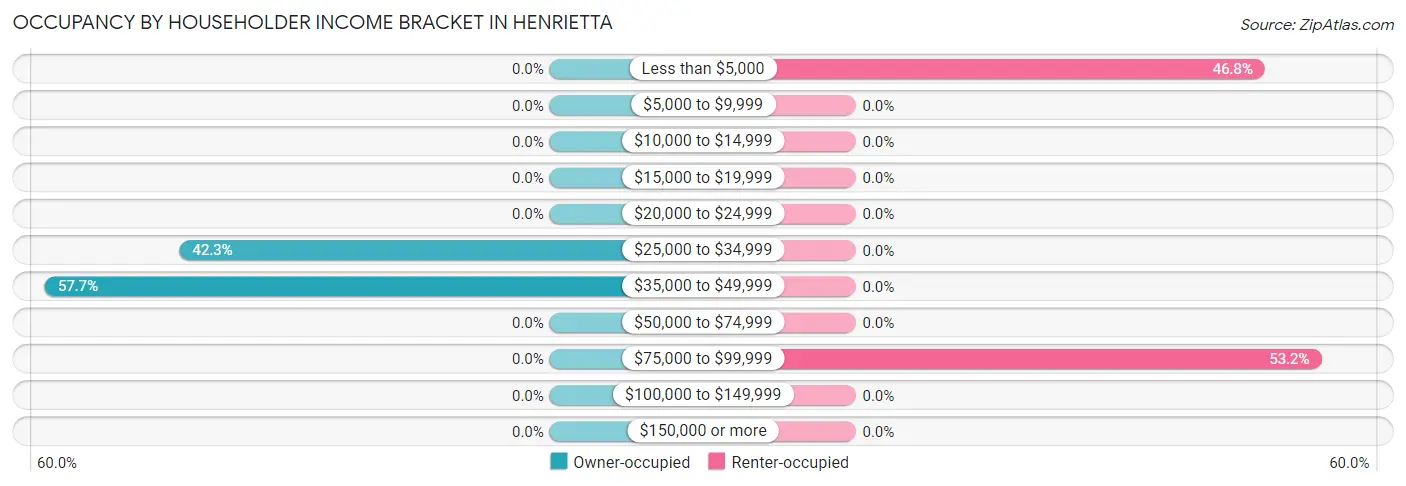
| Income Bracket | Owner-occupied | Renter-occupied |
| Less than $5,000 | 0 (0.0%) | 29 (46.8%) |
| $5,000 to $9,999 | 0 (0.0%) | 0 (0.0%) |
| $10,000 to $14,999 | 0 (0.0%) | 0 (0.0%) |
| $15,000 to $19,999 | 0 (0.0%) | 0 (0.0%) |
| $20,000 to $24,999 | 0 (0.0%) | 0 (0.0%) |
| $25,000 to $34,999 | 33 (42.3%) | 0 (0.0%) |
| $35,000 to $49,999 | 45 (57.7%) | 0 (0.0%) |
| $50,000 to $74,999 | 0 (0.0%) | 0 (0.0%) |
| $75,000 to $99,999 | 0 (0.0%) | 33 (53.2%) |
| $100,000 to $149,999 | 0 (0.0%) | 0 (0.0%) |
| $150,000 or more | 0 (0.0%) | 0 (0.0%) |
| Total | 78 (100.0%) | 62 (100.0%) |
Monthly Housing Cost Tiers in Henrietta
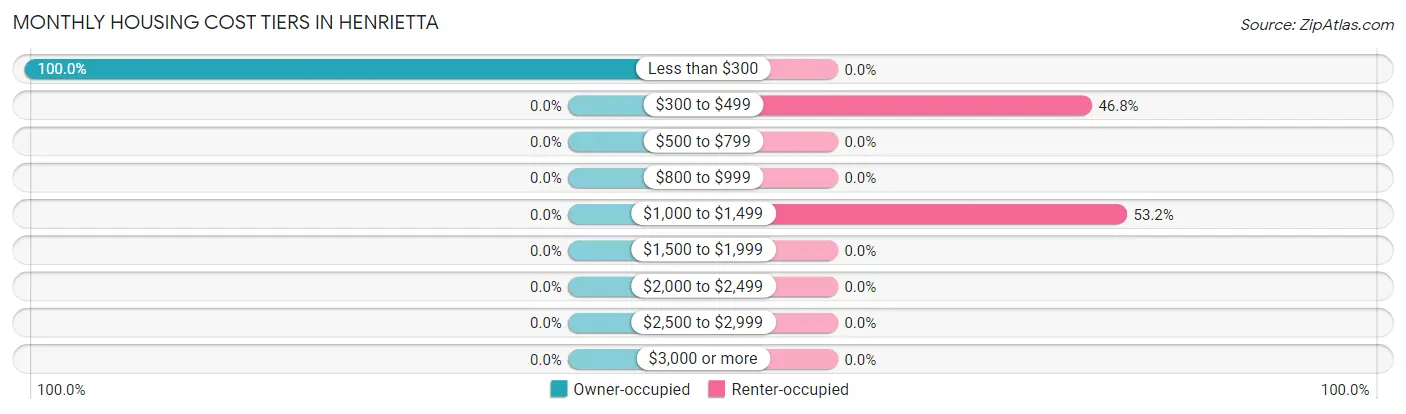
| Monthly Cost | Owner-occupied | Renter-occupied |
| Less than $300 | 78 (100.0%) | 0 (0.0%) |
| $300 to $499 | 0 (0.0%) | 29 (46.8%) |
| $500 to $799 | 0 (0.0%) | 0 (0.0%) |
| $800 to $999 | 0 (0.0%) | 0 (0.0%) |
| $1,000 to $1,499 | 0 (0.0%) | 33 (53.2%) |
| $1,500 to $1,999 | 0 (0.0%) | 0 (0.0%) |
| $2,000 to $2,499 | 0 (0.0%) | 0 (0.0%) |
| $2,500 to $2,999 | 0 (0.0%) | 0 (0.0%) |
| $3,000 or more | 0 (0.0%) | 0 (0.0%) |
| Total | 78 (100.0%) | 62 (100.0%) |
Physical Housing Characteristics in Henrietta
Housing Structures in Henrietta
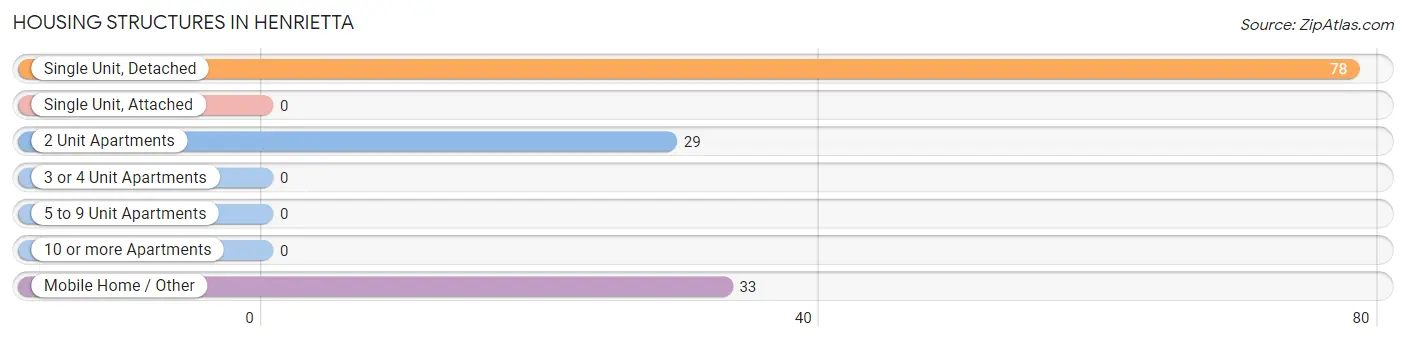
| Structure Type | # Housing Units | % Housing Units |
| Single Unit, Detached | 78 | 55.7% |
| Single Unit, Attached | 0 | 0.0% |
| 2 Unit Apartments | 29 | 20.7% |
| 3 or 4 Unit Apartments | 0 | 0.0% |
| 5 to 9 Unit Apartments | 0 | 0.0% |
| 10 or more Apartments | 0 | 0.0% |
| Mobile Home / Other | 33 | 23.6% |
| Total | 140 | 100.0% |
Housing Structures by Occupancy in Henrietta
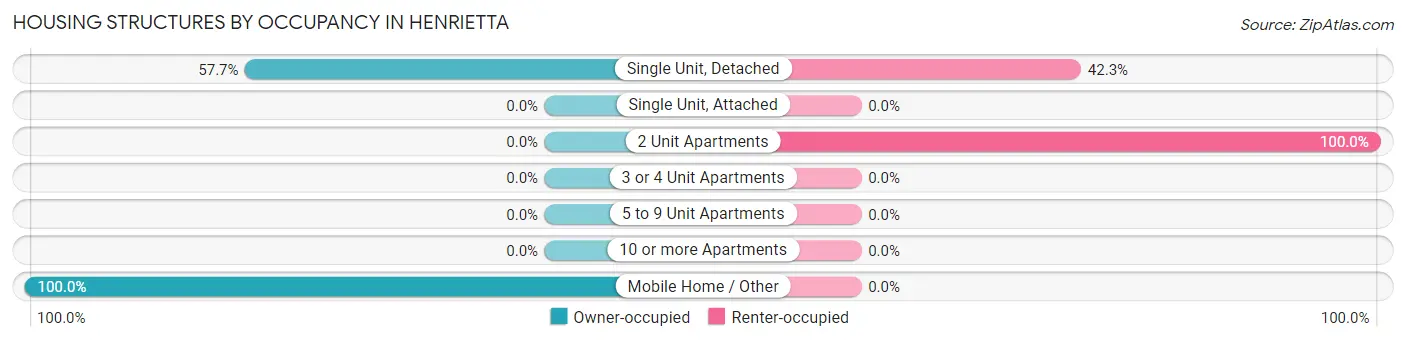
| Structure Type | Owner-occupied | Renter-occupied |
| Single Unit, Detached | 45 (57.7%) | 33 (42.3%) |
| Single Unit, Attached | 0 (0.0%) | 0 (0.0%) |
| 2 Unit Apartments | 0 (0.0%) | 29 (100.0%) |
| 3 or 4 Unit Apartments | 0 (0.0%) | 0 (0.0%) |
| 5 to 9 Unit Apartments | 0 (0.0%) | 0 (0.0%) |
| 10 or more Apartments | 0 (0.0%) | 0 (0.0%) |
| Mobile Home / Other | 33 (100.0%) | 0 (0.0%) |
| Total | 78 (55.7%) | 62 (44.3%) |
Housing Structures by Number of Rooms in Henrietta
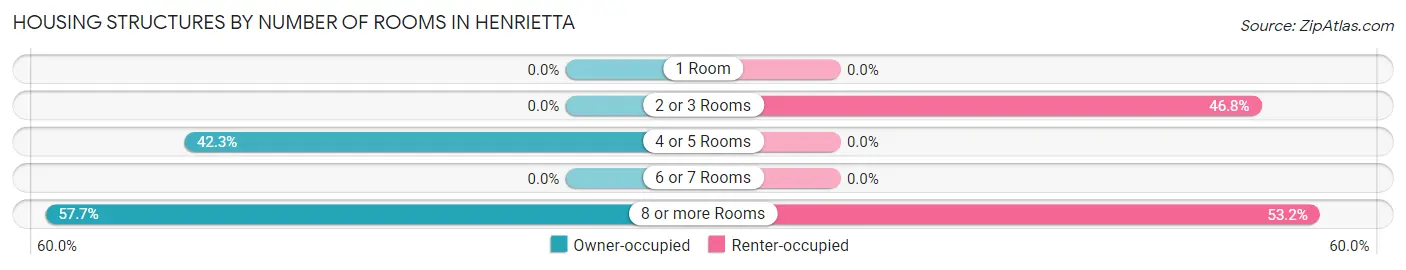
| Number of Rooms | Owner-occupied | Renter-occupied |
| 1 Room | 0 (0.0%) | 0 (0.0%) |
| 2 or 3 Rooms | 0 (0.0%) | 29 (46.8%) |
| 4 or 5 Rooms | 33 (42.3%) | 0 (0.0%) |
| 6 or 7 Rooms | 0 (0.0%) | 0 (0.0%) |
| 8 or more Rooms | 45 (57.7%) | 33 (53.2%) |
| Total | 78 (100.0%) | 62 (100.0%) |
Housing Structure by Heating Type in Henrietta
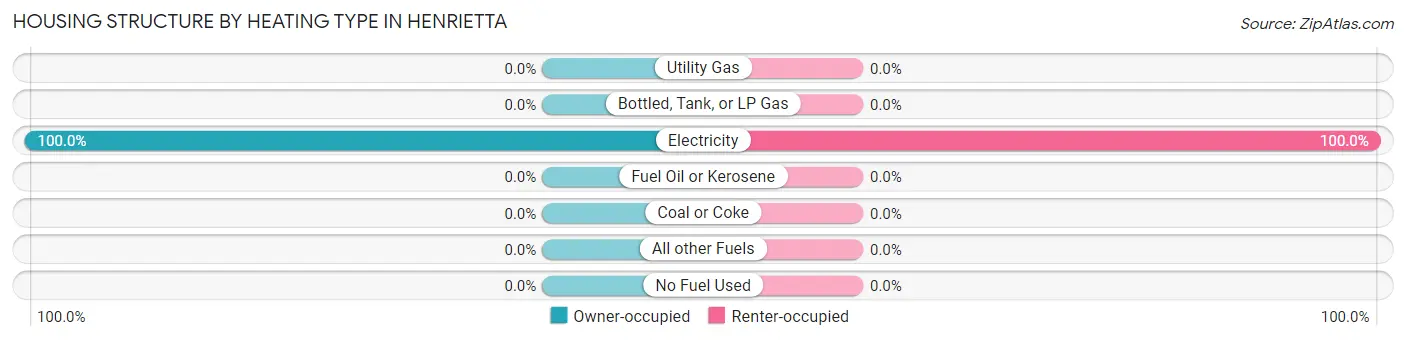
| Heating Type | Owner-occupied | Renter-occupied |
| Utility Gas | 0 (0.0%) | 0 (0.0%) |
| Bottled, Tank, or LP Gas | 0 (0.0%) | 0 (0.0%) |
| Electricity | 78 (100.0%) | 62 (100.0%) |
| Fuel Oil or Kerosene | 0 (0.0%) | 0 (0.0%) |
| Coal or Coke | 0 (0.0%) | 0 (0.0%) |
| All other Fuels | 0 (0.0%) | 0 (0.0%) |
| No Fuel Used | 0 (0.0%) | 0 (0.0%) |
| Total | 78 (100.0%) | 62 (100.0%) |
Household Vehicle Usage in Henrietta
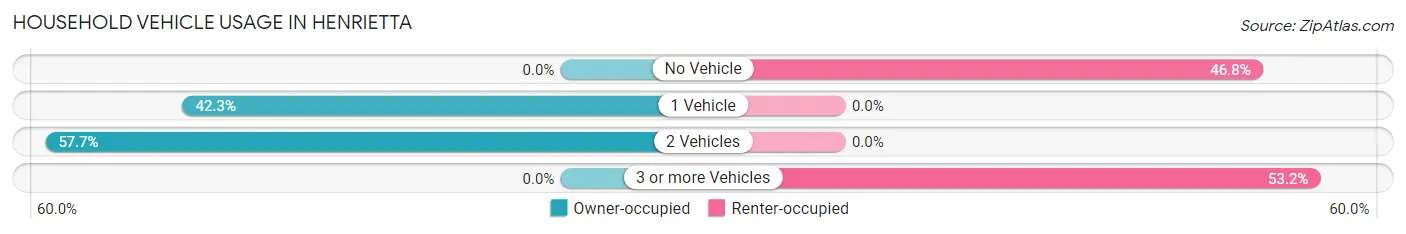
| Vehicles per Household | Owner-occupied | Renter-occupied |
| No Vehicle | 0 (0.0%) | 29 (46.8%) |
| 1 Vehicle | 33 (42.3%) | 0 (0.0%) |
| 2 Vehicles | 45 (57.7%) | 0 (0.0%) |
| 3 or more Vehicles | 0 (0.0%) | 33 (53.2%) |
| Total | 78 (100.0%) | 62 (100.0%) |
Real Estate & Mortgages in Henrietta
Real Estate and Mortgage Overview in Henrietta
| Characteristic | Without Mortgage | With Mortgage |
| Housing Units | 78 | 0 |
| Median Property Value | - | - |
| Median Household Income | - | - |
| Monthly Housing Costs | - | - |
| Real Estate Taxes | - | - |
Property Value by Mortgage Status in Henrietta
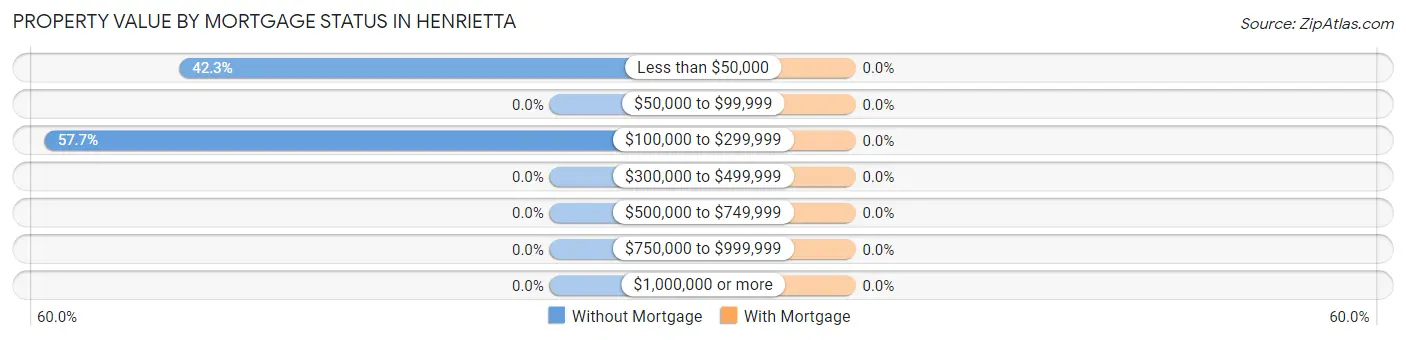
| Property Value | Without Mortgage | With Mortgage |
| Less than $50,000 | 33 (42.3%) | 0 (0.0%) |
| $50,000 to $99,999 | 0 (0.0%) | 0 (0.0%) |
| $100,000 to $299,999 | 45 (57.7%) | 0 (0.0%) |
| $300,000 to $499,999 | 0 (0.0%) | 0 (0.0%) |
| $500,000 to $749,999 | 0 (0.0%) | 0 (0.0%) |
| $750,000 to $999,999 | 0 (0.0%) | 0 (0.0%) |
| $1,000,000 or more | 0 (0.0%) | 0 (0.0%) |
| Total | 78 (100.0%) | 0 (0.0%) |
Household Income by Mortgage Status in Henrietta
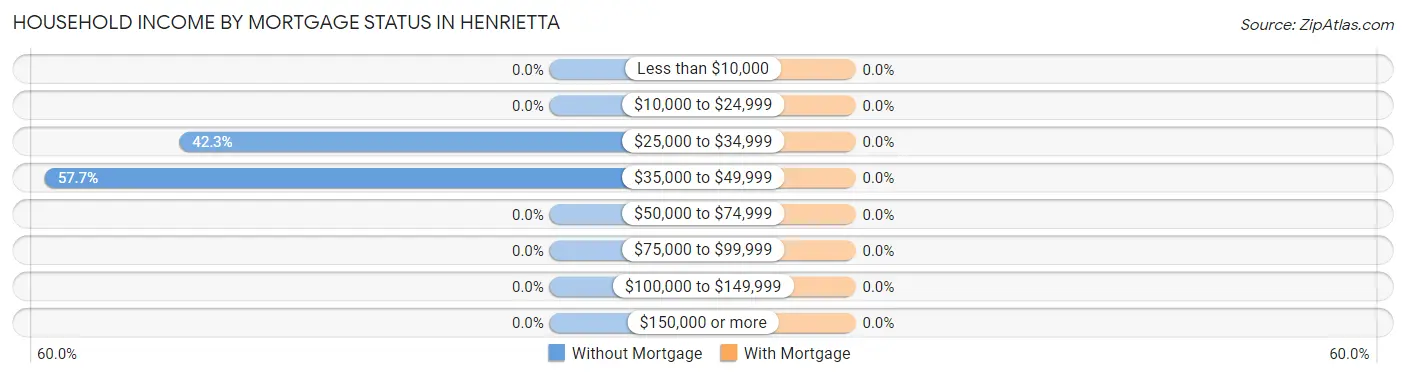
| Household Income | Without Mortgage | With Mortgage |
| Less than $10,000 | 0 (0.0%) | 0 (0.0%) |
| $10,000 to $24,999 | 0 (0.0%) | 0 (0.0%) |
| $25,000 to $34,999 | 33 (42.3%) | 0 (0.0%) |
| $35,000 to $49,999 | 45 (57.7%) | 0 (0.0%) |
| $50,000 to $74,999 | 0 (0.0%) | 0 (0.0%) |
| $75,000 to $99,999 | 0 (0.0%) | 0 (0.0%) |
| $100,000 to $149,999 | 0 (0.0%) | 0 (0.0%) |
| $150,000 or more | 0 (0.0%) | 0 (0.0%) |
| Total | 78 (100.0%) | 0 (0.0%) |
Property Value to Household Income Ratio in Henrietta
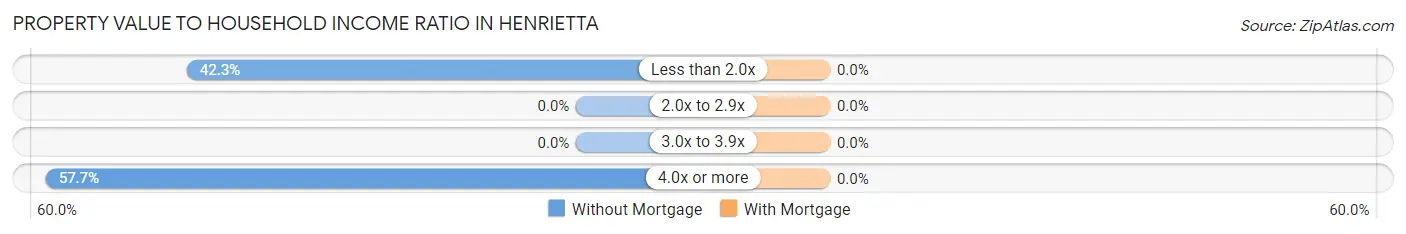
| Value-to-Income Ratio | Without Mortgage | With Mortgage |
| Less than 2.0x | 33 (42.3%) | 0 (0.0%) |
| 2.0x to 2.9x | 0 (0.0%) | 0 (0.0%) |
| 3.0x to 3.9x | 0 (0.0%) | 0 (0.0%) |
| 4.0x or more | 45 (57.7%) | 0 (0.0%) |
| Total | 78 (100.0%) | 0 (0.0%) |
Real Estate Taxes by Mortgage Status in Henrietta
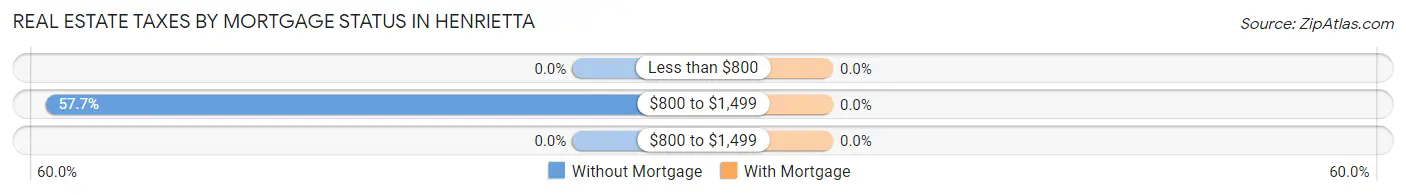
| Property Taxes | Without Mortgage | With Mortgage |
| Less than $800 | 0 (0.0%) | 0 (0.0%) |
| $800 to $1,499 | 45 (57.7%) | 0 (0.0%) |
| $800 to $1,499 | 0 (0.0%) | 0 (0.0%) |
| Total | 78 (100.0%) | 0 (0.0%) |
Health & Disability in Henrietta
Health Insurance Coverage by Age in Henrietta
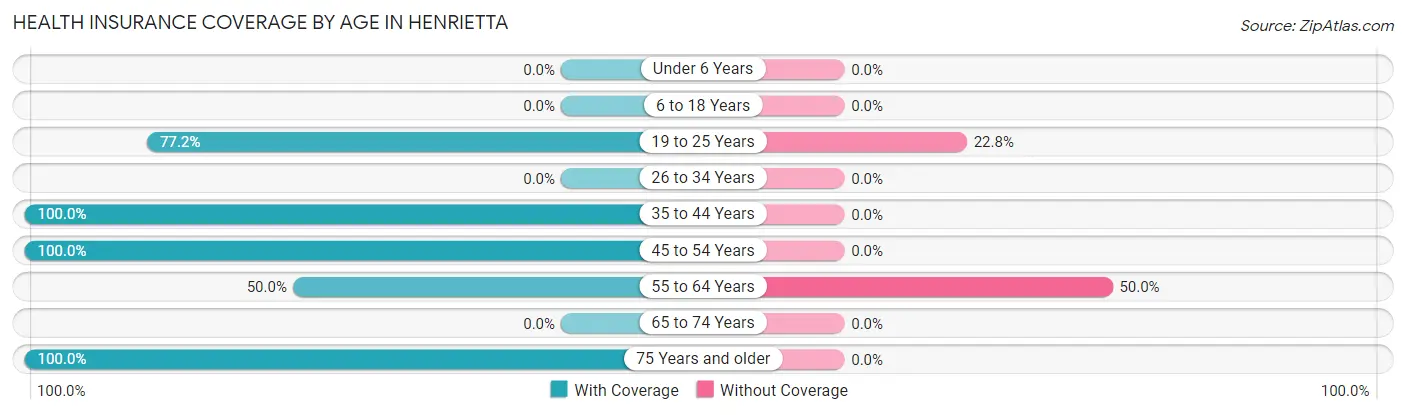
| Age Bracket | With Coverage | Without Coverage |
| Under 6 Years | 0 (0.0%) | 0 (0.0%) |
| 6 to 18 Years | 0 (0.0%) | 0 (0.0%) |
| 19 to 25 Years | 98 (77.2%) | 29 (22.8%) |
| 26 to 34 Years | 0 (0.0%) | 0 (0.0%) |
| 35 to 44 Years | 33 (100.0%) | 0 (0.0%) |
| 45 to 54 Years | 33 (100.0%) | 0 (0.0%) |
| 55 to 64 Years | 40 (50.0%) | 40 (50.0%) |
| 65 to 74 Years | 0 (0.0%) | 0 (0.0%) |
| 75 Years and older | 68 (100.0%) | 0 (0.0%) |
| Total | 272 (79.8%) | 69 (20.2%) |
Health Insurance Coverage by Citizenship Status in Henrietta
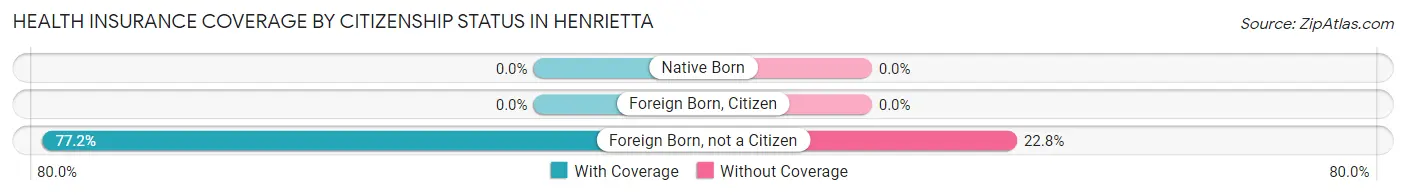
| Citizenship Status | With Coverage | Without Coverage |
| Native Born | 0 (0.0%) | 0 (0.0%) |
| Foreign Born, Citizen | 0 (0.0%) | 0 (0.0%) |
| Foreign Born, not a Citizen | 98 (77.2%) | 29 (22.8%) |
Health Insurance Coverage by Household Income in Henrietta
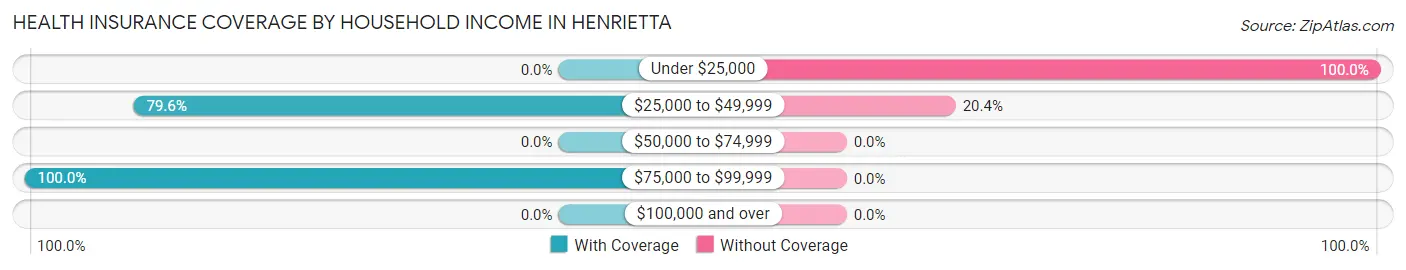
| Household Income | With Coverage | Without Coverage |
| Under $25,000 | 0 (0.0%) | 29 (100.0%) |
| $25,000 to $49,999 | 156 (79.6%) | 40 (20.4%) |
| $50,000 to $74,999 | 0 (0.0%) | 0 (0.0%) |
| $75,000 to $99,999 | 109 (100.0%) | 0 (0.0%) |
| $100,000 and over | 0 (0.0%) | 0 (0.0%) |
Public vs Private Health Insurance Coverage by Age in Henrietta
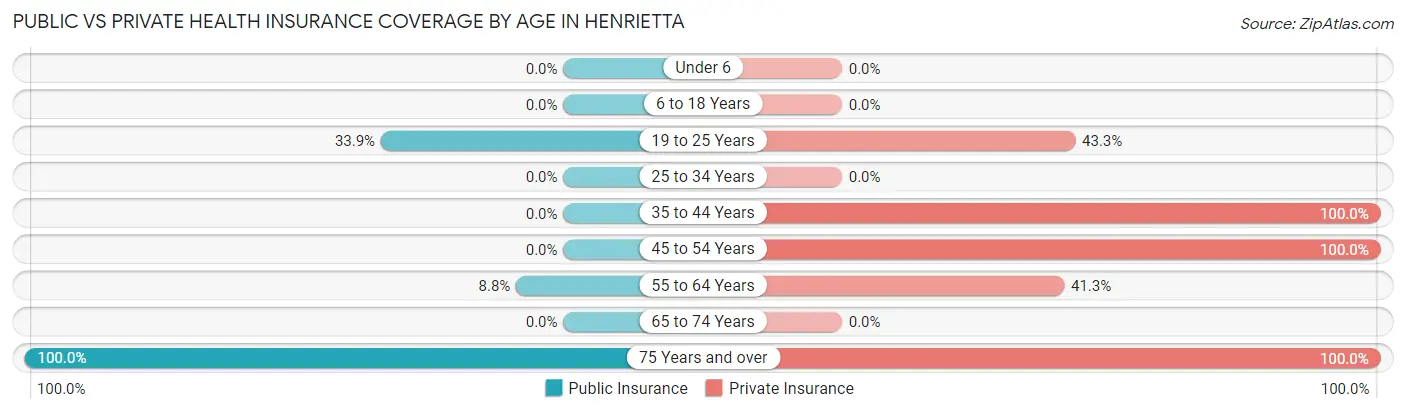
| Age Bracket | Public Insurance | Private Insurance |
| Under 6 | 0 (0.0%) | 0 (0.0%) |
| 6 to 18 Years | 0 (0.0%) | 0 (0.0%) |
| 19 to 25 Years | 43 (33.9%) | 55 (43.3%) |
| 25 to 34 Years | 0 (0.0%) | 0 (0.0%) |
| 35 to 44 Years | 0 (0.0%) | 33 (100.0%) |
| 45 to 54 Years | 0 (0.0%) | 33 (100.0%) |
| 55 to 64 Years | 7 (8.7%) | 33 (41.2%) |
| 65 to 74 Years | 0 (0.0%) | 0 (0.0%) |
| 75 Years and over | 68 (100.0%) | 68 (100.0%) |
| Total | 118 (34.6%) | 222 (65.1%) |
Disability Status by Sex by Age in Henrietta
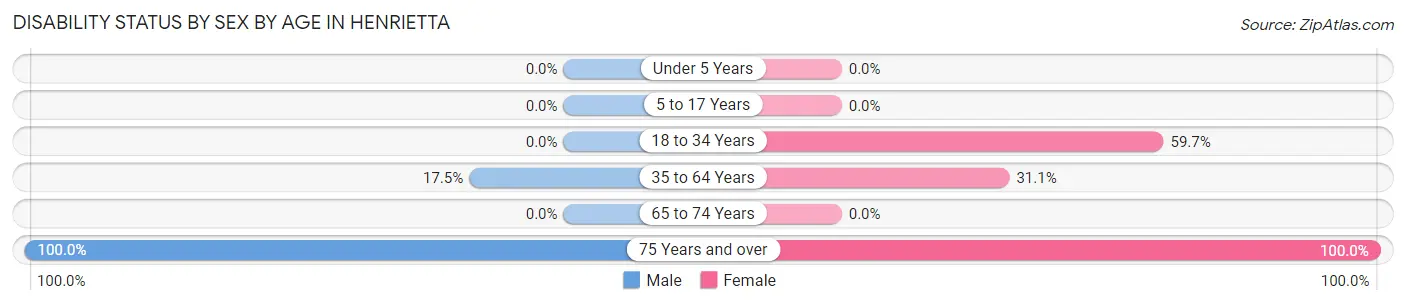
| Age Bracket | Male | Female |
| Under 5 Years | 0 (0.0%) | 0 (0.0%) |
| 5 to 17 Years | 0 (0.0%) | 0 (0.0%) |
| 18 to 34 Years | 0 (0.0%) | 43 (59.7%) |
| 35 to 64 Years | 7 (17.5%) | 33 (31.1%) |
| 65 to 74 Years | 0 (0.0%) | 0 (0.0%) |
| 75 Years and over | 23 (100.0%) | 45 (100.0%) |
Disability Class by Sex by Age in Henrietta
Disability Class: Hearing Difficulty
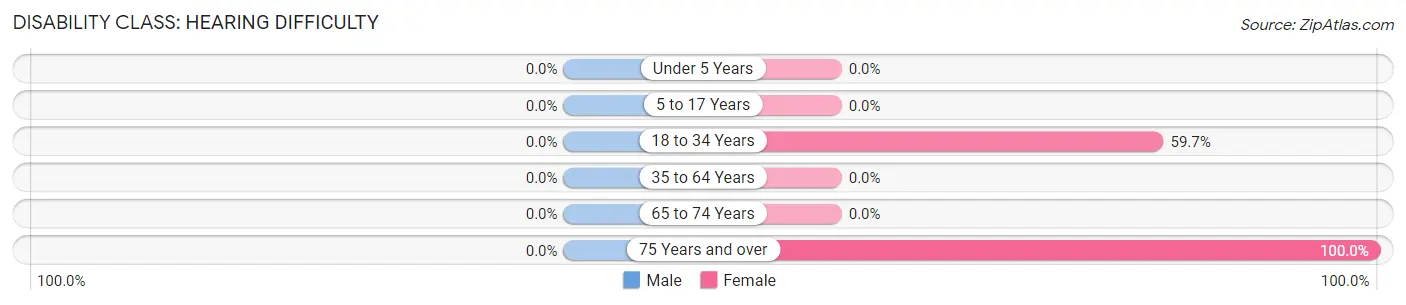
| Age Bracket | Male | Female |
| Under 5 Years | 0 (0.0%) | 0 (0.0%) |
| 5 to 17 Years | 0 (0.0%) | 0 (0.0%) |
| 18 to 34 Years | 0 (0.0%) | 43 (59.7%) |
| 35 to 64 Years | 0 (0.0%) | 0 (0.0%) |
| 65 to 74 Years | 0 (0.0%) | 0 (0.0%) |
| 75 Years and over | 0 (0.0%) | 45 (100.0%) |
Disability Class: Vision Difficulty
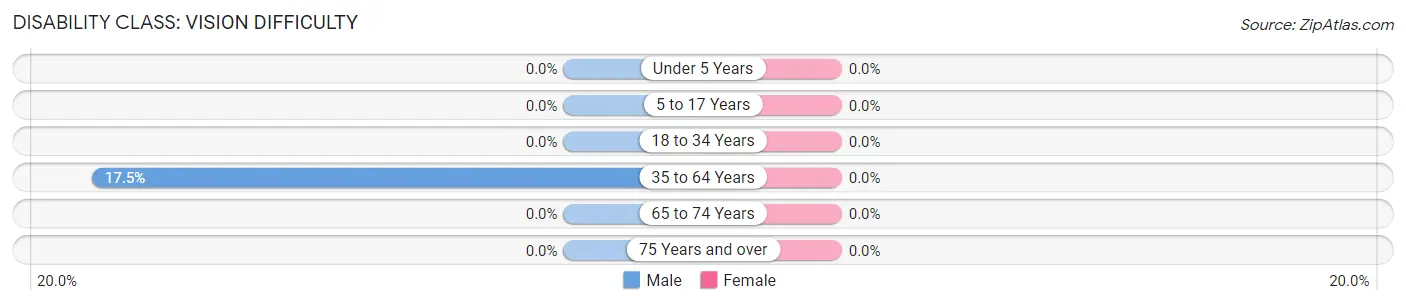
| Age Bracket | Male | Female |
| Under 5 Years | 0 (0.0%) | 0 (0.0%) |
| 5 to 17 Years | 0 (0.0%) | 0 (0.0%) |
| 18 to 34 Years | 0 (0.0%) | 0 (0.0%) |
| 35 to 64 Years | 7 (17.5%) | 0 (0.0%) |
| 65 to 74 Years | 0 (0.0%) | 0 (0.0%) |
| 75 Years and over | 0 (0.0%) | 0 (0.0%) |
Disability Class: Cognitive Difficulty
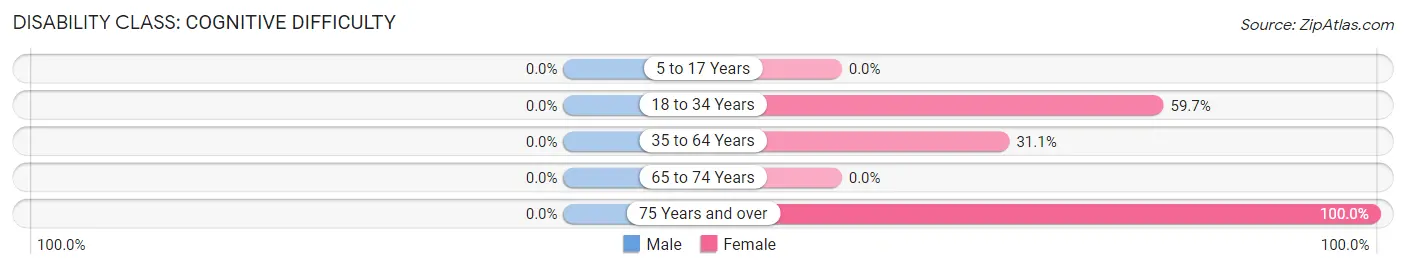
| Age Bracket | Male | Female |
| 5 to 17 Years | 0 (0.0%) | 0 (0.0%) |
| 18 to 34 Years | 0 (0.0%) | 43 (59.7%) |
| 35 to 64 Years | 0 (0.0%) | 33 (31.1%) |
| 65 to 74 Years | 0 (0.0%) | 0 (0.0%) |
| 75 Years and over | 0 (0.0%) | 45 (100.0%) |
Disability Class: Ambulatory Difficulty
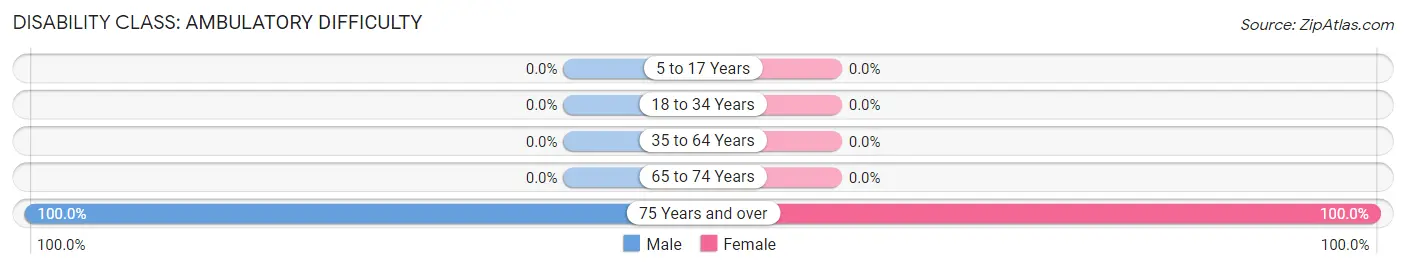
| Age Bracket | Male | Female |
| 5 to 17 Years | 0 (0.0%) | 0 (0.0%) |
| 18 to 34 Years | 0 (0.0%) | 0 (0.0%) |
| 35 to 64 Years | 0 (0.0%) | 0 (0.0%) |
| 65 to 74 Years | 0 (0.0%) | 0 (0.0%) |
| 75 Years and over | 23 (100.0%) | 45 (100.0%) |
Disability Class: Self-Care Difficulty
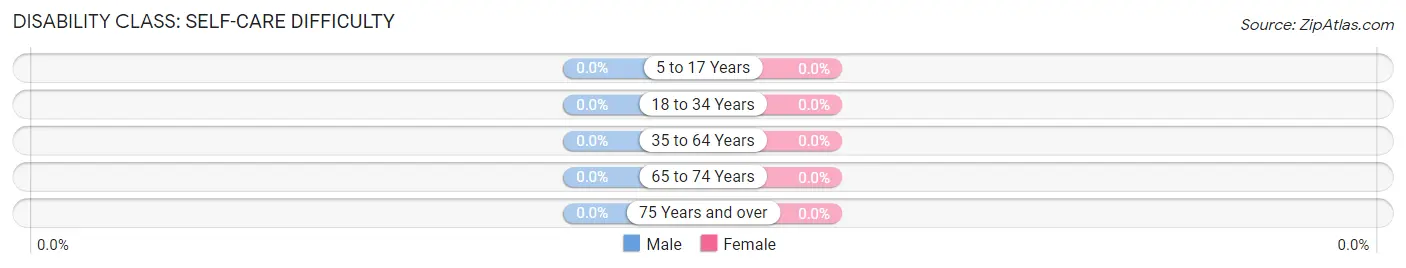
| Age Bracket | Male | Female |
| 5 to 17 Years | 0 (0.0%) | 0 (0.0%) |
| 18 to 34 Years | 0 (0.0%) | 0 (0.0%) |
| 35 to 64 Years | 0 (0.0%) | 0 (0.0%) |
| 65 to 74 Years | 0 (0.0%) | 0 (0.0%) |
| 75 Years and over | 0 (0.0%) | 0 (0.0%) |
Technology Access in Henrietta
Computing Device Access in Henrietta
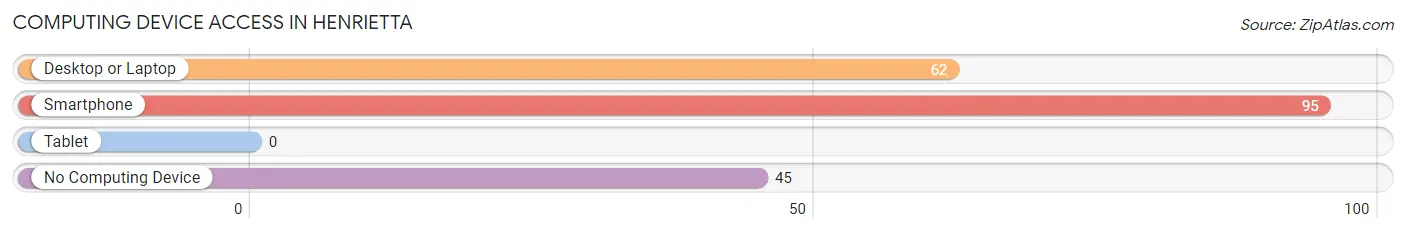
| Device Type | # Households | % Households |
| Desktop or Laptop | 62 | 44.3% |
| Smartphone | 95 | 67.9% |
| Tablet | 0 | 0.0% |
| No Computing Device | 45 | 32.1% |
| Total | 140 | 100.0% |
Internet Access in Henrietta
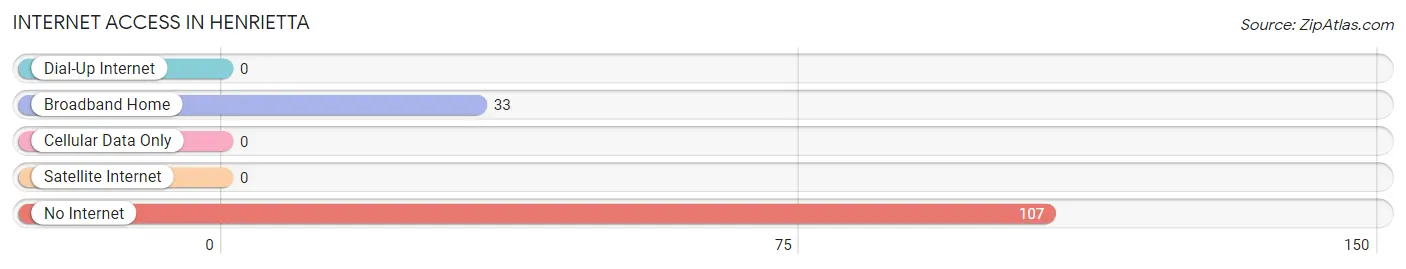
| Internet Type | # Households | % Households |
| Dial-Up Internet | 0 | 0.0% |
| Broadband Home | 33 | 23.6% |
| Cellular Data Only | 0 | 0.0% |
| Satellite Internet | 0 | 0.0% |
| No Internet | 107 | 76.4% |
| Total | 140 | 100.0% |
Henrietta Summary
Henrietta is a small town located in the foothills of the Blue Ridge Mountains in North Carolina. It is situated in the southwestern corner of the state, about 25 miles east of Asheville. The town was founded in 1883 and named after the daughter of the first postmaster, Henry H. Hensley.
Geography
Henrietta is located in the foothills of the Blue Ridge Mountains in western North Carolina. It is situated in the southwestern corner of the state, about 25 miles east of Asheville. The town is located in the Piedmont region of the state, which is characterized by rolling hills and valleys. The town is situated at an elevation of 1,400 feet above sea level. The town is surrounded by the towns of Rutherfordton, Forest City, and Spindale.
The town is located in the Catawba River watershed, which is part of the larger Yadkin-Pee Dee River Basin. The Catawba River is the main source of water for the town. The town is also located near the South Mountains State Park, which offers a variety of outdoor activities such as hiking, camping, and fishing.
Economy
Henrietta’s economy is largely based on agriculture and manufacturing. The town is home to several small businesses, including a furniture factory, a textile mill, and a lumber mill. The town is also home to a number of farms, which produce a variety of crops, including corn, soybeans, and tobacco.
The town is also home to a number of retail stores, including a grocery store, a hardware store, and a pharmacy. The town is also home to a number of restaurants, including a pizza parlor, a Mexican restaurant, and a Chinese restaurant.
Demographics
As of the 2010 census, the population of Henrietta was 1,845. The town is predominantly white, with a population that is 94.3% white, 2.2% African American, 0.7% Native American, 0.3% Asian, and 2.5% other. The median household income in the town is $35,000, and the median age is 41.
Conclusion
Henrietta is a small town located in the foothills of the Blue Ridge Mountains in western North Carolina. It is situated in the southwestern corner of the state, about 25 miles east of Asheville. The town was founded in 1883 and named after the daughter of the first postmaster, Henry H. Hensley. The town’s economy is largely based on agriculture and manufacturing, and the town is home to a number of small businesses, farms, and retail stores. The population of Henrietta is predominantly white, with a median household income of $35,000 and a median age of 41.
Common Questions
What is Per Capita Income in Henrietta?
Per Capita income in Henrietta is $16,529.
What is the Median Household income in Henrietta?
Median Household Income in Henrietta is $45,444.
What is Inequality or Gini Index in Henrietta?
Inequality or Gini Index in Henrietta is 0.35.
What is the Total Population of Henrietta?
Total Population of Henrietta is 341.
What is the Total Male Population of Henrietta?
Total Male Population of Henrietta is 118.
What is the Total Female Population of Henrietta?
Total Female Population of Henrietta is 223.
What is the Ratio of Males per 100 Females in Henrietta?
There are 52.91 Males per 100 Females in Henrietta.
What is the Ratio of Females per 100 Males in Henrietta?
There are 188.98 Females per 100 Males in Henrietta.
What is the Median Population Age in Henrietta?
Median Population Age in Henrietta is 49.3 Years.
What is the Average Family Size in Henrietta
Average Family Size in Henrietta is 3.0 People.
What is the Average Household Size in Henrietta
Average Household Size in Henrietta is 2.4 People.
How Large is the Labor Force in Henrietta?
There are 88 People in the Labor Forcein in Henrietta.
What is the Percentage of People in the Labor Force in Henrietta?
25.8% of People are in the Labor Force in Henrietta.