Boone, NC Map & Demographics
Boone Map
Boone Overview
$15,722
PER CAPITA INCOME
$77,901
AVG FAMILY INCOME
$28,242
AVG HOUSEHOLD INCOME
27.2%
WAGE / INCOME GAP [ % ]
72.8¢/ $1
WAGE / INCOME GAP [ $ ]
0.57
INEQUALITY / GINI INDEX
19,368
TOTAL POPULATION
8,874
MALE POPULATION
10,494
FEMALE POPULATION
84.56
MALES / 100 FEMALES
118.26
FEMALES / 100 MALES
21.4
MEDIAN AGE
2.8
AVG FAMILY SIZE
2.4
AVG HOUSEHOLD SIZE
9,943
LABOR FORCE [ PEOPLE ]
53.6%
PERCENT IN LABOR FORCE
16.6%
UNEMPLOYMENT RATE
Boone Zip Codes
Boone Area Codes
Income in Boone
Income Overview in Boone
Per Capita Income in Boone is $15,722, while median incomes of families and households are $77,901 and $28,242 respectively.
| Characteristic | Number | Measure |
| Per Capita Income | 19,368 | $15,722 |
| Median Family Income | 1,497 | $77,901 |
| Mean Family Income | 1,497 | $95,055 |
| Median Household Income | 5,839 | $28,242 |
| Mean Household Income | 5,839 | $47,707 |
| Income Deficit | 1,497 | $0 |
| Wage / Income Gap (%) | 19,368 | 27.23% |
| Wage / Income Gap ($) | 19,368 | 72.77¢ per $1 |
| Gini / Inequality Index | 19,368 | 0.57 |
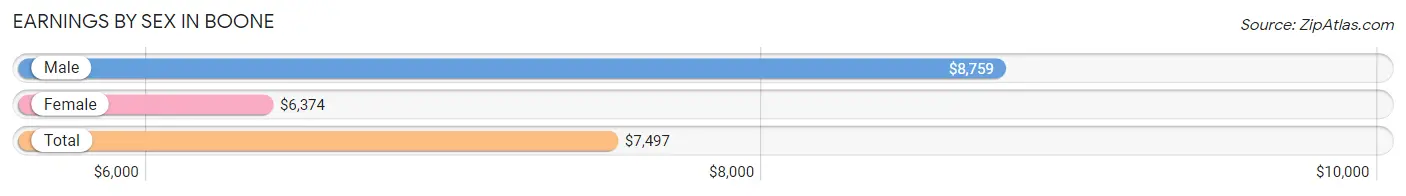
Earnings by Sex in Boone
Average Earnings in Boone are $7,497, $8,759 for men and $6,374 for women, a difference of 27.2%.
| Sex | Number | Average Earnings |
| Male | 6,145 (47.7%) | $8,759 |
| Female | 6,733 (52.3%) | $6,374 |
| Total | 12,878 (100.0%) | $7,497 |
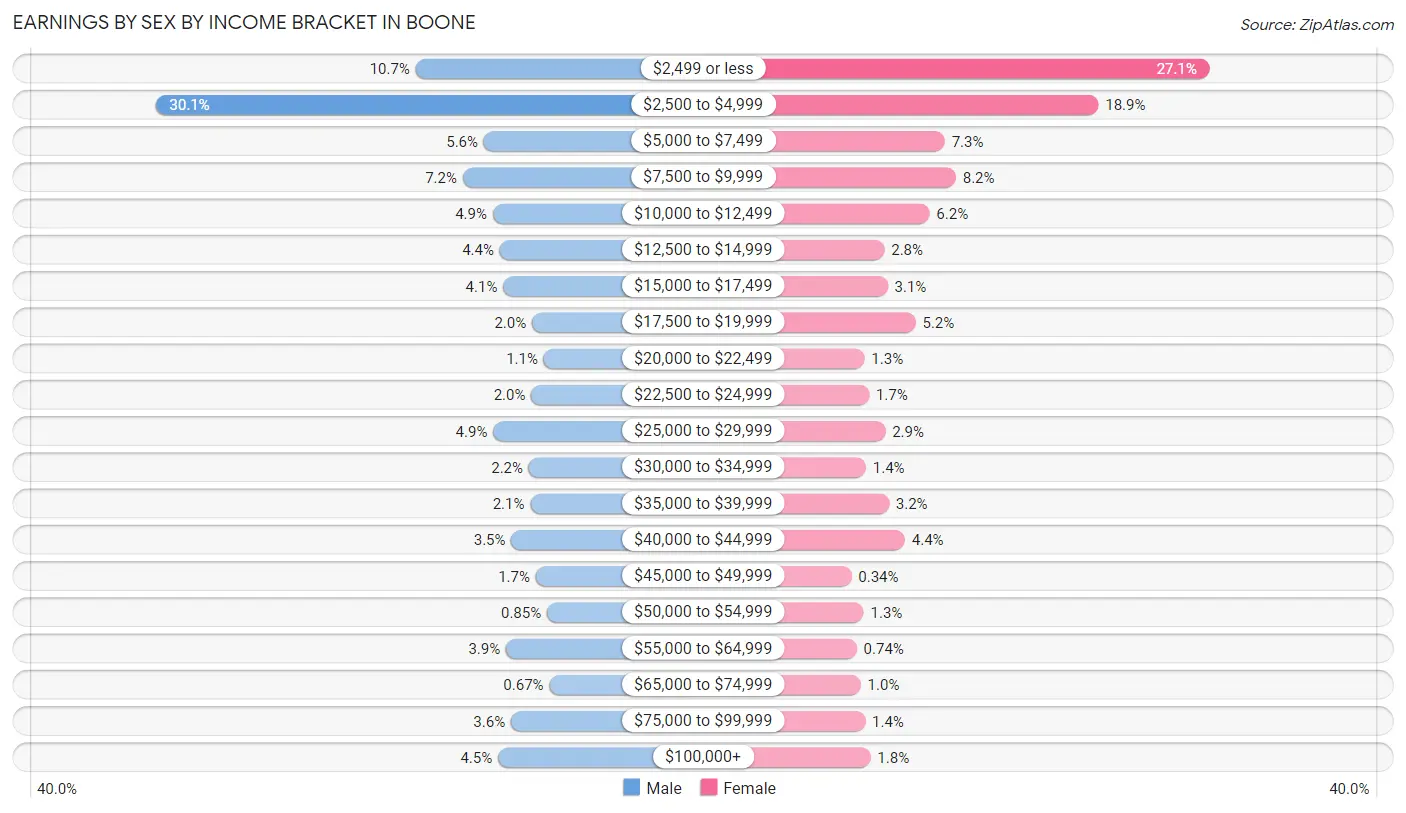
Earnings by Sex by Income Bracket in Boone
The most common earnings brackets in Boone are $2,500 to $4,999 for men (1,851 | 30.1%) and $2,499 or less for women (1,826 | 27.1%).
| Income | Male | Female |
| $2,499 or less | 657 (10.7%) | 1,826 (27.1%) |
| $2,500 to $4,999 | 1,851 (30.1%) | 1,269 (18.9%) |
| $5,000 to $7,499 | 343 (5.6%) | 494 (7.3%) |
| $7,500 to $9,999 | 440 (7.2%) | 550 (8.2%) |
| $10,000 to $12,499 | 302 (4.9%) | 417 (6.2%) |
| $12,500 to $14,999 | 270 (4.4%) | 189 (2.8%) |
| $15,000 to $17,499 | 254 (4.1%) | 206 (3.1%) |
| $17,500 to $19,999 | 121 (2.0%) | 347 (5.1%) |
| $20,000 to $22,499 | 67 (1.1%) | 89 (1.3%) |
| $22,500 to $24,999 | 125 (2.0%) | 112 (1.7%) |
| $25,000 to $29,999 | 300 (4.9%) | 194 (2.9%) |
| $30,000 to $34,999 | 136 (2.2%) | 96 (1.4%) |
| $35,000 to $39,999 | 129 (2.1%) | 212 (3.2%) |
| $40,000 to $44,999 | 216 (3.5%) | 293 (4.3%) |
| $45,000 to $49,999 | 104 (1.7%) | 23 (0.3%) |
| $50,000 to $54,999 | 52 (0.9%) | 85 (1.3%) |
| $55,000 to $64,999 | 241 (3.9%) | 50 (0.7%) |
| $65,000 to $74,999 | 41 (0.7%) | 70 (1.0%) |
| $75,000 to $99,999 | 218 (3.5%) | 92 (1.4%) |
| $100,000+ | 278 (4.5%) | 119 (1.8%) |
| Total | 6,145 (100.0%) | 6,733 (100.0%) |
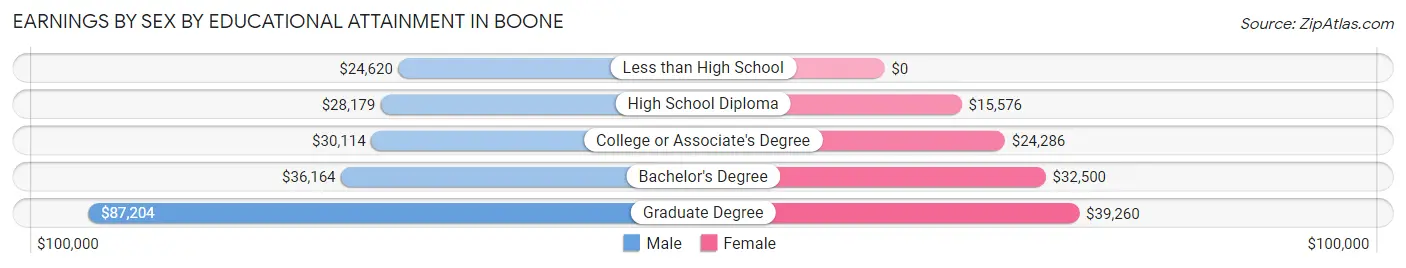
Earnings by Sex by Educational Attainment in Boone
Average earnings in Boone are $40,197 for men and $28,222 for women, a difference of 29.8%. Men with an educational attainment of graduate degree enjoy the highest average annual earnings of $87,204, while those with less than high school education earn the least with $24,620. Women with an educational attainment of graduate degree earn the most with the average annual earnings of $39,260, while those with high school diploma education have the smallest earnings of $15,576.
| Educational Attainment | Male Income | Female Income |
| Less than High School | $24,620 | $0 |
| High School Diploma | $28,179 | $15,576 |
| College or Associate's Degree | $30,114 | $24,286 |
| Bachelor's Degree | $36,164 | $32,500 |
| Graduate Degree | $87,204 | $39,260 |
| Total | $40,197 | $28,222 |
Family Income in Boone
Family Income Brackets in Boone
According to the Boone family income data, there are 314 families falling into the $100,000 to $149,999 income range, which is the most common income bracket and makes up 21.0% of all families. Conversely, the less than $10,000 income bracket is the least frequent group with only 36 families (2.4%) belonging to this category.
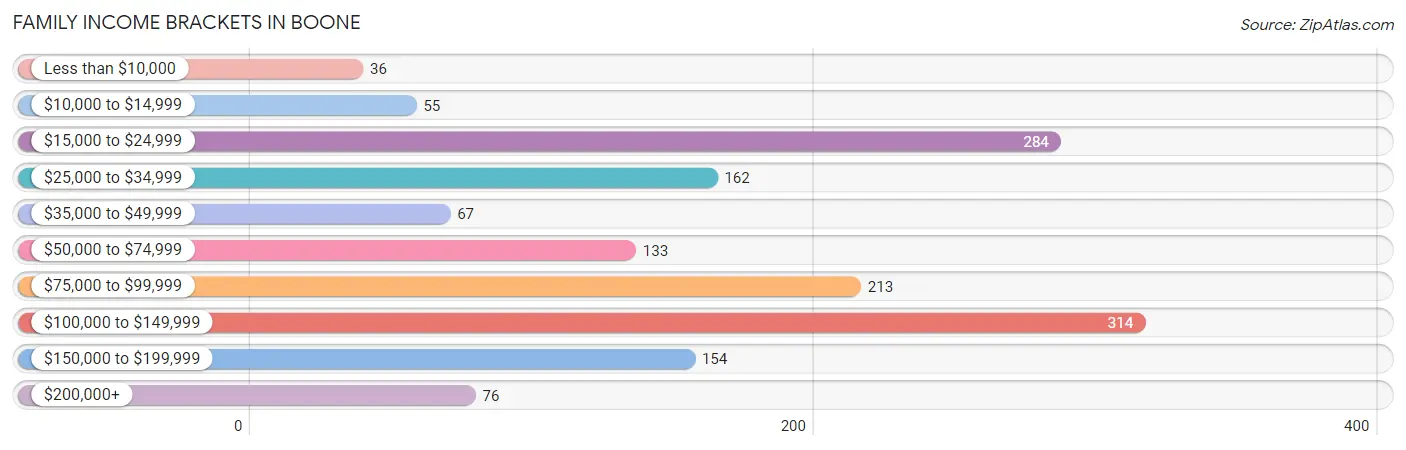
| Income Bracket | # Families | % Families |
| Less than $10,000 | 36 | 2.4% |
| $10,000 to $14,999 | 55 | 3.7% |
| $15,000 to $24,999 | 284 | 19.0% |
| $25,000 to $34,999 | 162 | 10.8% |
| $35,000 to $49,999 | 67 | 4.5% |
| $50,000 to $74,999 | 133 | 8.9% |
| $75,000 to $99,999 | 213 | 14.2% |
| $100,000 to $149,999 | 314 | 21.0% |
| $150,000 to $199,999 | 154 | 10.3% |
| $200,000+ | 76 | 5.1% |
Family Income by Famaliy Size in Boone
4-person families (226 | 15.1%) account for the highest median family income in Boone with $107,273 per family, while 2-person families (788 | 52.6%) have the highest median income of $31,250 per family member.
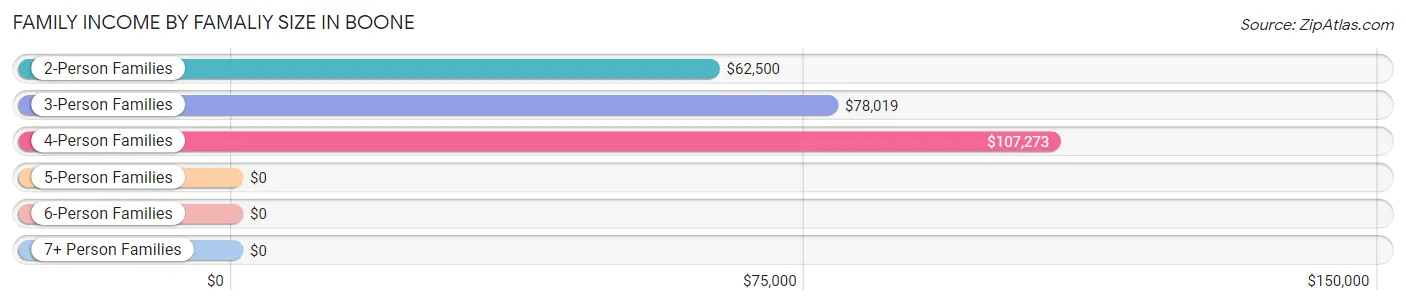
| Income Bracket | # Families | Median Income |
| 2-Person Families | 788 (52.6%) | $62,500 |
| 3-Person Families | 442 (29.5%) | $78,019 |
| 4-Person Families | 226 (15.1%) | $107,273 |
| 5-Person Families | 41 (2.7%) | $0 |
| 6-Person Families | 0 (0.0%) | $0 |
| 7+ Person Families | 0 (0.0%) | $0 |
| Total | 1,497 (100.0%) | $77,901 |
Family Income by Number of Earners in Boone
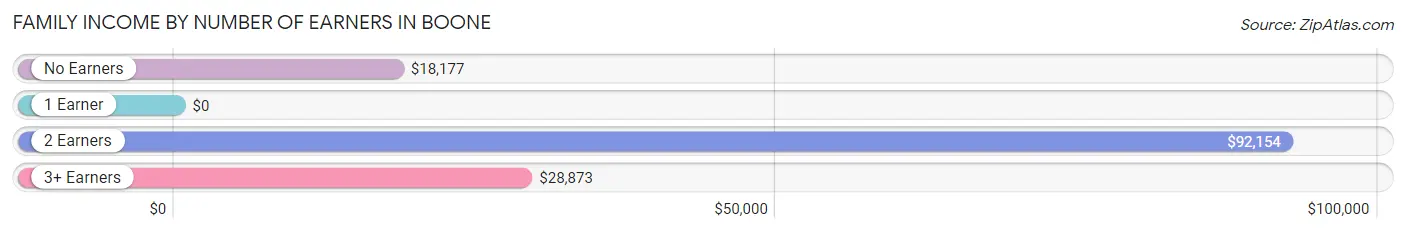
| Number of Earners | # Families | Median Income |
| No Earners | 197 (13.2%) | $18,177 |
| 1 Earner | 385 (25.7%) | $0 |
| 2 Earners | 829 (55.4%) | $92,154 |
| 3+ Earners | 86 (5.7%) | $28,873 |
| Total | 1,497 (100.0%) | $77,901 |
Household Income in Boone
Household Income Brackets in Boone
With 1,250 households falling in the category, the less than $10,000 income range is the most frequent in Boone, accounting for 21.4% of all households. In contrast, only 88 households (1.5%) fall into the $200,000+ income bracket, making it the least populous group.
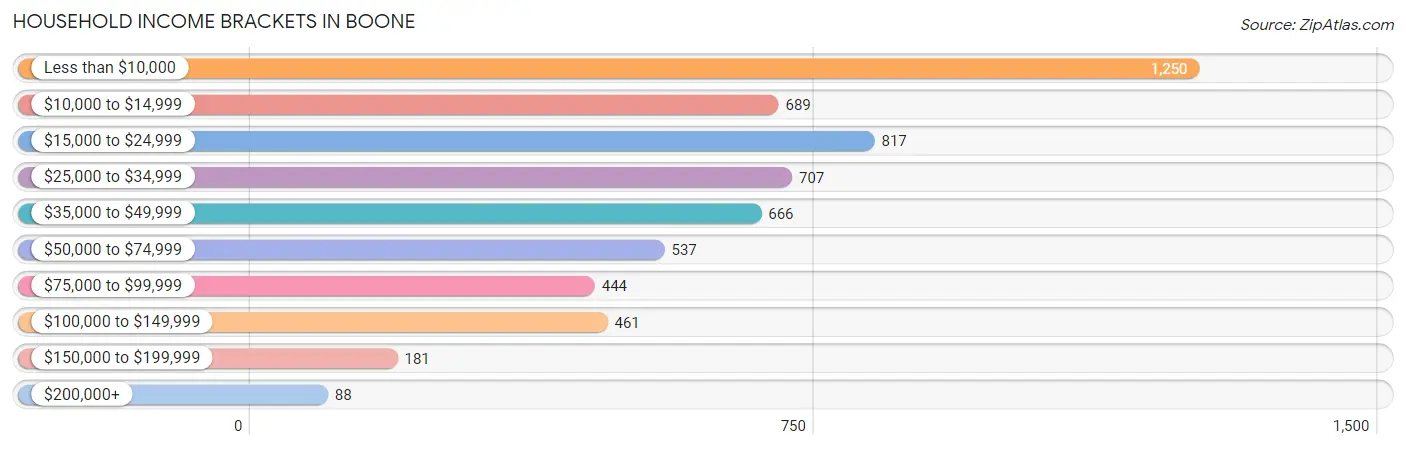
| Income Bracket | # Households | % Households |
| Less than $10,000 | 1,250 | 21.4% |
| $10,000 to $14,999 | 689 | 11.8% |
| $15,000 to $24,999 | 817 | 14.0% |
| $25,000 to $34,999 | 707 | 12.1% |
| $35,000 to $49,999 | 666 | 11.4% |
| $50,000 to $74,999 | 537 | 9.2% |
| $75,000 to $99,999 | 444 | 7.6% |
| $100,000 to $149,999 | 461 | 7.9% |
| $150,000 to $199,999 | 181 | 3.1% |
| $200,000+ | 88 | 1.5% |
Household Income by Householder Age in Boone
The median household income in Boone is $28,242, with the highest median household income of $58,264 found in the 65+ years age bracket for the primary householder. A total of 557 households (9.5%) fall into this category. Meanwhile, the 15 to 24 years age bracket for the primary householder has the lowest median household income of $13,520, with 2,825 households (48.4%) in this group.
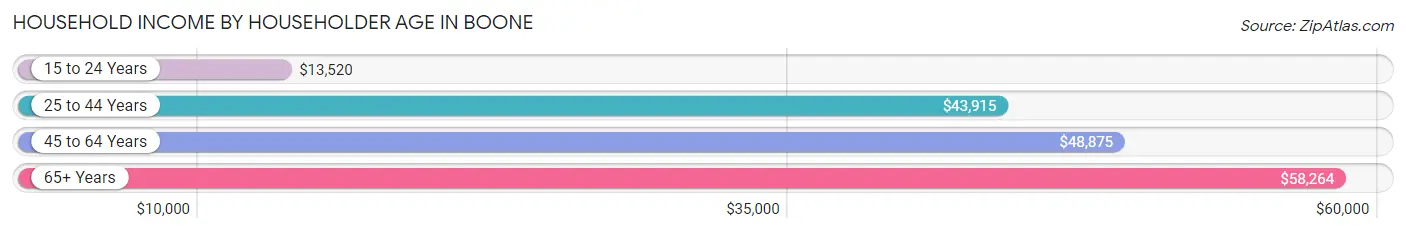
| Income Bracket | # Households | Median Income |
| 15 to 24 Years | 2,825 (48.4%) | $13,520 |
| 25 to 44 Years | 1,542 (26.4%) | $43,915 |
| 45 to 64 Years | 915 (15.7%) | $48,875 |
| 65+ Years | 557 (9.5%) | $58,264 |
| Total | 5,839 (100.0%) | $28,242 |
Poverty in Boone
Income Below Poverty by Sex and Age in Boone
With 56.3% poverty level for males and 55.5% for females among the residents of Boone, under 5 year old males and 5 year old females are the most vulnerable to poverty, with 36 males (100.0%) and 28 females (100.0%) in their respective age groups living below the poverty level.
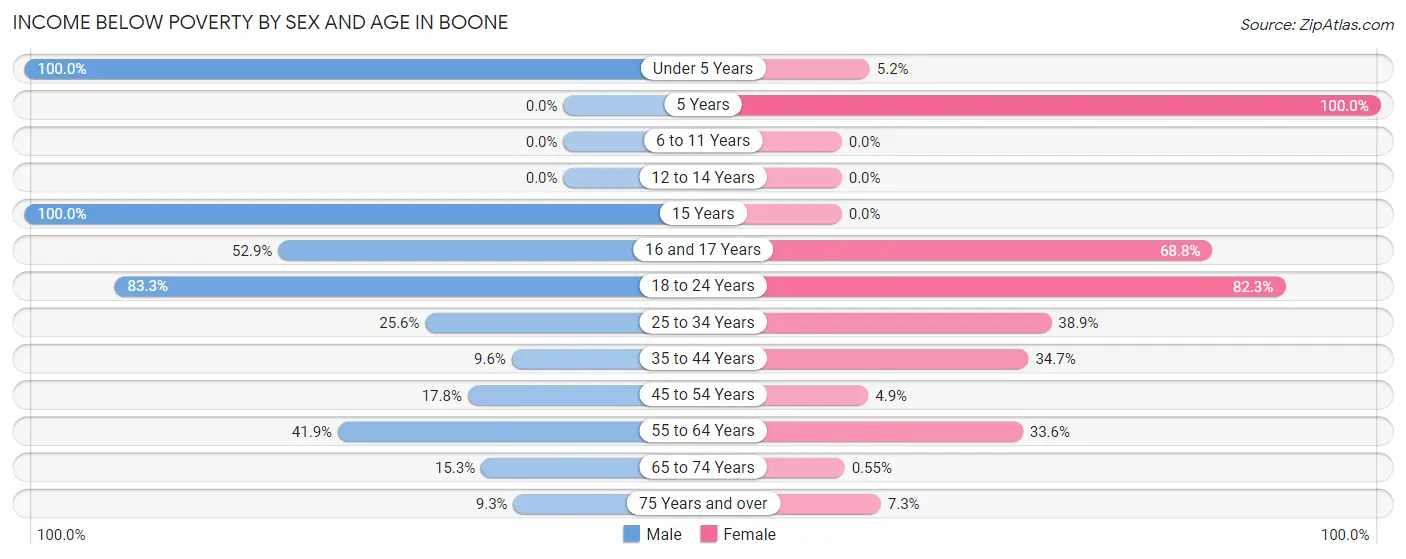
| Age Bracket | Male | Female |
| Under 5 Years | 36 (100.0%) | 10 (5.2%) |
| 5 Years | 0 (0.0%) | 28 (100.0%) |
| 6 to 11 Years | 0 (0.0%) | 0 (0.0%) |
| 12 to 14 Years | 0 (0.0%) | 0 (0.0%) |
| 15 Years | 2 (100.0%) | 0 (0.0%) |
| 16 and 17 Years | 18 (52.9%) | 55 (68.8%) |
| 18 to 24 Years | 3,347 (83.3%) | 2,914 (82.3%) |
| 25 to 34 Years | 231 (25.6%) | 361 (38.9%) |
| 35 to 44 Years | 54 (9.6%) | 210 (34.6%) |
| 45 to 54 Years | 60 (17.7%) | 15 (4.9%) |
| 55 to 64 Years | 195 (41.8%) | 165 (33.6%) |
| 65 to 74 Years | 33 (15.3%) | 1 (0.5%) |
| 75 Years and over | 15 (9.3%) | 20 (7.2%) |
| Total | 3,991 (56.3%) | 3,779 (55.5%) |
Income Above Poverty by Sex and Age in Boone
According to the poverty statistics in Boone, males aged 6 to 11 years and females aged 6 to 11 years are the age groups that are most secure financially, with 100.0% of males and 100.0% of females in these age groups living above the poverty line.
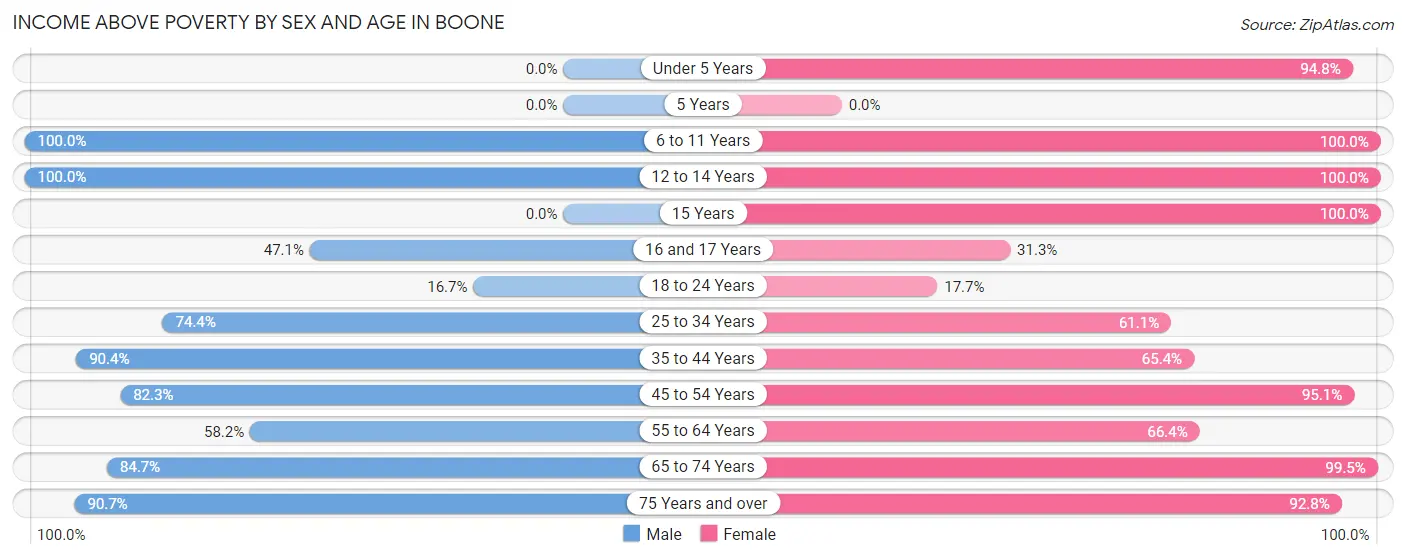
| Age Bracket | Male | Female |
| Under 5 Years | 0 (0.0%) | 182 (94.8%) |
| 5 Years | 0 (0.0%) | 0 (0.0%) |
| 6 to 11 Years | 202 (100.0%) | 117 (100.0%) |
| 12 to 14 Years | 154 (100.0%) | 39 (100.0%) |
| 15 Years | 0 (0.0%) | 19 (100.0%) |
| 16 and 17 Years | 16 (47.1%) | 25 (31.2%) |
| 18 to 24 Years | 672 (16.7%) | 628 (17.7%) |
| 25 to 34 Years | 671 (74.4%) | 567 (61.1%) |
| 35 to 44 Years | 509 (90.4%) | 396 (65.3%) |
| 45 to 54 Years | 278 (82.3%) | 289 (95.1%) |
| 55 to 64 Years | 271 (58.2%) | 326 (66.4%) |
| 65 to 74 Years | 183 (84.7%) | 182 (99.5%) |
| 75 Years and over | 147 (90.7%) | 256 (92.7%) |
| Total | 3,103 (43.7%) | 3,026 (44.5%) |
Income Below Poverty Among Married-Couple Families in Boone
The poverty statistics for married-couple families in Boone show that 12.6% or 133 of the total 1,053 families live below the poverty line. Families with no children have the highest poverty rate of 13.2%, comprising of 82 families. On the other hand, families with 3 or 4 children have the lowest poverty rate of 0.0%, which includes 0 families.
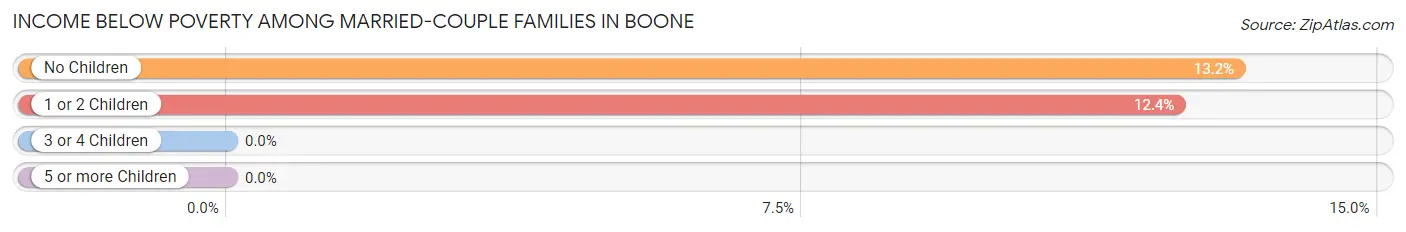
| Children | Above Poverty | Below Poverty |
| No Children | 541 (86.8%) | 82 (13.2%) |
| 1 or 2 Children | 361 (87.6%) | 51 (12.4%) |
| 3 or 4 Children | 18 (100.0%) | 0 (0.0%) |
| 5 or more Children | 0 (0.0%) | 0 (0.0%) |
| Total | 920 (87.4%) | 133 (12.6%) |
Income Below Poverty Among Single-Parent Households in Boone
According to the poverty data in Boone, 38.6% or 39 single-father households and 34.1% or 117 single-mother households are living below the poverty line. Among single-father households, those with 1 or 2 children have the highest poverty rate, with 20 households (100.0%) experiencing poverty. Likewise, among single-mother households, those with 1 or 2 children have the highest poverty rate, with 71 households (42.0%) falling below the poverty line.
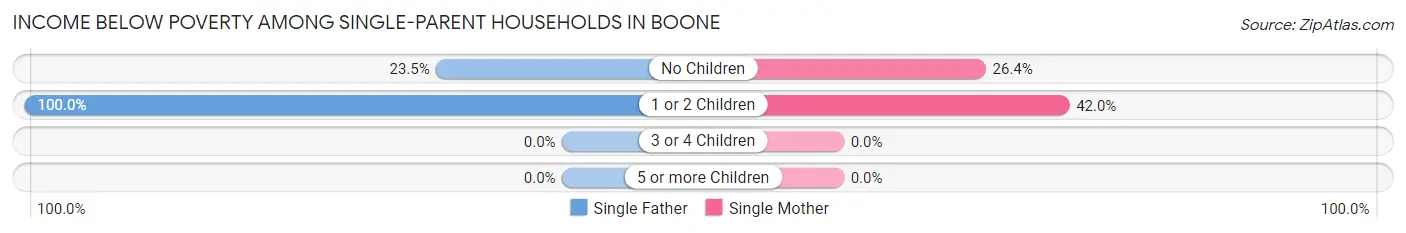
| Children | Single Father | Single Mother |
| No Children | 19 (23.5%) | 46 (26.4%) |
| 1 or 2 Children | 20 (100.0%) | 71 (42.0%) |
| 3 or 4 Children | 0 (0.0%) | 0 (0.0%) |
| 5 or more Children | 0 (0.0%) | 0 (0.0%) |
| Total | 39 (38.6%) | 117 (34.1%) |
Income Below Poverty Among Married-Couple vs Single-Parent Households in Boone
The poverty data for Boone shows that 133 of the married-couple family households (12.6%) and 156 of the single-parent households (35.1%) are living below the poverty level. Within the married-couple family households, those with no children have the highest poverty rate, with 82 households (13.2%) falling below the poverty line. Among the single-parent households, those with 1 or 2 children have the highest poverty rate, with 91 household (48.1%) living below poverty.
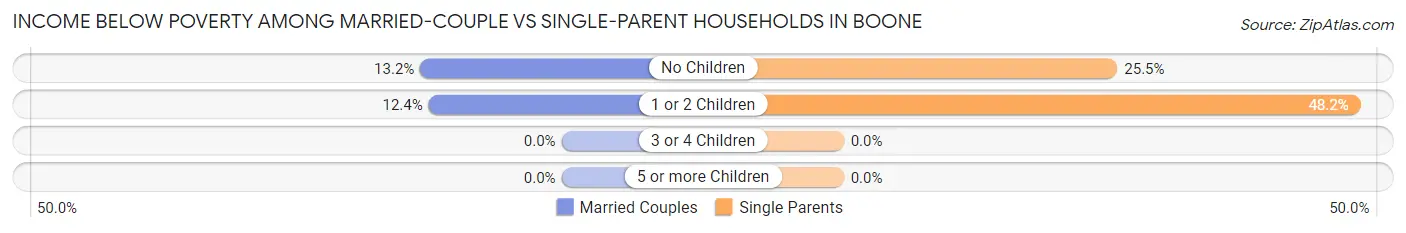
| Children | Married-Couple Families | Single-Parent Households |
| No Children | 82 (13.2%) | 65 (25.5%) |
| 1 or 2 Children | 51 (12.4%) | 91 (48.1%) |
| 3 or 4 Children | 0 (0.0%) | 0 (0.0%) |
| 5 or more Children | 0 (0.0%) | 0 (0.0%) |
| Total | 133 (12.6%) | 156 (35.1%) |
Race in Boone
The most populous races in Boone are White / Caucasian (17,513 | 90.4%), Hispanic or Latino (905 | 4.7%), and Two or more Races (755 | 3.9%).
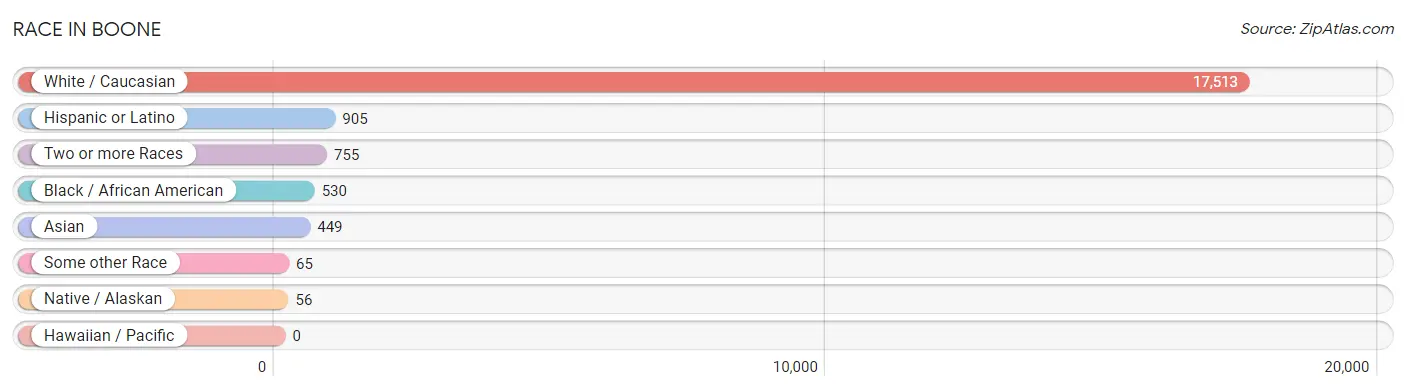
| Race | # Population | % Population |
| Asian | 449 | 2.3% |
| Black / African American | 530 | 2.7% |
| Hawaiian / Pacific | 0 | 0.0% |
| Hispanic or Latino | 905 | 4.7% |
| Native / Alaskan | 56 | 0.3% |
| White / Caucasian | 17,513 | 90.4% |
| Two or more Races | 755 | 3.9% |
| Some other Race | 65 | 0.3% |
| Total | 19,368 | 100.0% |
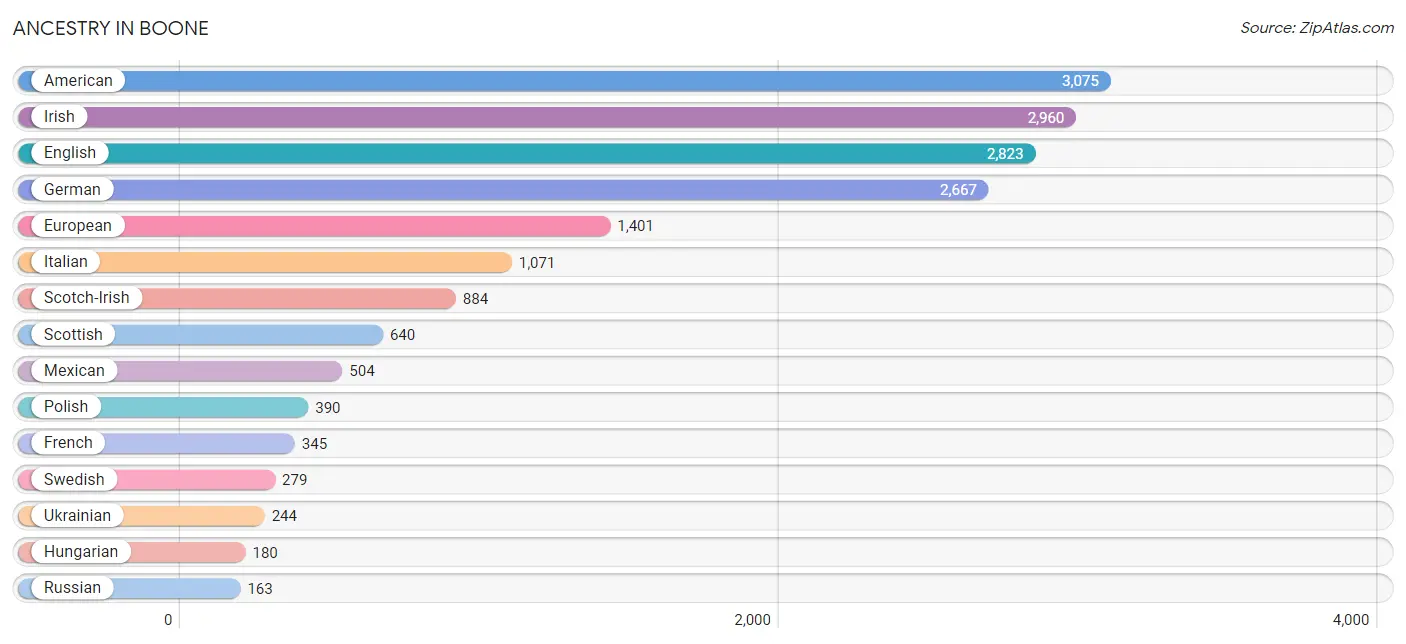
Ancestry in Boone
The most populous ancestries reported in Boone are American (3,075 | 15.9%), Irish (2,960 | 15.3%), English (2,823 | 14.6%), German (2,667 | 13.8%), and European (1,401 | 7.2%), together accounting for 66.7% of all Boone residents.
| Ancestry | # Population | % Population |
| African | 42 | 0.2% |
| American | 3,075 | 15.9% |
| Arab | 86 | 0.4% |
| Austrian | 32 | 0.2% |
| Bangladeshi | 4 | 0.0% |
| Belgian | 26 | 0.1% |
| Bhutanese | 21 | 0.1% |
| Bolivian | 5 | 0.0% |
| Brazilian | 12 | 0.1% |
| British | 141 | 0.7% |
| British West Indian | 18 | 0.1% |
| Bulgarian | 54 | 0.3% |
| Burmese | 152 | 0.8% |
| Canadian | 23 | 0.1% |
| Central American | 85 | 0.4% |
| Central American Indian | 53 | 0.3% |
| Chilean | 69 | 0.4% |
| Croatian | 1 | 0.0% |
| Cuban | 20 | 0.1% |
| Czech | 6 | 0.0% |
| Danish | 15 | 0.1% |
| Dominican | 20 | 0.1% |
| Dutch | 14 | 0.1% |
| Eastern European | 40 | 0.2% |
| English | 2,823 | 14.6% |
| European | 1,401 | 7.2% |
| Finnish | 38 | 0.2% |
| French | 345 | 1.8% |
| French Canadian | 98 | 0.5% |
| German | 2,667 | 13.8% |
| Greek | 30 | 0.2% |
| Honduran | 59 | 0.3% |
| Hungarian | 180 | 0.9% |
| Indian (Asian) | 69 | 0.4% |
| Irish | 2,960 | 15.3% |
| Italian | 1,071 | 5.5% |
| Jamaican | 46 | 0.2% |
| Korean | 56 | 0.3% |
| Laotian | 9 | 0.1% |
| Latvian | 9 | 0.1% |
| Lithuanian | 49 | 0.3% |
| Lumbee | 22 | 0.1% |
| Mexican | 504 | 2.6% |
| Native Hawaiian | 7 | 0.0% |
| Nigerian | 5 | 0.0% |
| Northern European | 23 | 0.1% |
| Norwegian | 80 | 0.4% |
| Pakistani | 29 | 0.2% |
| Panamanian | 14 | 0.1% |
| Pennsylvania German | 75 | 0.4% |
| Polish | 390 | 2.0% |
| Puerto Rican | 114 | 0.6% |
| Romanian | 25 | 0.1% |
| Russian | 163 | 0.8% |
| Salvadoran | 12 | 0.1% |
| Scandinavian | 113 | 0.6% |
| Scotch-Irish | 884 | 4.6% |
| Scottish | 640 | 3.3% |
| South American | 74 | 0.4% |
| Spaniard | 40 | 0.2% |
| Spanish | 5 | 0.0% |
| Sri Lankan | 142 | 0.7% |
| Subsaharan African | 70 | 0.4% |
| Swedish | 279 | 1.4% |
| Swiss | 67 | 0.4% |
| Thai | 16 | 0.1% |
| Trinidadian and Tobagonian | 14 | 0.1% |
| Ukrainian | 244 | 1.3% |
| Welsh | 149 | 0.8% |
| West Indian | 4 | 0.0% | View All 70 Rows |
Immigrants in Boone
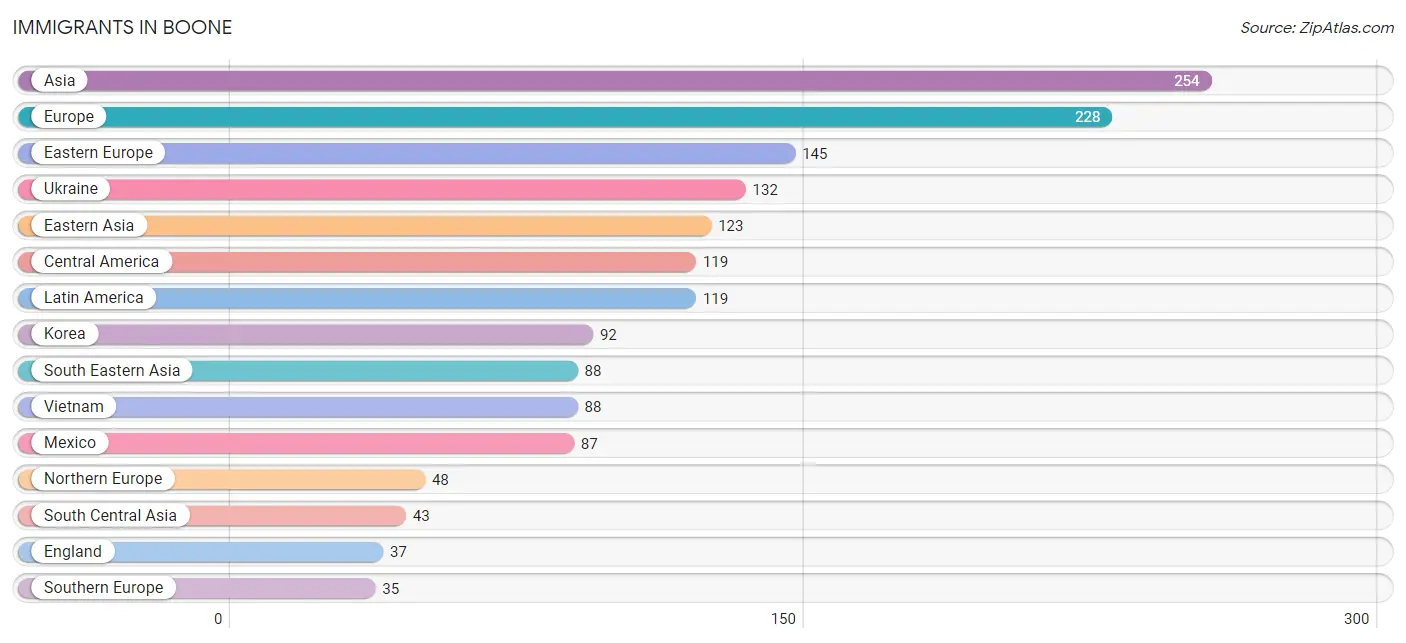
The most numerous immigrant groups reported in Boone came from Asia (254 | 1.3%), Europe (228 | 1.2%), Eastern Europe (145 | 0.7%), Ukraine (132 | 0.7%), and Eastern Asia (123 | 0.6%), together accounting for 4.6% of all Boone residents.
| Immigration Origin | # Population | % Population |
| Africa | 15 | 0.1% |
| Asia | 254 | 1.3% |
| Canada | 24 | 0.1% |
| Central America | 119 | 0.6% |
| China | 31 | 0.2% |
| Denmark | 11 | 0.1% |
| Eastern Asia | 123 | 0.6% |
| Eastern Europe | 145 | 0.7% |
| England | 37 | 0.2% |
| Europe | 228 | 1.2% |
| Honduras | 32 | 0.2% |
| Iran | 21 | 0.1% |
| Korea | 92 | 0.5% |
| Latin America | 119 | 0.6% |
| Latvia | 5 | 0.0% |
| Mexico | 87 | 0.4% |
| Nepal | 22 | 0.1% |
| Northern Europe | 48 | 0.3% |
| Russia | 8 | 0.0% |
| South Central Asia | 43 | 0.2% |
| South Eastern Asia | 88 | 0.4% |
| Southern Europe | 35 | 0.2% |
| Spain | 35 | 0.2% |
| Ukraine | 132 | 0.7% |
| Vietnam | 88 | 0.4% | View All 25 Rows |
Sex and Age in Boone
Sex and Age in Boone
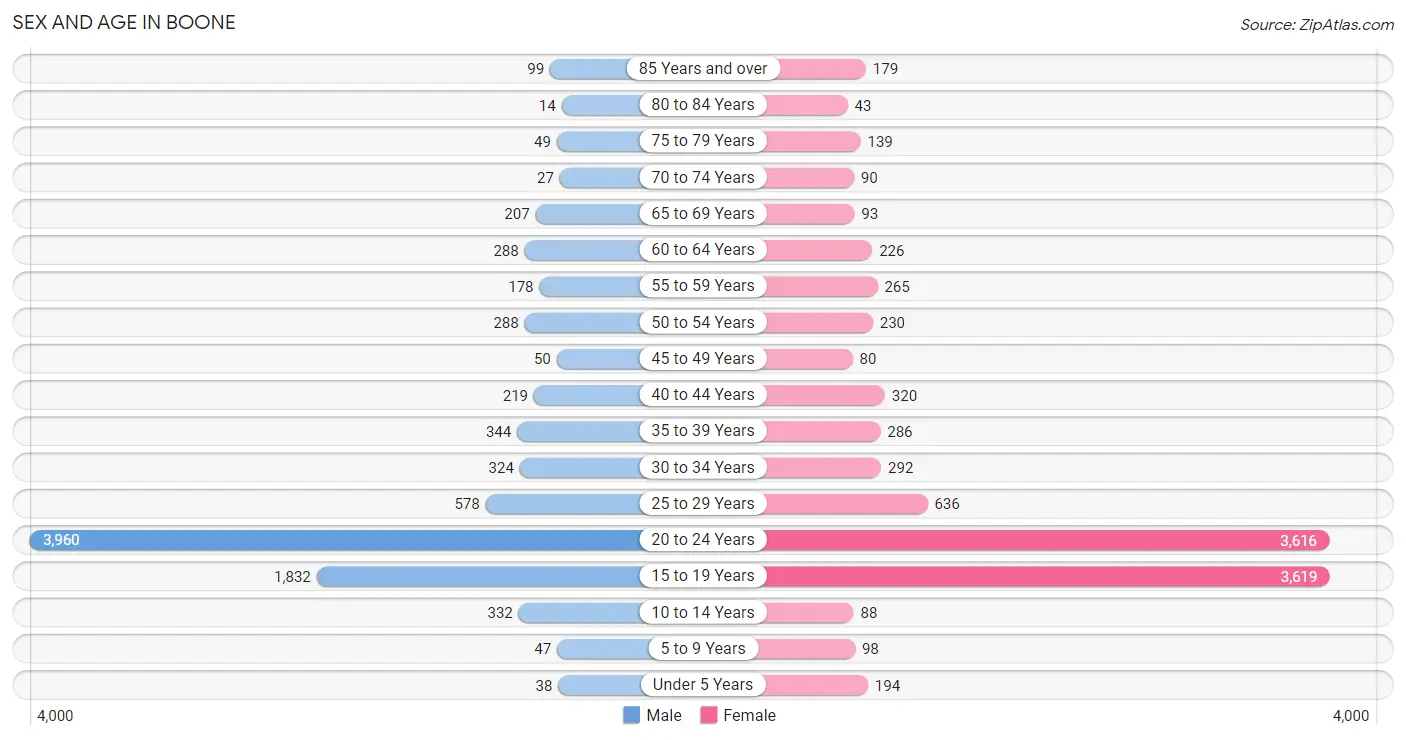
The most populous age groups in Boone are 20 to 24 Years (3,960 | 44.6%) for men and 15 to 19 Years (3,619 | 34.5%) for women.
| Age Bracket | Male | Female |
| Under 5 Years | 38 (0.4%) | 194 (1.8%) |
| 5 to 9 Years | 47 (0.5%) | 98 (0.9%) |
| 10 to 14 Years | 332 (3.7%) | 88 (0.8%) |
| 15 to 19 Years | 1,832 (20.6%) | 3,619 (34.5%) |
| 20 to 24 Years | 3,960 (44.6%) | 3,616 (34.5%) |
| 25 to 29 Years | 578 (6.5%) | 636 (6.1%) |
| 30 to 34 Years | 324 (3.6%) | 292 (2.8%) |
| 35 to 39 Years | 344 (3.9%) | 286 (2.7%) |
| 40 to 44 Years | 219 (2.5%) | 320 (3.0%) |
| 45 to 49 Years | 50 (0.6%) | 80 (0.8%) |
| 50 to 54 Years | 288 (3.3%) | 230 (2.2%) |
| 55 to 59 Years | 178 (2.0%) | 265 (2.5%) |
| 60 to 64 Years | 288 (3.3%) | 226 (2.1%) |
| 65 to 69 Years | 207 (2.3%) | 93 (0.9%) |
| 70 to 74 Years | 27 (0.3%) | 90 (0.9%) |
| 75 to 79 Years | 49 (0.5%) | 139 (1.3%) |
| 80 to 84 Years | 14 (0.2%) | 43 (0.4%) |
| 85 Years and over | 99 (1.1%) | 179 (1.7%) |
| Total | 8,874 (100.0%) | 10,494 (100.0%) |
Families and Households in Boone
Median Family Size in Boone
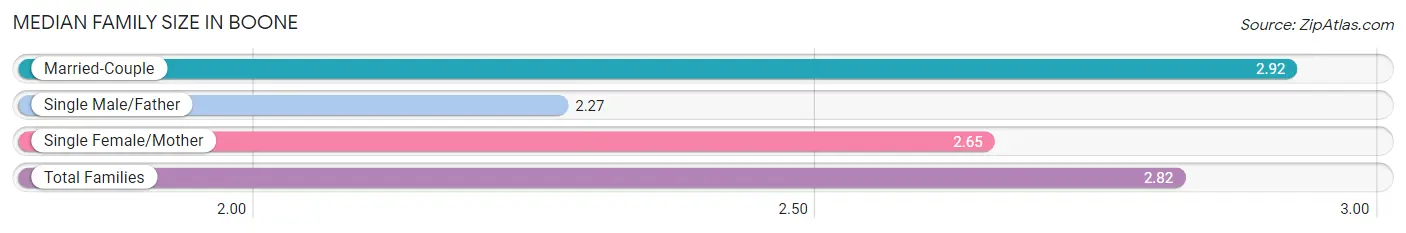
The median family size in Boone is 2.82 persons per family, with married-couple families (1,053 | 70.3%) accounting for the largest median family size of 2.92 persons per family. On the other hand, single male/father families (101 | 6.8%) represent the smallest median family size with 2.27 persons per family.
| Family Type | # Families | Family Size |
| Married-Couple | 1,053 (70.3%) | 2.92 |
| Single Male/Father | 101 (6.8%) | 2.27 |
| Single Female/Mother | 343 (22.9%) | 2.65 |
| Total Families | 1,497 (100.0%) | 2.82 |
Median Household Size in Boone
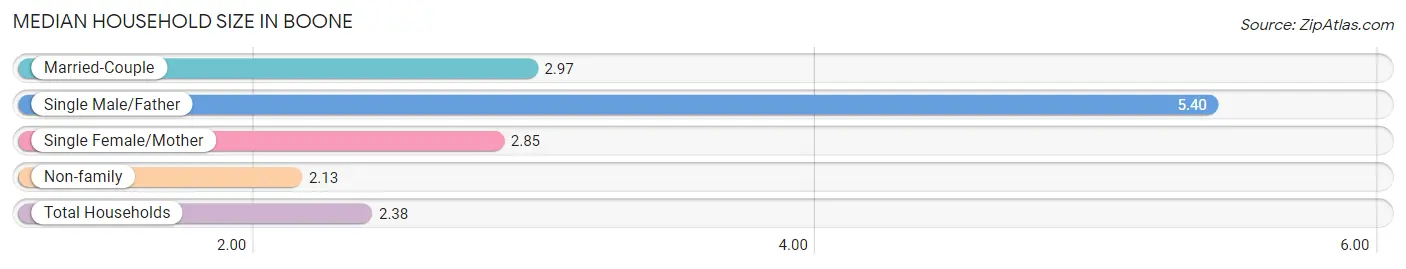
The median household size in Boone is 2.38 persons per household, with single male/father households (101 | 1.7%) accounting for the largest median household size of 5.4 persons per household. non-family households (4,342 | 74.4%) represent the smallest median household size with 2.13 persons per household.
| Household Type | # Households | Household Size |
| Married-Couple | 1,053 (18.0%) | 2.97 |
| Single Male/Father | 101 (1.7%) | 5.40 |
| Single Female/Mother | 343 (5.9%) | 2.85 |
| Non-family | 4,342 (74.4%) | 2.13 |
| Total Households | 5,839 (100.0%) | 2.38 |
Household Size by Marriage Status in Boone
Out of a total of 5,839 households in Boone, 1,497 (25.6%) are family households, while 4,342 (74.4%) are nonfamily households. The most numerous type of family households are 2-person households, comprising 700, and the most common type of nonfamily households are 2-person households, comprising 1,737.
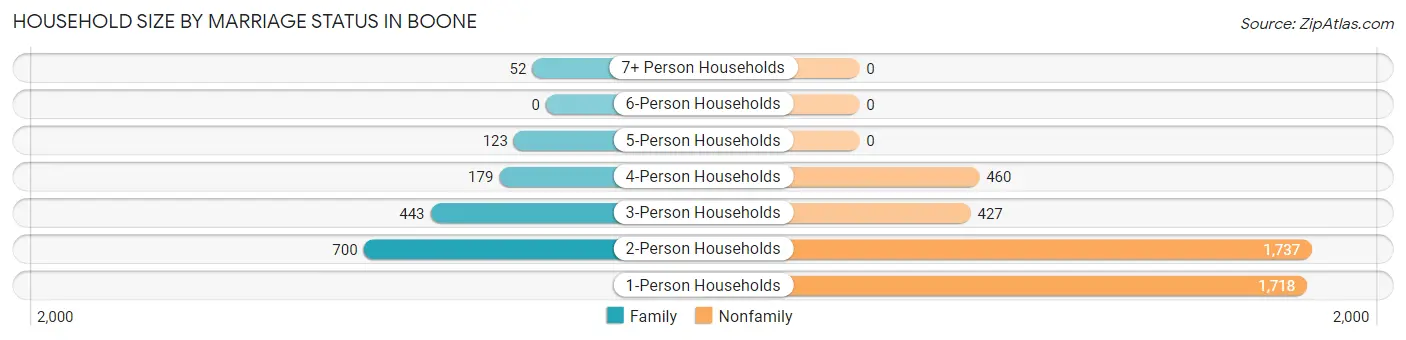
| Household Size | Family Households | Nonfamily Households |
| 1-Person Households | - | 1,718 (29.4%) |
| 2-Person Households | 700 (12.0%) | 1,737 (29.7%) |
| 3-Person Households | 443 (7.6%) | 427 (7.3%) |
| 4-Person Households | 179 (3.1%) | 460 (7.9%) |
| 5-Person Households | 123 (2.1%) | 0 (0.0%) |
| 6-Person Households | 0 (0.0%) | 0 (0.0%) |
| 7+ Person Households | 52 (0.9%) | 0 (0.0%) |
| Total | 1,497 (25.6%) | 4,342 (74.4%) |
Female Fertility in Boone
Fertility by Age in Boone
Average fertility rate in Boone is 6.0 births per 1,000 women. Women in the age bracket of 20 to 34 years have the highest fertility rate with 12.0 births per 1,000 women. Women in the age bracket of 20 to 34 years acount for 100.0% of all women with births.
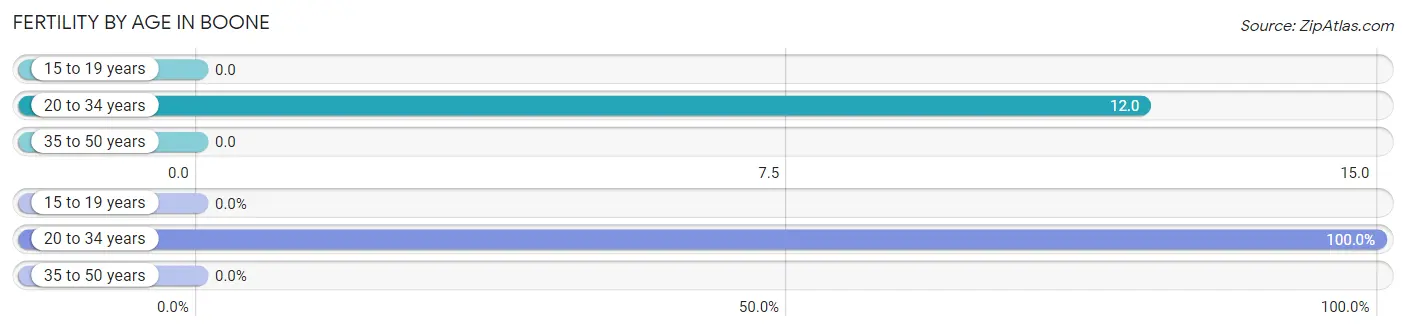
| Age Bracket | Women with Births | Births / 1,000 Women |
| 15 to 19 years | 0 (0.0%) | 0.0 |
| 20 to 34 years | 53 (100.0%) | 12.0 |
| 35 to 50 years | 0 (0.0%) | 0.0 |
| Total | 53 (100.0%) | 6.0 |
Fertility by Age by Marriage Status in Boone
81.1% of women with births (53) in Boone are married. The highest percentage of unmarried women with births falls into 20 to 34 years age bracket with 18.9% of them unmarried at the time of birth, while the lowest percentage of unmarried women with births belong to 20 to 34 years age bracket with 18.9% of them unmarried.
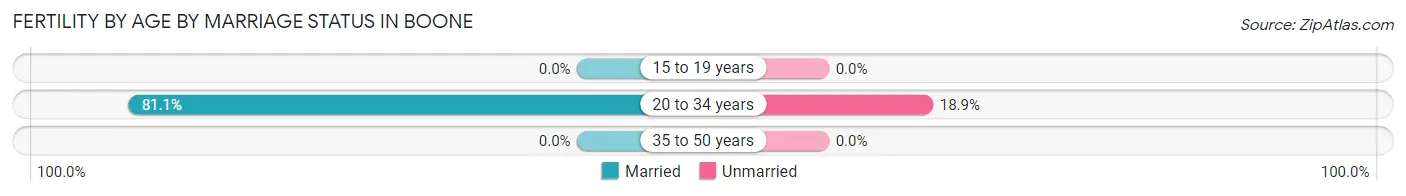
| Age Bracket | Married | Unmarried |
| 15 to 19 years | 0 (0.0%) | 0 (0.0%) |
| 20 to 34 years | 43 (81.1%) | 10 (18.9%) |
| 35 to 50 years | 0 (0.0%) | 0 (0.0%) |
| Total | 43 (81.1%) | 10 (18.9%) |
Fertility by Education in Boone
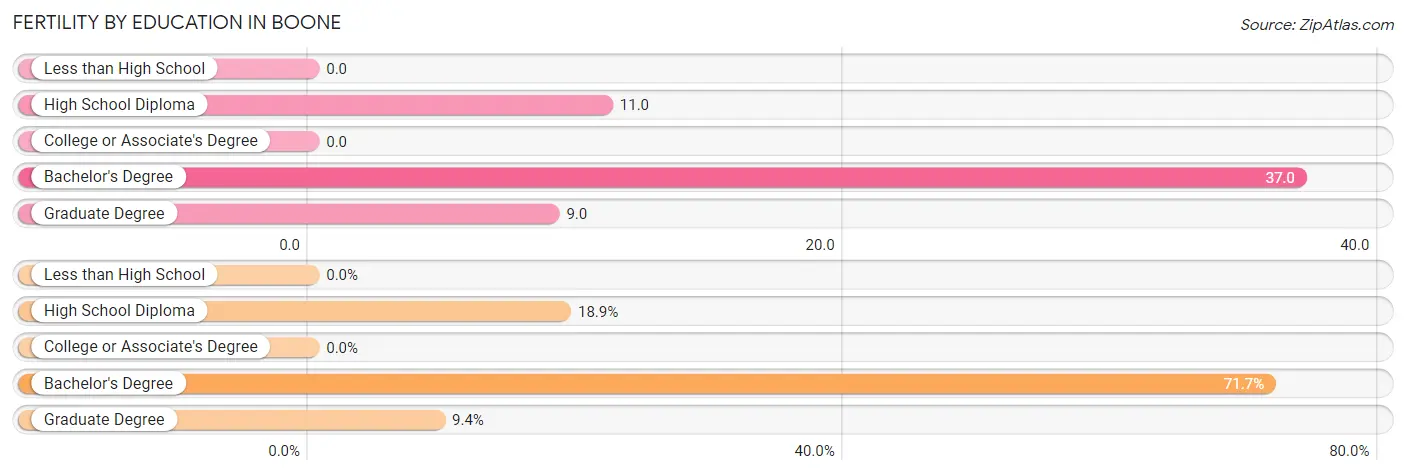
| Educational Attainment | Women with Births | Births / 1,000 Women |
| Less than High School | 0 (0.0%) | 0.0 |
| High School Diploma | 10 (18.9%) | 11.0 |
| College or Associate's Degree | 0 (0.0%) | 0.0 |
| Bachelor's Degree | 38 (71.7%) | 37.0 |
| Graduate Degree | 5 (9.4%) | 9.0 |
| Total | 53 (100.0%) | 6.0 |
Fertility by Education by Marriage Status in Boone
18.9% of women with births in Boone are unmarried. Women with the educational attainment of bachelor's degree are most likely to be married with 100.0% of them married at childbirth, while women with the educational attainment of high school diploma are least likely to be married with 100.0% of them unmarried at childbirth.
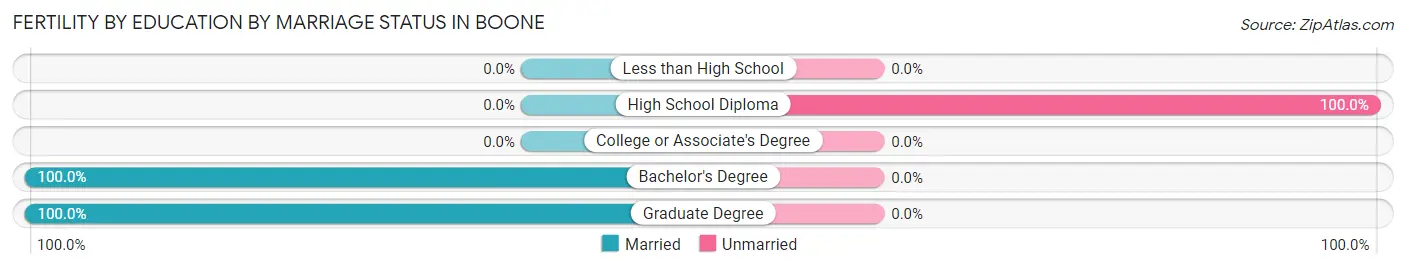
| Educational Attainment | Married | Unmarried |
| Less than High School | 0 (0.0%) | 0 (0.0%) |
| High School Diploma | 0 (0.0%) | 10 (100.0%) |
| College or Associate's Degree | 0 (0.0%) | 0 (0.0%) |
| Bachelor's Degree | 38 (100.0%) | 0 (0.0%) |
| Graduate Degree | 5 (100.0%) | 0 (0.0%) |
| Total | 43 (81.1%) | 10 (18.9%) |
Employment Characteristics in Boone
Employment by Class of Employer in Boone
Among the 7,676 employed individuals in Boone, private company employees (4,896 | 63.8%), state government employees (1,409 | 18.4%), and not-for-profit organizations (437 | 5.7%) make up the most common classes of employment.
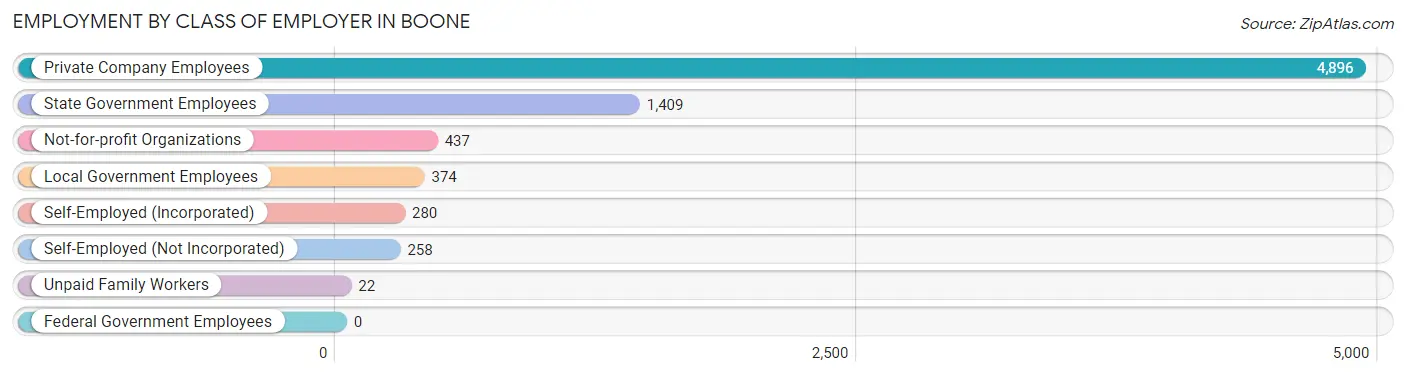
| Employer Class | # Employees | % Employees |
| Private Company Employees | 4,896 | 63.8% |
| Self-Employed (Incorporated) | 280 | 3.6% |
| Self-Employed (Not Incorporated) | 258 | 3.4% |
| Not-for-profit Organizations | 437 | 5.7% |
| Local Government Employees | 374 | 4.9% |
| State Government Employees | 1,409 | 18.4% |
| Federal Government Employees | 0 | 0.0% |
| Unpaid Family Workers | 22 | 0.3% |
| Total | 7,676 | 100.0% |
Employment Status by Age in Boone
According to the labor force statistics for Boone, out of the total population over 16 years of age (18,550), 53.6% or 9,943 individuals are in the labor force, with 16.6% or 1,651 of them unemployed. The age group with the highest labor force participation rate is 25 to 29 years, with 91.3% or 1,108 individuals in the labor force. Within the labor force, the 16 to 19 years age range has the highest percentage of unemployed individuals, with 36.8% or 604 of them being unemployed.
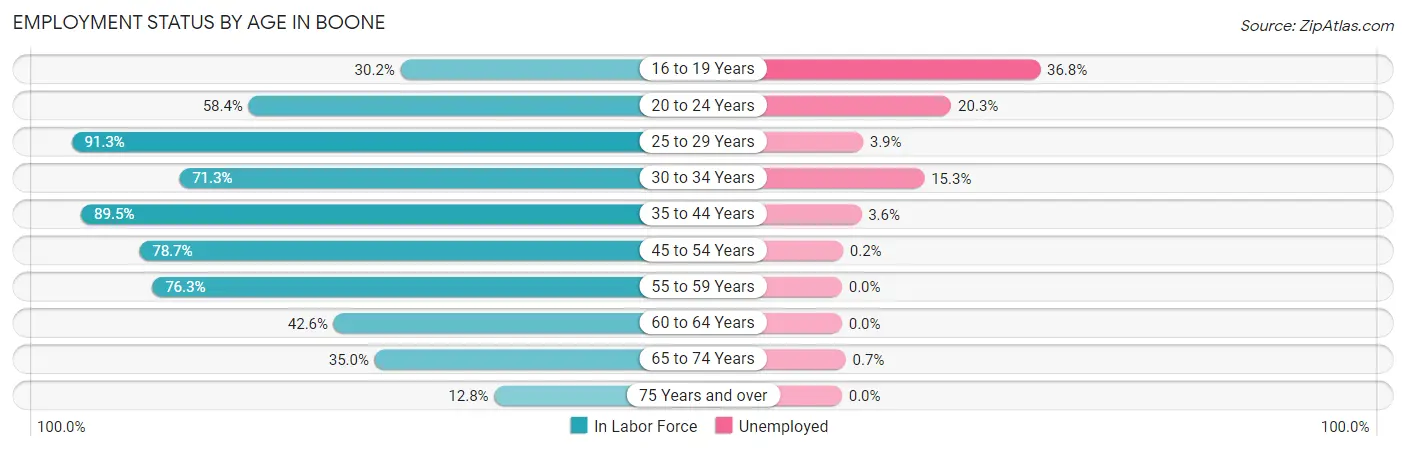
| Age Bracket | In Labor Force | Unemployed |
| 16 to 19 Years | 1,640 (30.2%) | 604 (36.8%) |
| 20 to 24 Years | 4,424 (58.4%) | 898 (20.3%) |
| 25 to 29 Years | 1,108 (91.3%) | 43 (3.9%) |
| 30 to 34 Years | 439 (71.3%) | 67 (15.3%) |
| 35 to 44 Years | 1,046 (89.5%) | 38 (3.6%) |
| 45 to 54 Years | 510 (78.7%) | 1 (0.2%) |
| 55 to 59 Years | 338 (76.3%) | 0 (0.0%) |
| 60 to 64 Years | 219 (42.6%) | 0 (0.0%) |
| 65 to 74 Years | 146 (35.0%) | 1 (0.7%) |
| 75 Years and over | 67 (12.8%) | 0 (0.0%) |
| Total | 9,943 (53.6%) | 1,651 (16.6%) |
Employment Status by Educational Attainment in Boone
According to labor force statistics for Boone, 79.5% of individuals (3,660) out of the total population between 25 and 64 years of age (4,604) are in the labor force, with 4.1% or 150 of them being unemployed. The group with the highest labor force participation rate are those with the educational attainment of bachelor's degree or higher, with 92.5% or 1,957 individuals in the labor force. Within the labor force, individuals with high school diploma education have the highest percentage of unemployment, with 17.1% or 81 of them being unemployed.
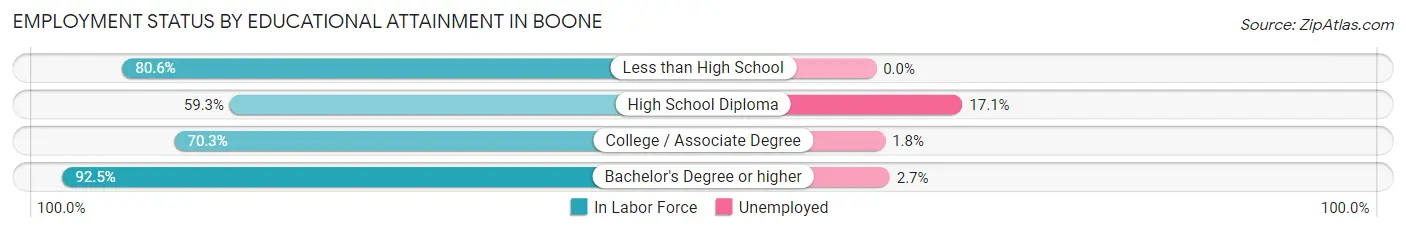
| Educational Attainment | In Labor Force | Unemployed |
| Less than High School | 320 (80.6%) | 0 (0.0%) |
| High School Diploma | 474 (59.3%) | 137 (17.1%) |
| College / Associate Degree | 908 (70.3%) | 23 (1.8%) |
| Bachelor's Degree or higher | 1,957 (92.5%) | 57 (2.7%) |
| Total | 3,660 (79.5%) | 189 (4.1%) |
Employment Occupations by Sex in Boone
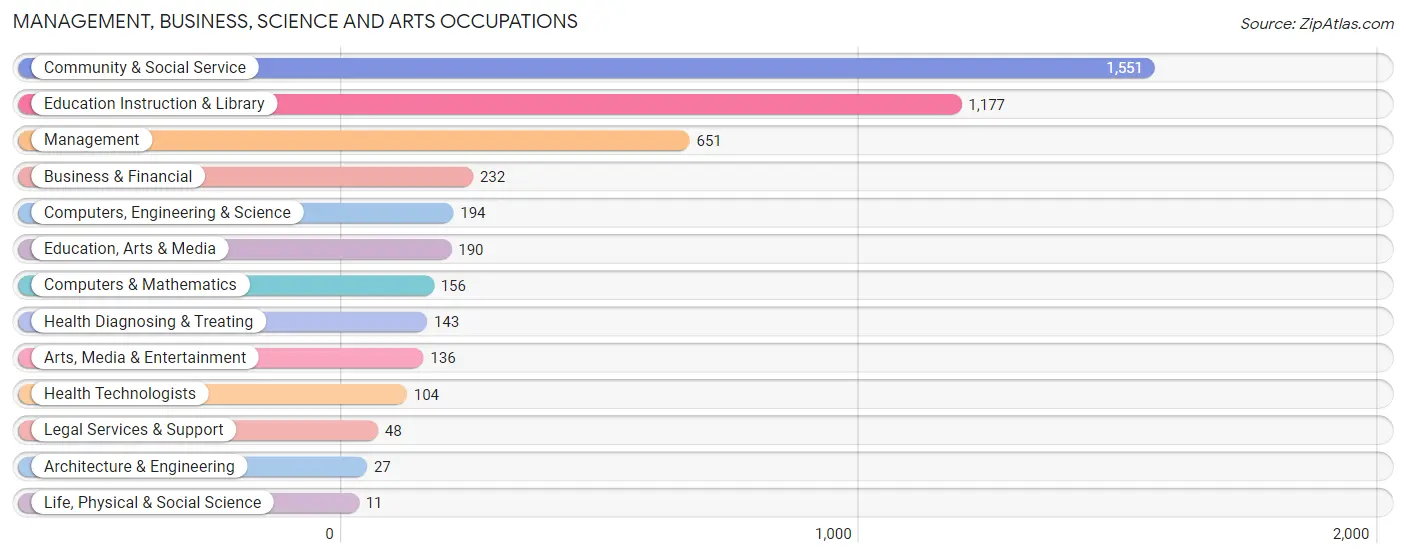
Management, Business, Science and Arts Occupations
The most common Management, Business, Science and Arts occupations in Boone are Community & Social Service (1,551 | 18.7%), Education Instruction & Library (1,177 | 14.2%), Management (651 | 7.9%), Business & Financial (232 | 2.8%), and Computers, Engineering & Science (194 | 2.3%).
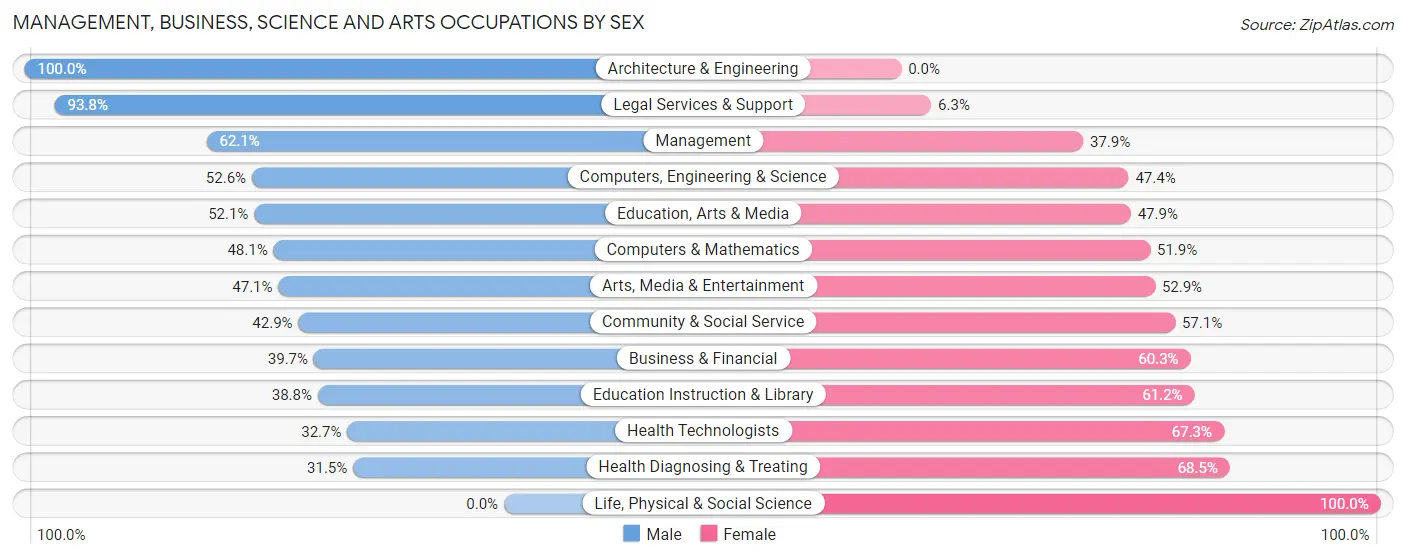
Management, Business, Science and Arts Occupations by Sex
Within the Management, Business, Science and Arts occupations in Boone, the most male-oriented occupations are Architecture & Engineering (100.0%), Legal Services & Support (93.8%), and Management (62.1%), while the most female-oriented occupations are Life, Physical & Social Science (100.0%), Health Diagnosing & Treating (68.5%), and Health Technologists (67.3%).
| Occupation | Male | Female |
| Management | 404 (62.1%) | 247 (37.9%) |
| Business & Financial | 92 (39.7%) | 140 (60.3%) |
| Computers, Engineering & Science | 102 (52.6%) | 92 (47.4%) |
| Computers & Mathematics | 75 (48.1%) | 81 (51.9%) |
| Architecture & Engineering | 27 (100.0%) | 0 (0.0%) |
| Life, Physical & Social Science | 0 (0.0%) | 11 (100.0%) |
| Community & Social Service | 665 (42.9%) | 886 (57.1%) |
| Education, Arts & Media | 99 (52.1%) | 91 (47.9%) |
| Legal Services & Support | 45 (93.8%) | 3 (6.2%) |
| Education Instruction & Library | 457 (38.8%) | 720 (61.2%) |
| Arts, Media & Entertainment | 64 (47.1%) | 72 (52.9%) |
| Health Diagnosing & Treating | 45 (31.5%) | 98 (68.5%) |
| Health Technologists | 34 (32.7%) | 70 (67.3%) |
| Total (Category) | 1,308 (47.2%) | 1,463 (52.8%) |
| Total (Overall) | 3,986 (48.1%) | 4,297 (51.9%) |
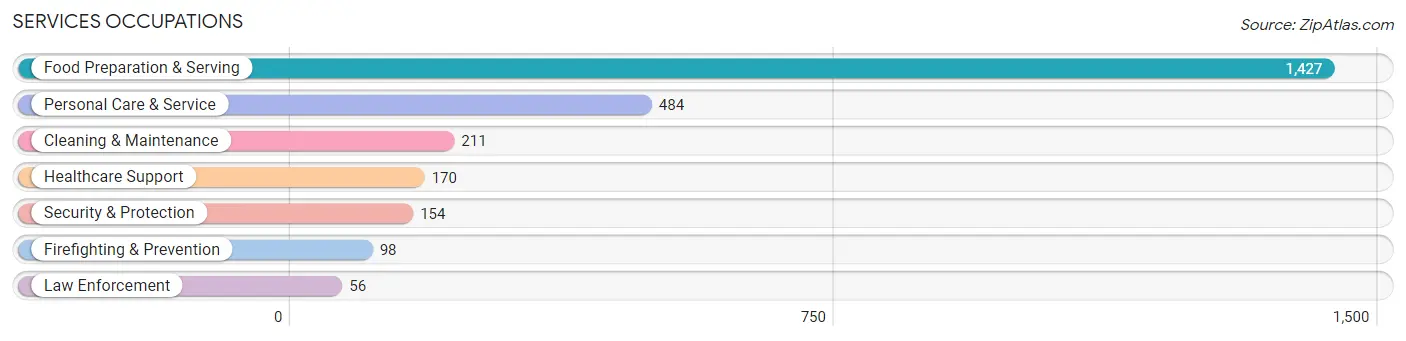
Services Occupations
The most common Services occupations in Boone are Food Preparation & Serving (1,427 | 17.2%), Personal Care & Service (484 | 5.8%), Cleaning & Maintenance (211 | 2.5%), Healthcare Support (170 | 2.1%), and Security & Protection (154 | 1.9%).
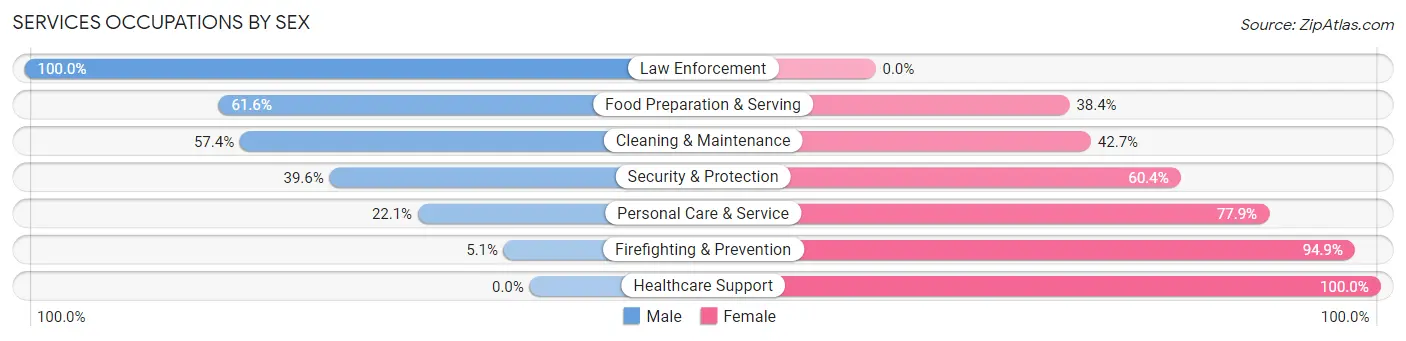
Services Occupations by Sex
Within the Services occupations in Boone, the most male-oriented occupations are Law Enforcement (100.0%), Food Preparation & Serving (61.6%), and Cleaning & Maintenance (57.4%), while the most female-oriented occupations are Healthcare Support (100.0%), Firefighting & Prevention (94.9%), and Personal Care & Service (77.9%).
| Occupation | Male | Female |
| Healthcare Support | 0 (0.0%) | 170 (100.0%) |
| Security & Protection | 61 (39.6%) | 93 (60.4%) |
| Firefighting & Prevention | 5 (5.1%) | 93 (94.9%) |
| Law Enforcement | 56 (100.0%) | 0 (0.0%) |
| Food Preparation & Serving | 879 (61.6%) | 548 (38.4%) |
| Cleaning & Maintenance | 121 (57.4%) | 90 (42.6%) |
| Personal Care & Service | 107 (22.1%) | 377 (77.9%) |
| Total (Category) | 1,168 (47.7%) | 1,278 (52.2%) |
| Total (Overall) | 3,986 (48.1%) | 4,297 (51.9%) |
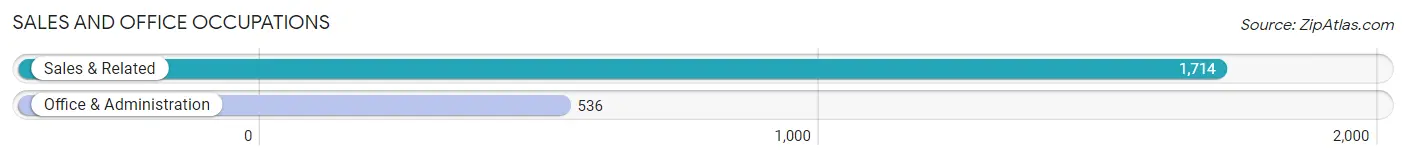
Sales and Office Occupations
The most common Sales and Office occupations in Boone are Sales & Related (1,714 | 20.7%), and Office & Administration (536 | 6.5%).
Sales and Office Occupations by Sex
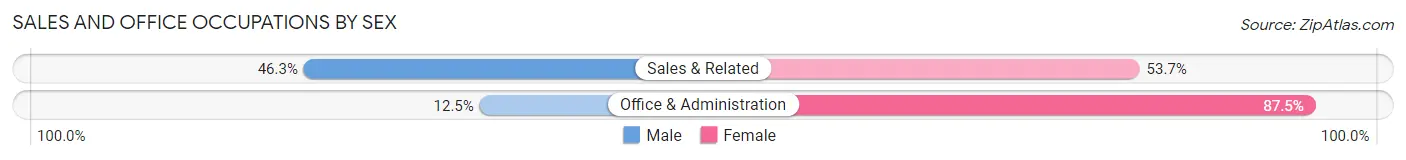
| Occupation | Male | Female |
| Sales & Related | 794 (46.3%) | 920 (53.7%) |
| Office & Administration | 67 (12.5%) | 469 (87.5%) |
| Total (Category) | 861 (38.3%) | 1,389 (61.7%) |
| Total (Overall) | 3,986 (48.1%) | 4,297 (51.9%) |
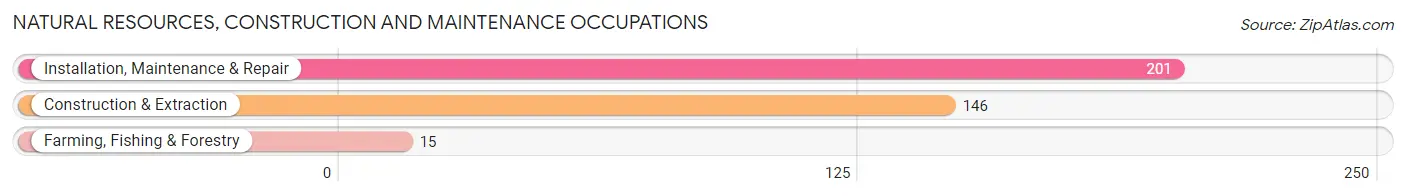
Natural Resources, Construction and Maintenance Occupations
The most common Natural Resources, Construction and Maintenance occupations in Boone are Installation, Maintenance & Repair (201 | 2.4%), Construction & Extraction (146 | 1.8%), and Farming, Fishing & Forestry (15 | 0.2%).
Natural Resources, Construction and Maintenance Occupations by Sex
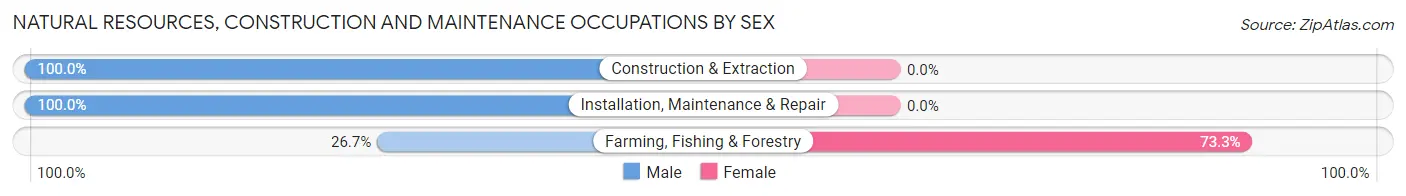
| Occupation | Male | Female |
| Farming, Fishing & Forestry | 4 (26.7%) | 11 (73.3%) |
| Construction & Extraction | 146 (100.0%) | 0 (0.0%) |
| Installation, Maintenance & Repair | 201 (100.0%) | 0 (0.0%) |
| Total (Category) | 351 (97.0%) | 11 (3.0%) |
| Total (Overall) | 3,986 (48.1%) | 4,297 (51.9%) |
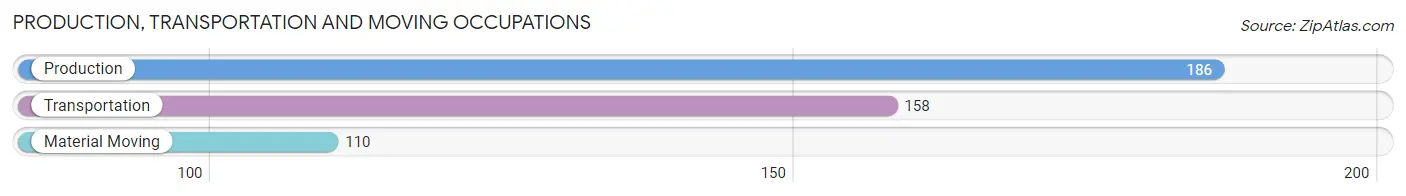
Production, Transportation and Moving Occupations
The most common Production, Transportation and Moving occupations in Boone are Production (186 | 2.2%), Transportation (158 | 1.9%), and Material Moving (110 | 1.3%).
Production, Transportation and Moving Occupations by Sex
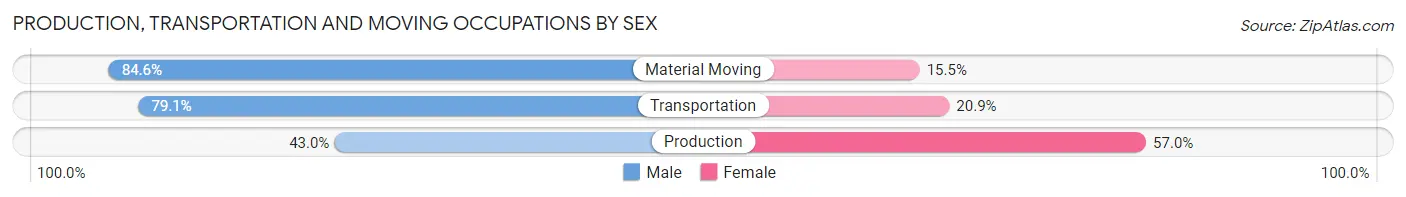
| Occupation | Male | Female |
| Production | 80 (43.0%) | 106 (57.0%) |
| Transportation | 125 (79.1%) | 33 (20.9%) |
| Material Moving | 93 (84.6%) | 17 (15.4%) |
| Total (Category) | 298 (65.6%) | 156 (34.4%) |
| Total (Overall) | 3,986 (48.1%) | 4,297 (51.9%) |
Employment Industries by Sex in Boone
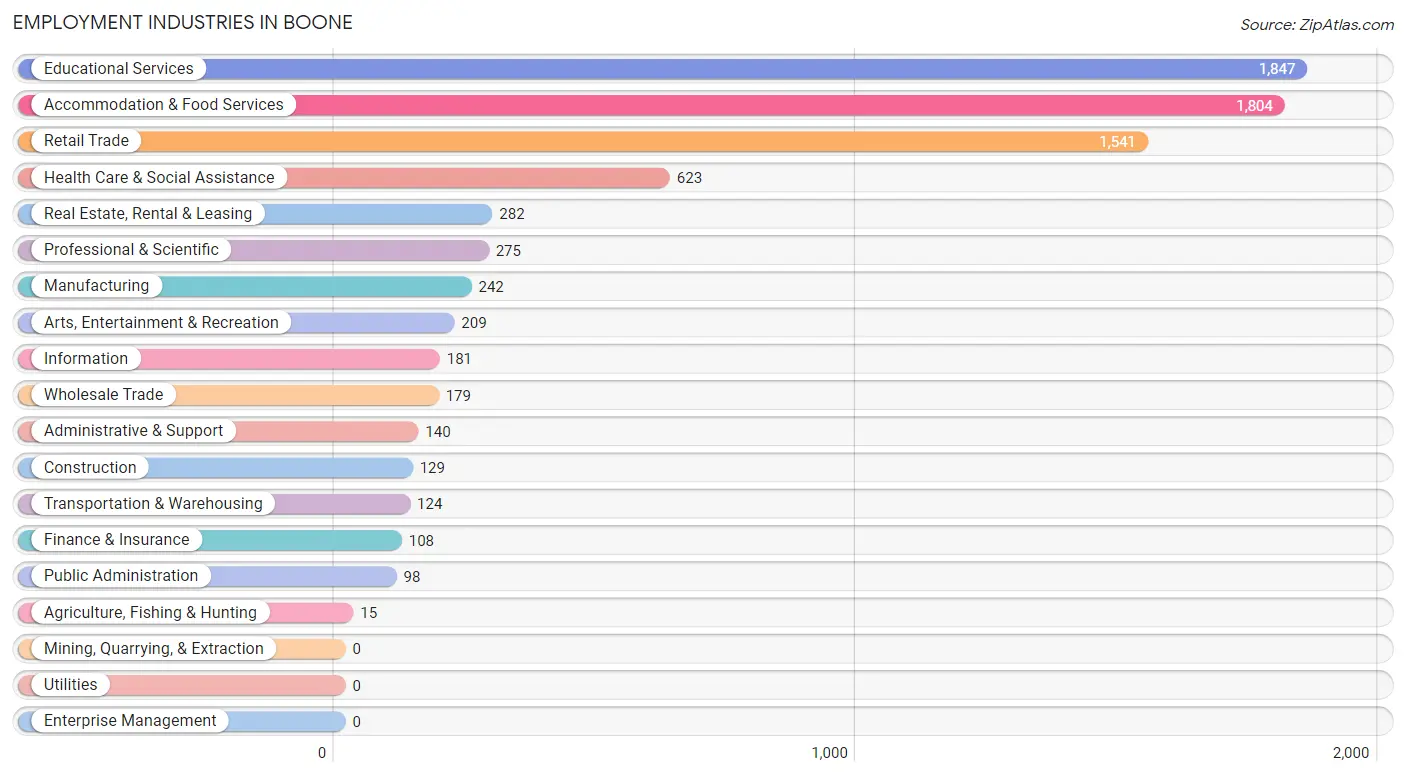
Employment Industries in Boone
The major employment industries in Boone include Educational Services (1,847 | 22.3%), Accommodation & Food Services (1,804 | 21.8%), Retail Trade (1,541 | 18.6%), Health Care & Social Assistance (623 | 7.5%), and Real Estate, Rental & Leasing (282 | 3.4%).
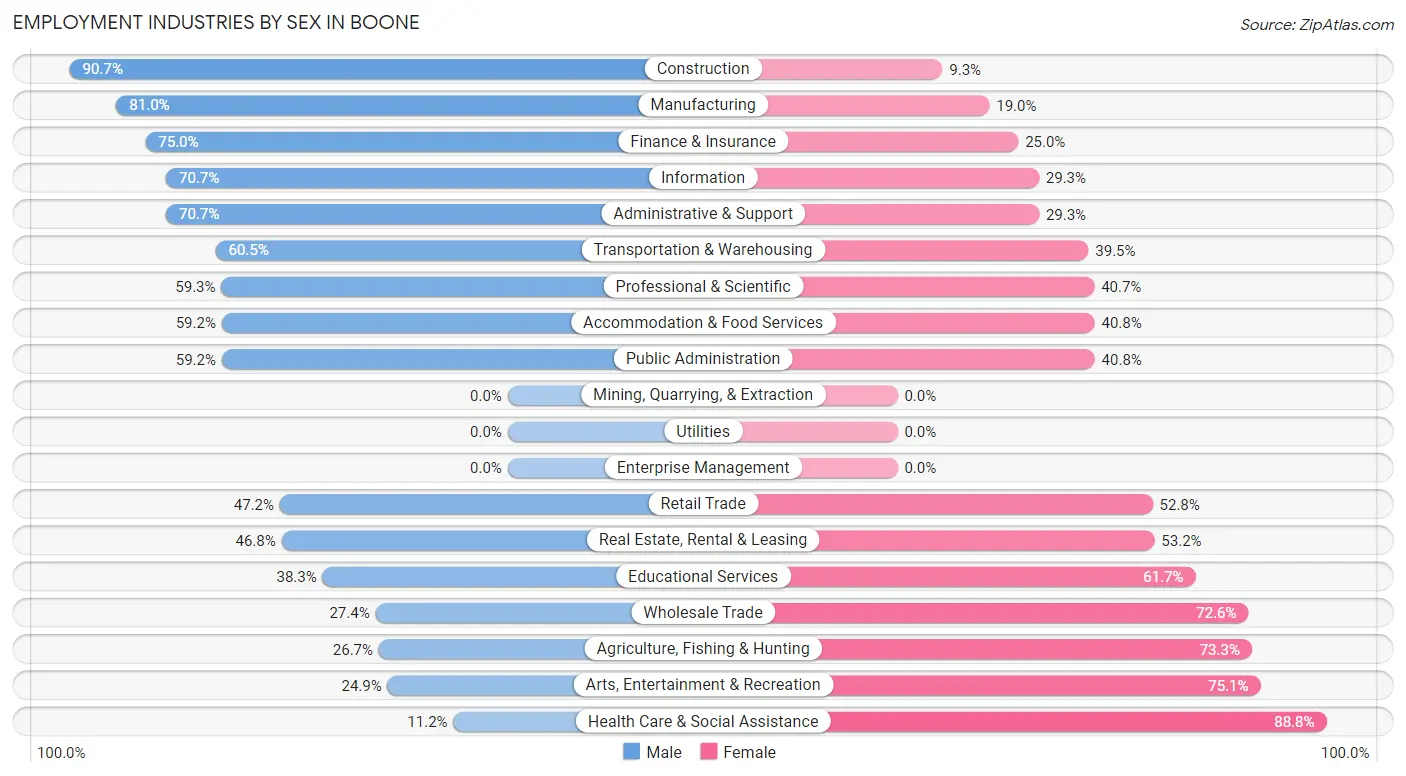
Employment Industries by Sex in Boone
The Boone industries that see more men than women are Construction (90.7%), Manufacturing (81.0%), and Finance & Insurance (75.0%), whereas the industries that tend to have a higher number of women are Health Care & Social Assistance (88.8%), Arts, Entertainment & Recreation (75.1%), and Agriculture, Fishing & Hunting (73.3%).
| Industry | Male | Female |
| Agriculture, Fishing & Hunting | 4 (26.7%) | 11 (73.3%) |
| Mining, Quarrying, & Extraction | 0 (0.0%) | 0 (0.0%) |
| Construction | 117 (90.7%) | 12 (9.3%) |
| Manufacturing | 196 (81.0%) | 46 (19.0%) |
| Wholesale Trade | 49 (27.4%) | 130 (72.6%) |
| Retail Trade | 727 (47.2%) | 814 (52.8%) |
| Transportation & Warehousing | 75 (60.5%) | 49 (39.5%) |
| Utilities | 0 (0.0%) | 0 (0.0%) |
| Information | 128 (70.7%) | 53 (29.3%) |
| Finance & Insurance | 81 (75.0%) | 27 (25.0%) |
| Real Estate, Rental & Leasing | 132 (46.8%) | 150 (53.2%) |
| Professional & Scientific | 163 (59.3%) | 112 (40.7%) |
| Enterprise Management | 0 (0.0%) | 0 (0.0%) |
| Administrative & Support | 99 (70.7%) | 41 (29.3%) |
| Educational Services | 708 (38.3%) | 1,139 (61.7%) |
| Health Care & Social Assistance | 70 (11.2%) | 553 (88.8%) |
| Arts, Entertainment & Recreation | 52 (24.9%) | 157 (75.1%) |
| Accommodation & Food Services | 1,068 (59.2%) | 736 (40.8%) |
| Public Administration | 58 (59.2%) | 40 (40.8%) |
| Total | 3,986 (48.1%) | 4,297 (51.9%) |
Education in Boone
School Enrollment in Boone
The most common levels of schooling among the 13,598 students in Boone are college / undergraduate (11,793 | 86.7%), graduate / professional (1,060 | 7.8%), and high school (299 | 2.2%).
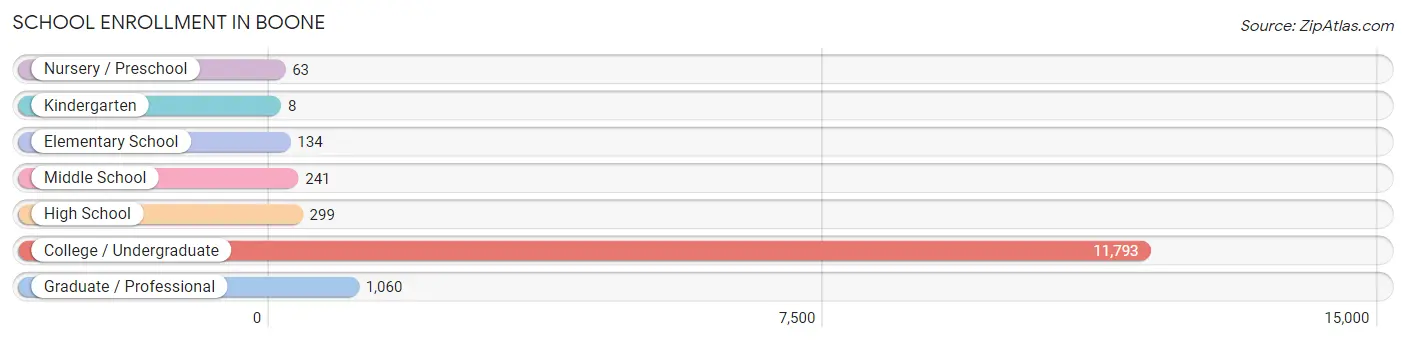
| School Level | # Students | % Students |
| Nursery / Preschool | 63 | 0.5% |
| Kindergarten | 8 | 0.1% |
| Elementary School | 134 | 1.0% |
| Middle School | 241 | 1.8% |
| High School | 299 | 2.2% |
| College / Undergraduate | 11,793 | 86.7% |
| Graduate / Professional | 1,060 | 7.8% |
| Total | 13,598 | 100.0% |
School Enrollment by Age by Funding Source in Boone
Out of a total of 13,598 students who are enrolled in schools in Boone, 354 (2.6%) attend a private institution, while the remaining 13,244 (97.4%) are enrolled in public schools. The age group of 25 to 34 year olds has the highest likelihood of being enrolled in private schools, with 105 (18.6% in the age bracket) enrolled. Conversely, the age group of 3 to 4 year olds has the lowest likelihood of being enrolled in a private school, with 63 (100.0% in the age bracket) attending a public institution.
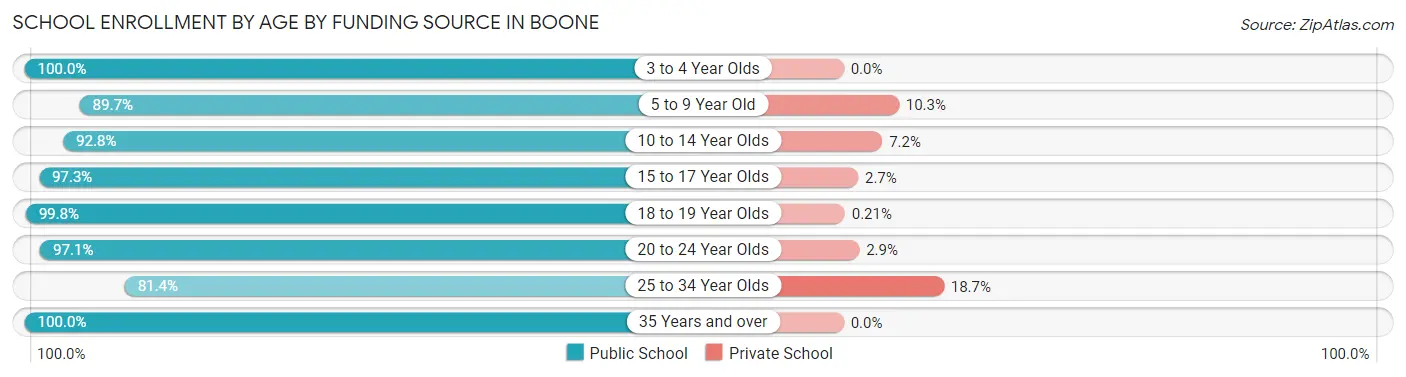
| Age Bracket | Public School | Private School |
| 3 to 4 Year Olds | 63 (100.0%) | 0 (0.0%) |
| 5 to 9 Year Old | 105 (89.7%) | 12 (10.3%) |
| 10 to 14 Year Olds | 362 (92.8%) | 28 (7.2%) |
| 15 to 17 Year Olds | 145 (97.3%) | 4 (2.7%) |
| 18 to 19 Year Olds | 5,248 (99.8%) | 11 (0.2%) |
| 20 to 24 Year Olds | 6,728 (97.1%) | 200 (2.9%) |
| 25 to 34 Year Olds | 458 (81.4%) | 105 (18.6%) |
| 35 Years and over | 129 (100.0%) | 0 (0.0%) |
| Total | 13,244 (97.4%) | 354 (2.6%) |
Educational Attainment by Field of Study in Boone
Education (471 | 16.0%), business (347 | 11.8%), psychology (301 | 10.2%), science & technology (255 | 8.7%), and communications (251 | 8.5%) are the most common fields of study among 2,942 individuals in Boone who have obtained a bachelor's degree or higher.
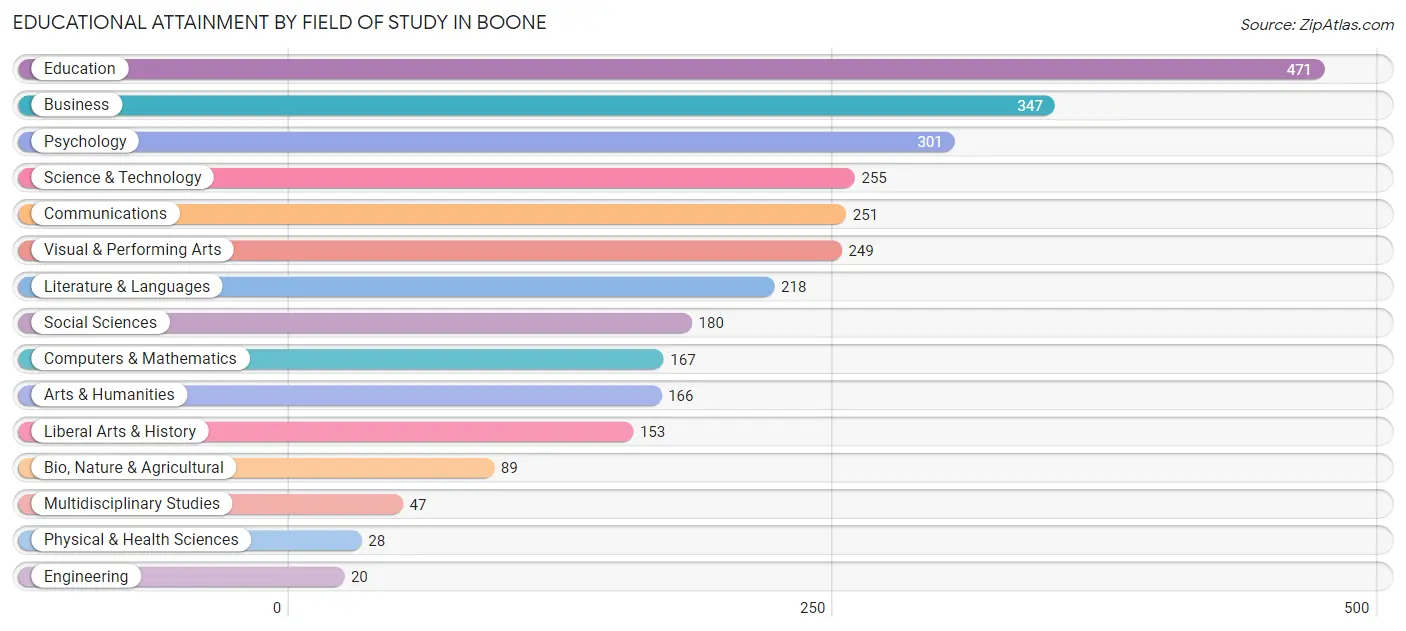
| Field of Study | # Graduates | % Graduates |
| Computers & Mathematics | 167 | 5.7% |
| Bio, Nature & Agricultural | 89 | 3.0% |
| Physical & Health Sciences | 28 | 0.9% |
| Psychology | 301 | 10.2% |
| Social Sciences | 180 | 6.1% |
| Engineering | 20 | 0.7% |
| Multidisciplinary Studies | 47 | 1.6% |
| Science & Technology | 255 | 8.7% |
| Business | 347 | 11.8% |
| Education | 471 | 16.0% |
| Literature & Languages | 218 | 7.4% |
| Liberal Arts & History | 153 | 5.2% |
| Visual & Performing Arts | 249 | 8.5% |
| Communications | 251 | 8.5% |
| Arts & Humanities | 166 | 5.6% |
| Total | 2,942 | 100.0% |
Transportation & Commute in Boone
Vehicle Availability by Sex in Boone
The most prevalent vehicle ownership categories in Boone are males with 2 vehicles (1,112, accounting for 32.6%) and females with 2 vehicles (1,674, making up 30.2%).
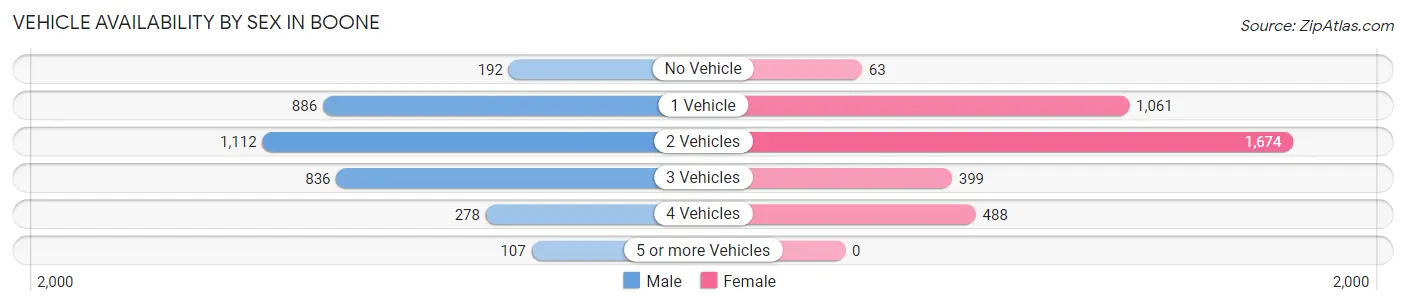
| Vehicles Available | Male | Female |
| No Vehicle | 192 (5.6%) | 63 (1.7%) |
| 1 Vehicle | 886 (26.0%) | 1,061 (28.8%) |
| 2 Vehicles | 1,112 (32.6%) | 1,674 (45.4%) |
| 3 Vehicles | 836 (24.5%) | 399 (10.8%) |
| 4 Vehicles | 278 (8.2%) | 488 (13.2%) |
| 5 or more Vehicles | 107 (3.1%) | 0 (0.0%) |
| Total | 3,411 (100.0%) | 3,685 (100.0%) |
Commute Time in Boone
The most frequently occuring commute durations in Boone are 10 to 14 minutes (2,085 commuters, 29.8%), 5 to 9 minutes (1,673 commuters, 23.9%), and 15 to 19 minutes (1,254 commuters, 17.9%).
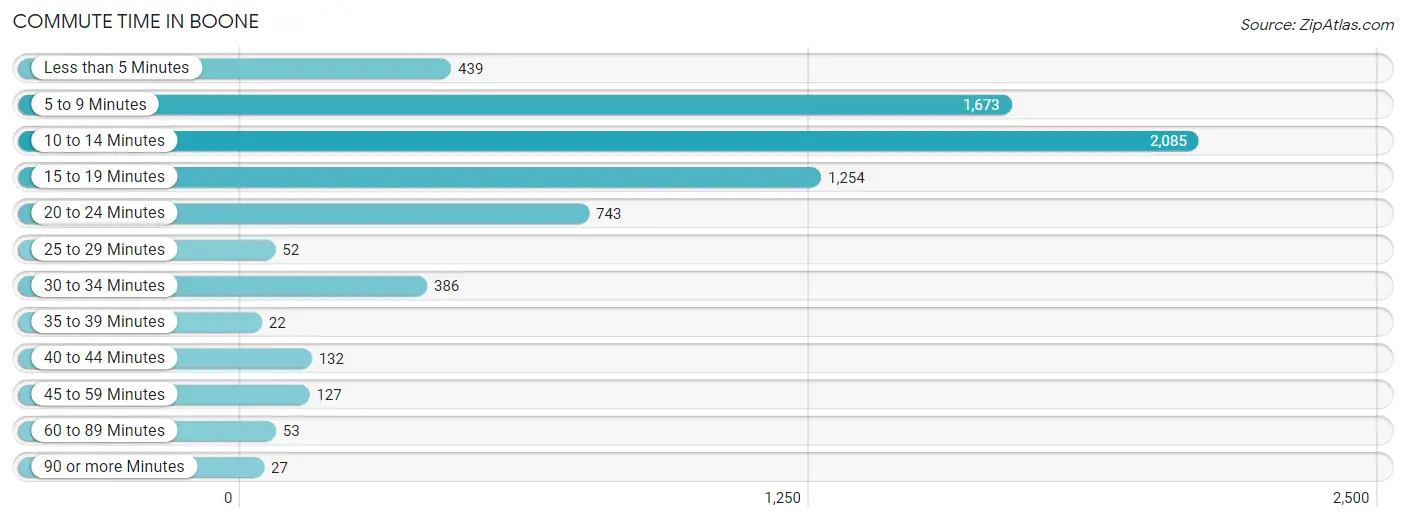
| Commute Time | # Commuters | % Commuters |
| Less than 5 Minutes | 439 | 6.3% |
| 5 to 9 Minutes | 1,673 | 23.9% |
| 10 to 14 Minutes | 2,085 | 29.8% |
| 15 to 19 Minutes | 1,254 | 17.9% |
| 20 to 24 Minutes | 743 | 10.6% |
| 25 to 29 Minutes | 52 | 0.7% |
| 30 to 34 Minutes | 386 | 5.5% |
| 35 to 39 Minutes | 22 | 0.3% |
| 40 to 44 Minutes | 132 | 1.9% |
| 45 to 59 Minutes | 127 | 1.8% |
| 60 to 89 Minutes | 53 | 0.8% |
| 90 or more Minutes | 27 | 0.4% |
Commute Time by Sex in Boone
The most common commute times in Boone are 5 to 9 minutes (792 commuters, 23.9%) for males and 10 to 14 minutes (1,424 commuters, 38.8%) for females.
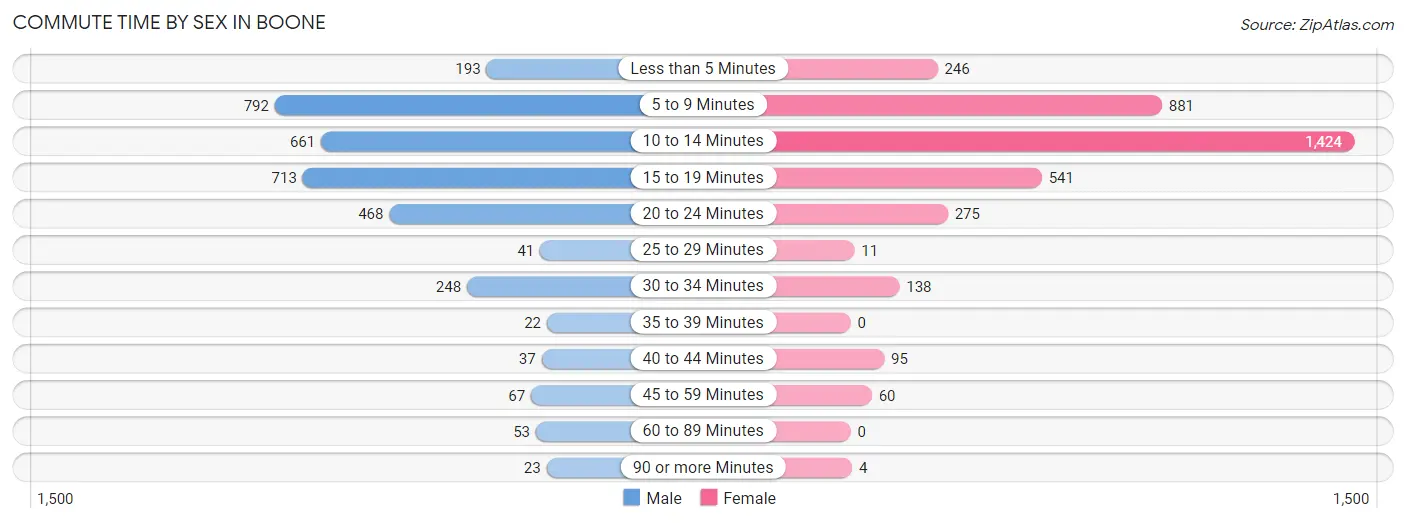
| Commute Time | Male | Female |
| Less than 5 Minutes | 193 (5.8%) | 246 (6.7%) |
| 5 to 9 Minutes | 792 (23.9%) | 881 (24.0%) |
| 10 to 14 Minutes | 661 (19.9%) | 1,424 (38.8%) |
| 15 to 19 Minutes | 713 (21.5%) | 541 (14.7%) |
| 20 to 24 Minutes | 468 (14.1%) | 275 (7.5%) |
| 25 to 29 Minutes | 41 (1.2%) | 11 (0.3%) |
| 30 to 34 Minutes | 248 (7.5%) | 138 (3.8%) |
| 35 to 39 Minutes | 22 (0.7%) | 0 (0.0%) |
| 40 to 44 Minutes | 37 (1.1%) | 95 (2.6%) |
| 45 to 59 Minutes | 67 (2.0%) | 60 (1.6%) |
| 60 to 89 Minutes | 53 (1.6%) | 0 (0.0%) |
| 90 or more Minutes | 23 (0.7%) | 4 (0.1%) |
Time of Departure to Work by Sex in Boone
The most frequent times of departure to work in Boone are 12:00 PM to 3:59 PM (733, 22.1%) for males and 12:00 PM to 3:59 PM (768, 20.9%) for females.
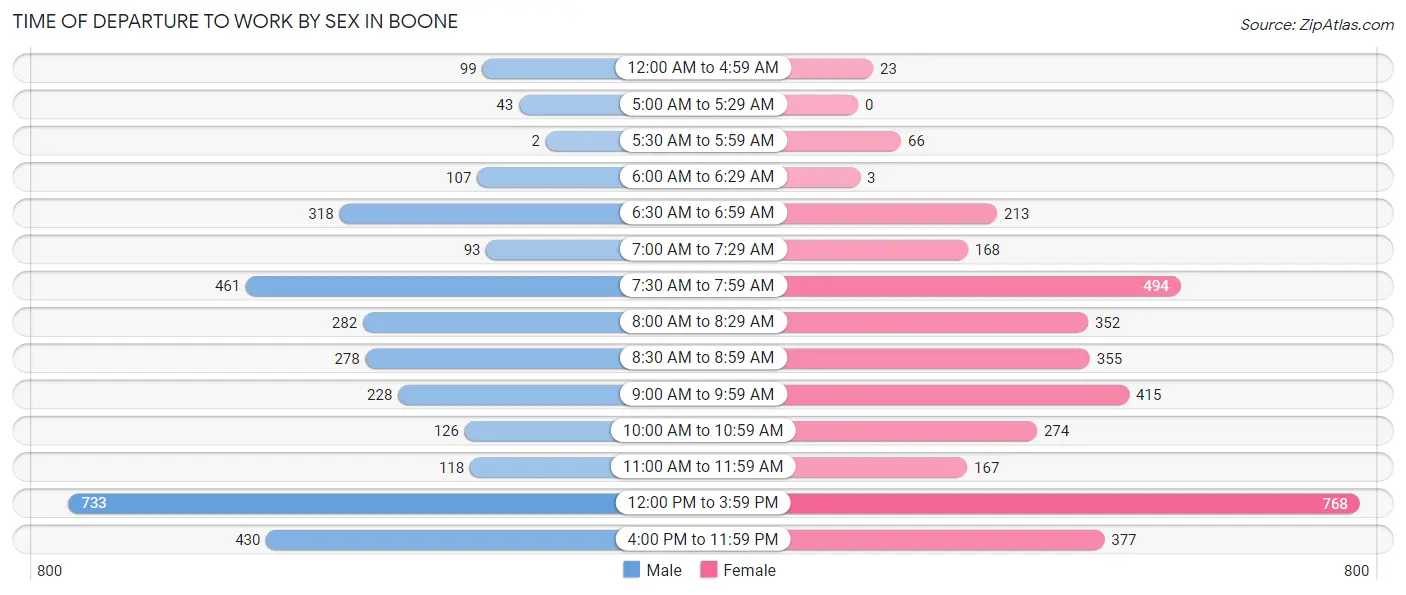
| Time of Departure | Male | Female |
| 12:00 AM to 4:59 AM | 99 (3.0%) | 23 (0.6%) |
| 5:00 AM to 5:29 AM | 43 (1.3%) | 0 (0.0%) |
| 5:30 AM to 5:59 AM | 2 (0.1%) | 66 (1.8%) |
| 6:00 AM to 6:29 AM | 107 (3.2%) | 3 (0.1%) |
| 6:30 AM to 6:59 AM | 318 (9.6%) | 213 (5.8%) |
| 7:00 AM to 7:29 AM | 93 (2.8%) | 168 (4.6%) |
| 7:30 AM to 7:59 AM | 461 (13.9%) | 494 (13.4%) |
| 8:00 AM to 8:29 AM | 282 (8.5%) | 352 (9.6%) |
| 8:30 AM to 8:59 AM | 278 (8.4%) | 355 (9.7%) |
| 9:00 AM to 9:59 AM | 228 (6.9%) | 415 (11.3%) |
| 10:00 AM to 10:59 AM | 126 (3.8%) | 274 (7.5%) |
| 11:00 AM to 11:59 AM | 118 (3.6%) | 167 (4.5%) |
| 12:00 PM to 3:59 PM | 733 (22.1%) | 768 (20.9%) |
| 4:00 PM to 11:59 PM | 430 (13.0%) | 377 (10.3%) |
| Total | 3,318 (100.0%) | 3,675 (100.0%) |
Housing Occupancy in Boone
Occupancy by Ownership in Boone
Of the total 5,839 dwellings in Boone, owner-occupied units account for 1,337 (22.9%), while renter-occupied units make up 4,502 (77.1%).
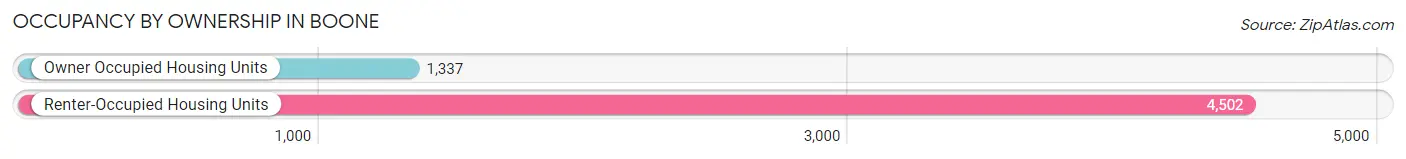
| Occupancy | # Housing Units | % Housing Units |
| Owner Occupied Housing Units | 1,337 | 22.9% |
| Renter-Occupied Housing Units | 4,502 | 77.1% |
| Total Occupied Housing Units | 5,839 | 100.0% |
Occupancy by Household Size in Boone
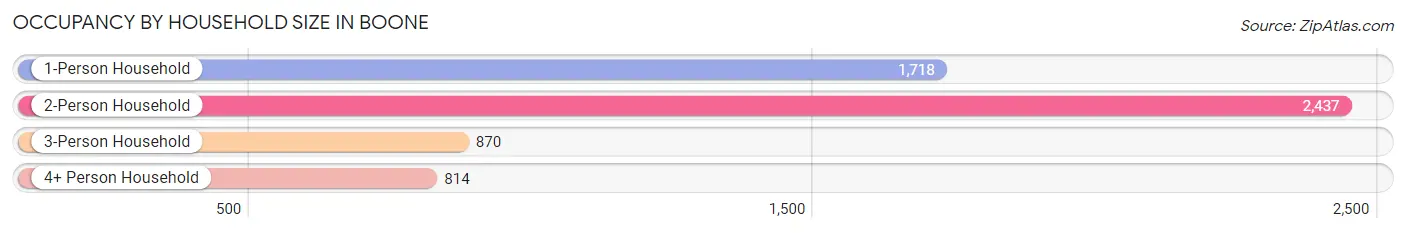
| Household Size | # Housing Units | % Housing Units |
| 1-Person Household | 1,718 | 29.4% |
| 2-Person Household | 2,437 | 41.7% |
| 3-Person Household | 870 | 14.9% |
| 4+ Person Household | 814 | 13.9% |
| Total Housing Units | 5,839 | 100.0% |
Occupancy by Ownership by Household Size in Boone
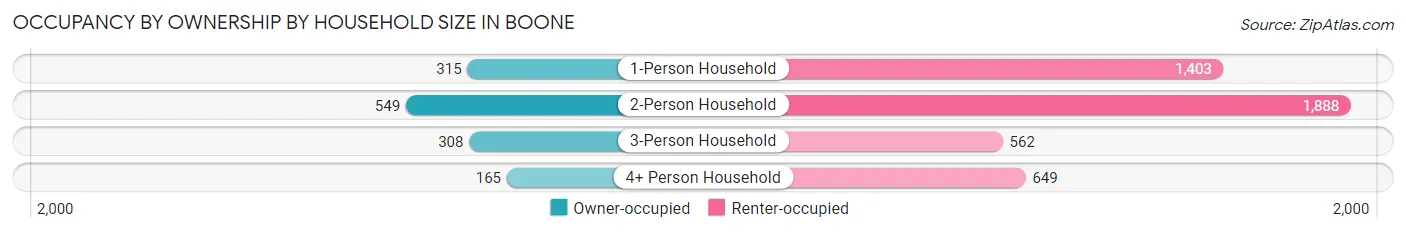
| Household Size | Owner-occupied | Renter-occupied |
| 1-Person Household | 315 (18.3%) | 1,403 (81.7%) |
| 2-Person Household | 549 (22.5%) | 1,888 (77.5%) |
| 3-Person Household | 308 (35.4%) | 562 (64.6%) |
| 4+ Person Household | 165 (20.3%) | 649 (79.7%) |
| Total Housing Units | 1,337 (22.9%) | 4,502 (77.1%) |
Occupancy by Educational Attainment in Boone
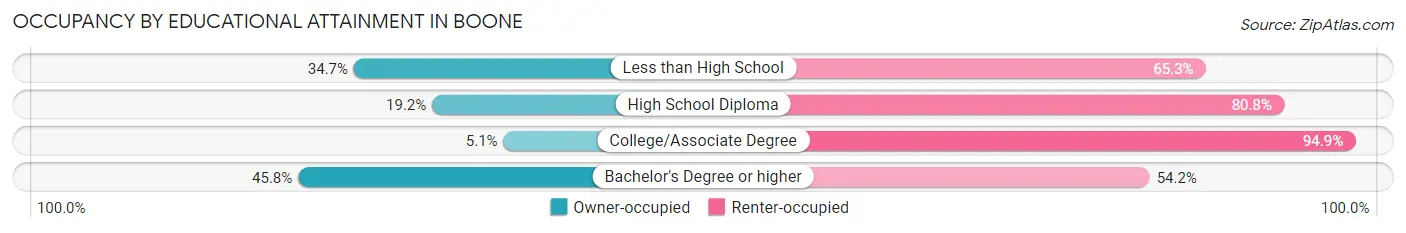
| Household Size | Owner-occupied | Renter-occupied |
| Less than High School | 50 (34.7%) | 94 (65.3%) |
| High School Diploma | 159 (19.2%) | 669 (80.8%) |
| College/Associate Degree | 137 (5.1%) | 2,565 (94.9%) |
| Bachelor's Degree or higher | 991 (45.8%) | 1,174 (54.2%) |
Occupancy by Age of Householder in Boone
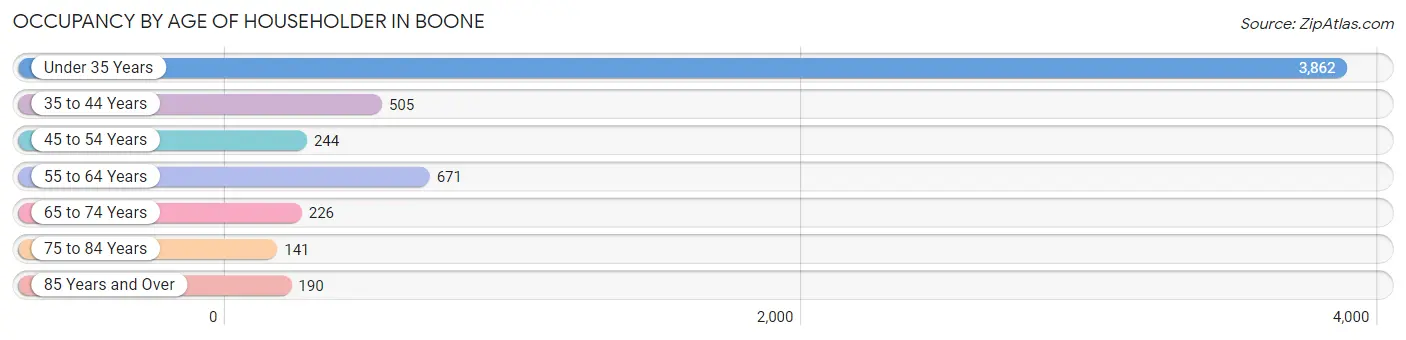
| Age Bracket | # Households | % Households |
| Under 35 Years | 3,862 | 66.1% |
| 35 to 44 Years | 505 | 8.6% |
| 45 to 54 Years | 244 | 4.2% |
| 55 to 64 Years | 671 | 11.5% |
| 65 to 74 Years | 226 | 3.9% |
| 75 to 84 Years | 141 | 2.4% |
| 85 Years and Over | 190 | 3.3% |
| Total | 5,839 | 100.0% |
Housing Finances in Boone
Median Income by Occupancy in Boone
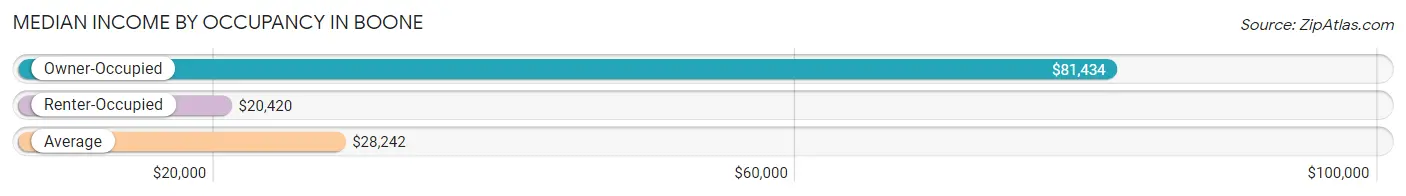
| Occupancy Type | # Households | Median Income |
| Owner-Occupied | 1,337 (22.9%) | $81,434 |
| Renter-Occupied | 4,502 (77.1%) | $20,420 |
| Average | 5,839 (100.0%) | $28,242 |
Occupancy by Householder Income Bracket in Boone
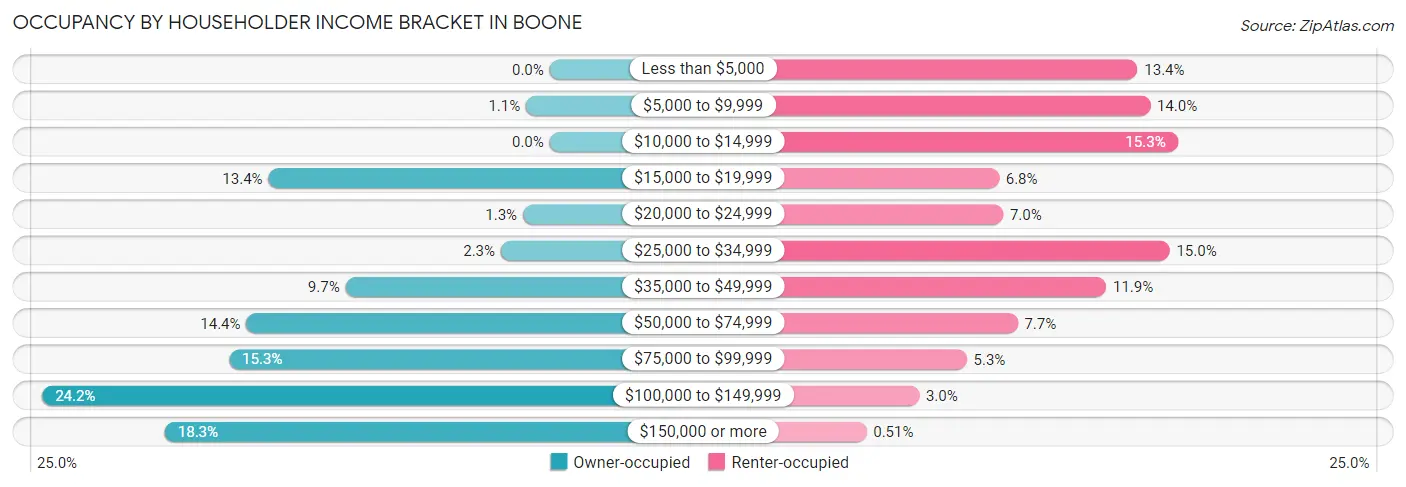
| Income Bracket | Owner-occupied | Renter-occupied |
| Less than $5,000 | 0 (0.0%) | 604 (13.4%) |
| $5,000 to $9,999 | 15 (1.1%) | 631 (14.0%) |
| $10,000 to $14,999 | 0 (0.0%) | 690 (15.3%) |
| $15,000 to $19,999 | 179 (13.4%) | 307 (6.8%) |
| $20,000 to $24,999 | 17 (1.3%) | 316 (7.0%) |
| $25,000 to $34,999 | 31 (2.3%) | 673 (14.9%) |
| $35,000 to $49,999 | 130 (9.7%) | 537 (11.9%) |
| $50,000 to $74,999 | 193 (14.4%) | 347 (7.7%) |
| $75,000 to $99,999 | 204 (15.3%) | 238 (5.3%) |
| $100,000 to $149,999 | 323 (24.2%) | 136 (3.0%) |
| $150,000 or more | 245 (18.3%) | 23 (0.5%) |
| Total | 1,337 (100.0%) | 4,502 (100.0%) |
Monthly Housing Cost Tiers in Boone
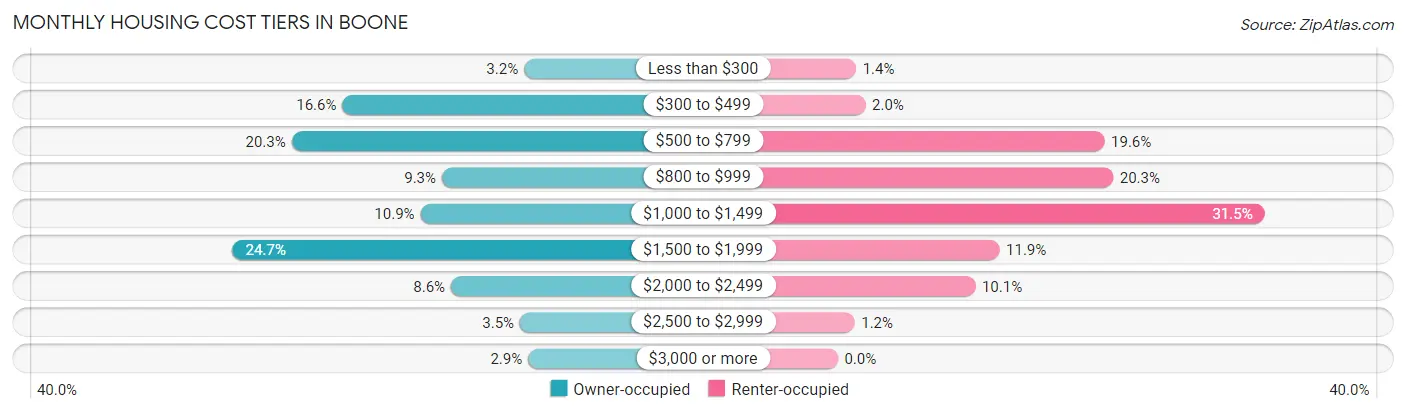
| Monthly Cost | Owner-occupied | Renter-occupied |
| Less than $300 | 43 (3.2%) | 61 (1.3%) |
| $300 to $499 | 222 (16.6%) | 92 (2.0%) |
| $500 to $799 | 272 (20.3%) | 884 (19.6%) |
| $800 to $999 | 124 (9.3%) | 913 (20.3%) |
| $1,000 to $1,499 | 145 (10.8%) | 1,416 (31.5%) |
| $1,500 to $1,999 | 330 (24.7%) | 536 (11.9%) |
| $2,000 to $2,499 | 115 (8.6%) | 456 (10.1%) |
| $2,500 to $2,999 | 47 (3.5%) | 56 (1.2%) |
| $3,000 or more | 39 (2.9%) | 0 (0.0%) |
| Total | 1,337 (100.0%) | 4,502 (100.0%) |
Physical Housing Characteristics in Boone
Housing Structures in Boone
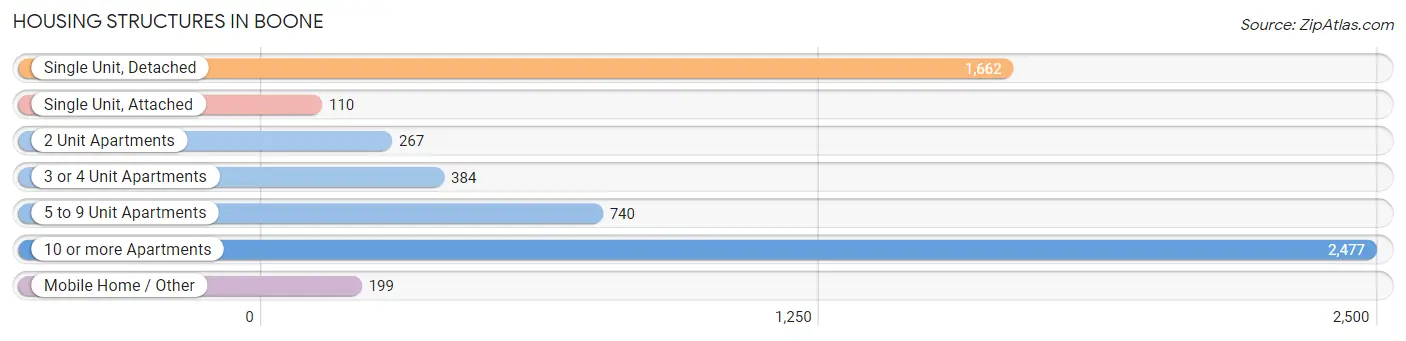
| Structure Type | # Housing Units | % Housing Units |
| Single Unit, Detached | 1,662 | 28.5% |
| Single Unit, Attached | 110 | 1.9% |
| 2 Unit Apartments | 267 | 4.6% |
| 3 or 4 Unit Apartments | 384 | 6.6% |
| 5 to 9 Unit Apartments | 740 | 12.7% |
| 10 or more Apartments | 2,477 | 42.4% |
| Mobile Home / Other | 199 | 3.4% |
| Total | 5,839 | 100.0% |
Housing Structures by Occupancy in Boone
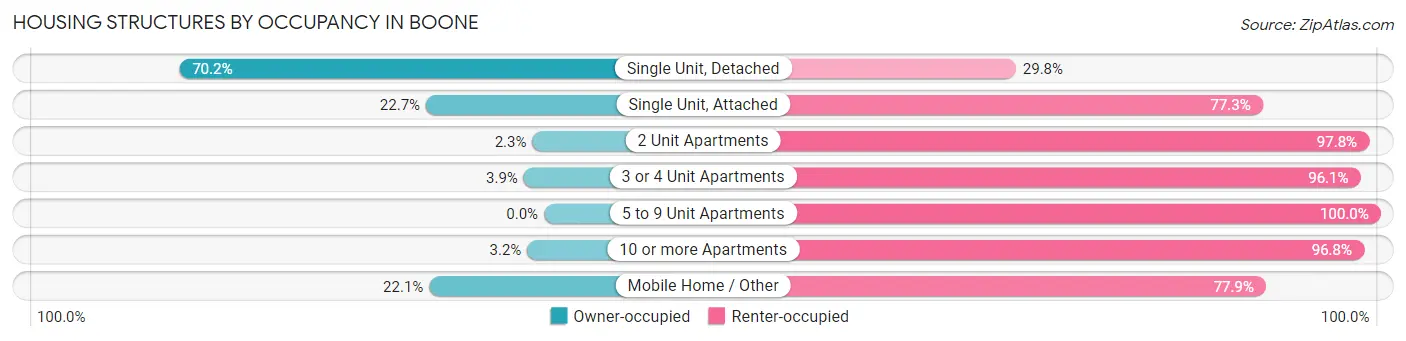
| Structure Type | Owner-occupied | Renter-occupied |
| Single Unit, Detached | 1,167 (70.2%) | 495 (29.8%) |
| Single Unit, Attached | 25 (22.7%) | 85 (77.3%) |
| 2 Unit Apartments | 6 (2.2%) | 261 (97.8%) |
| 3 or 4 Unit Apartments | 15 (3.9%) | 369 (96.1%) |
| 5 to 9 Unit Apartments | 0 (0.0%) | 740 (100.0%) |
| 10 or more Apartments | 80 (3.2%) | 2,397 (96.8%) |
| Mobile Home / Other | 44 (22.1%) | 155 (77.9%) |
| Total | 1,337 (22.9%) | 4,502 (77.1%) |
Housing Structures by Number of Rooms in Boone
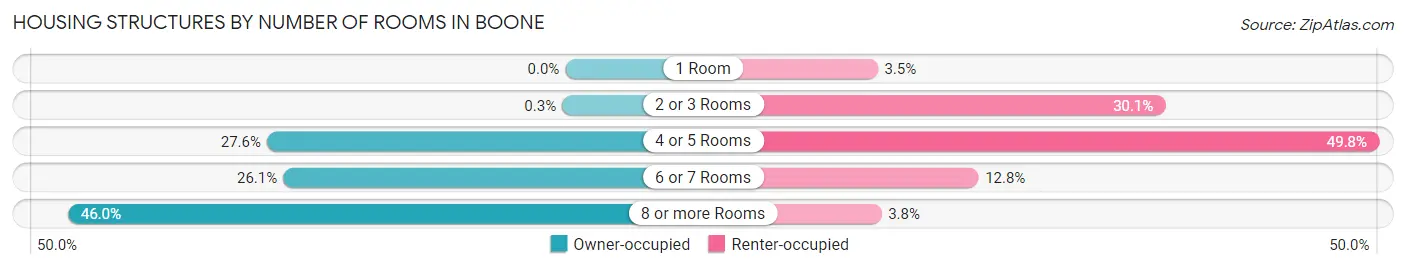
| Number of Rooms | Owner-occupied | Renter-occupied |
| 1 Room | 0 (0.0%) | 156 (3.5%) |
| 2 or 3 Rooms | 4 (0.3%) | 1,354 (30.1%) |
| 4 or 5 Rooms | 369 (27.6%) | 2,244 (49.8%) |
| 6 or 7 Rooms | 349 (26.1%) | 576 (12.8%) |
| 8 or more Rooms | 615 (46.0%) | 172 (3.8%) |
| Total | 1,337 (100.0%) | 4,502 (100.0%) |
Housing Structure by Heating Type in Boone
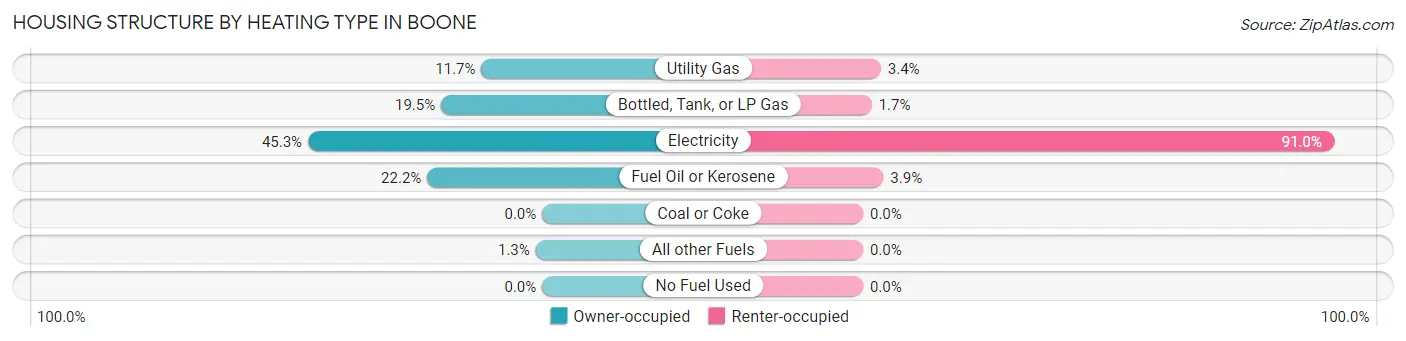
| Heating Type | Owner-occupied | Renter-occupied |
| Utility Gas | 157 (11.7%) | 155 (3.4%) |
| Bottled, Tank, or LP Gas | 261 (19.5%) | 75 (1.7%) |
| Electricity | 605 (45.3%) | 4,095 (91.0%) |
| Fuel Oil or Kerosene | 297 (22.2%) | 177 (3.9%) |
| Coal or Coke | 0 (0.0%) | 0 (0.0%) |
| All other Fuels | 17 (1.3%) | 0 (0.0%) |
| No Fuel Used | 0 (0.0%) | 0 (0.0%) |
| Total | 1,337 (100.0%) | 4,502 (100.0%) |
Household Vehicle Usage in Boone
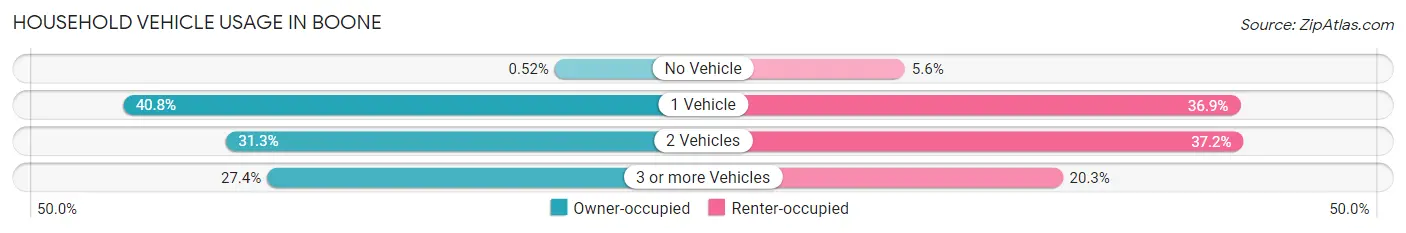
| Vehicles per Household | Owner-occupied | Renter-occupied |
| No Vehicle | 7 (0.5%) | 252 (5.6%) |
| 1 Vehicle | 546 (40.8%) | 1,661 (36.9%) |
| 2 Vehicles | 418 (31.3%) | 1,674 (37.2%) |
| 3 or more Vehicles | 366 (27.4%) | 915 (20.3%) |
| Total | 1,337 (100.0%) | 4,502 (100.0%) |
Real Estate & Mortgages in Boone
Real Estate and Mortgage Overview in Boone
| Characteristic | Without Mortgage | With Mortgage |
| Housing Units | 584 | 753 |
| Median Property Value | $282,700 | $366,700 |
| Median Household Income | $62,500 | $170 |
| Monthly Housing Costs | $604 | $39 |
| Real Estate Taxes | $1,431 | $0 |
Property Value by Mortgage Status in Boone
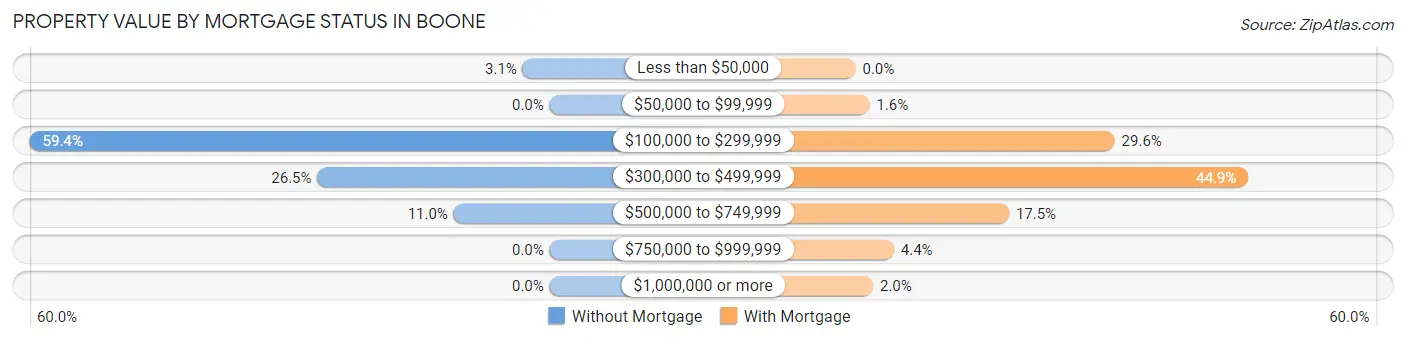
| Property Value | Without Mortgage | With Mortgage |
| Less than $50,000 | 18 (3.1%) | 0 (0.0%) |
| $50,000 to $99,999 | 0 (0.0%) | 12 (1.6%) |
| $100,000 to $299,999 | 347 (59.4%) | 223 (29.6%) |
| $300,000 to $499,999 | 155 (26.5%) | 338 (44.9%) |
| $500,000 to $749,999 | 64 (11.0%) | 132 (17.5%) |
| $750,000 to $999,999 | 0 (0.0%) | 33 (4.4%) |
| $1,000,000 or more | 0 (0.0%) | 15 (2.0%) |
| Total | 584 (100.0%) | 753 (100.0%) |
Household Income by Mortgage Status in Boone
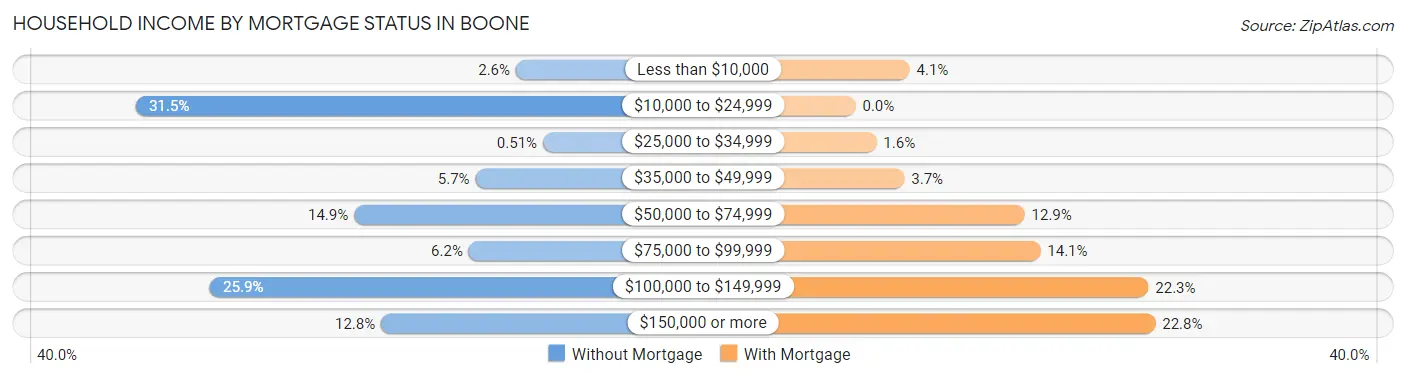
| Household Income | Without Mortgage | With Mortgage |
| Less than $10,000 | 15 (2.6%) | 31 (4.1%) |
| $10,000 to $24,999 | 184 (31.5%) | 0 (0.0%) |
| $25,000 to $34,999 | 3 (0.5%) | 12 (1.6%) |
| $35,000 to $49,999 | 33 (5.7%) | 28 (3.7%) |
| $50,000 to $74,999 | 87 (14.9%) | 97 (12.9%) |
| $75,000 to $99,999 | 36 (6.2%) | 106 (14.1%) |
| $100,000 to $149,999 | 151 (25.9%) | 168 (22.3%) |
| $150,000 or more | 75 (12.8%) | 172 (22.8%) |
| Total | 584 (100.0%) | 753 (100.0%) |
Property Value to Household Income Ratio in Boone
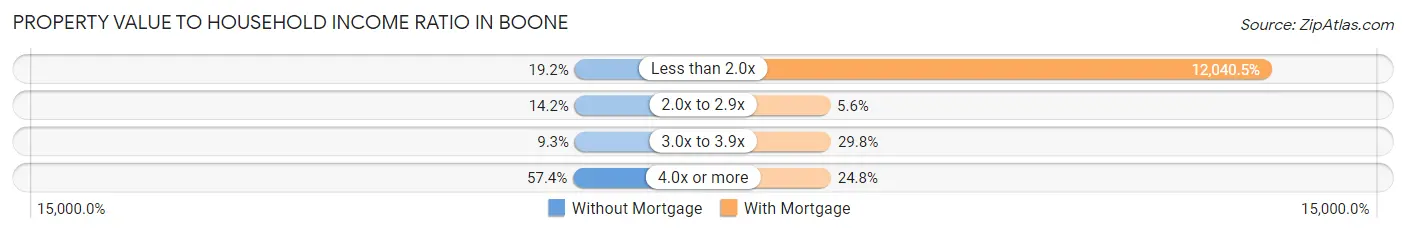
| Value-to-Income Ratio | Without Mortgage | With Mortgage |
| Less than 2.0x | 112 (19.2%) | 90,665 (12,040.5%) |
| 2.0x to 2.9x | 83 (14.2%) | 42 (5.6%) |
| 3.0x to 3.9x | 54 (9.2%) | 224 (29.7%) |
| 4.0x or more | 335 (57.4%) | 187 (24.8%) |
| Total | 584 (100.0%) | 753 (100.0%) |
Real Estate Taxes by Mortgage Status in Boone
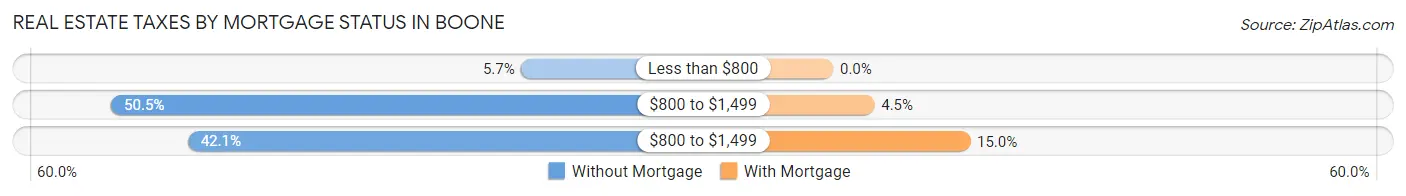
| Property Taxes | Without Mortgage | With Mortgage |
| Less than $800 | 33 (5.7%) | 0 (0.0%) |
| $800 to $1,499 | 295 (50.5%) | 34 (4.5%) |
| $800 to $1,499 | 246 (42.1%) | 113 (15.0%) |
| Total | 584 (100.0%) | 753 (100.0%) |
Health & Disability in Boone
Health Insurance Coverage by Age in Boone
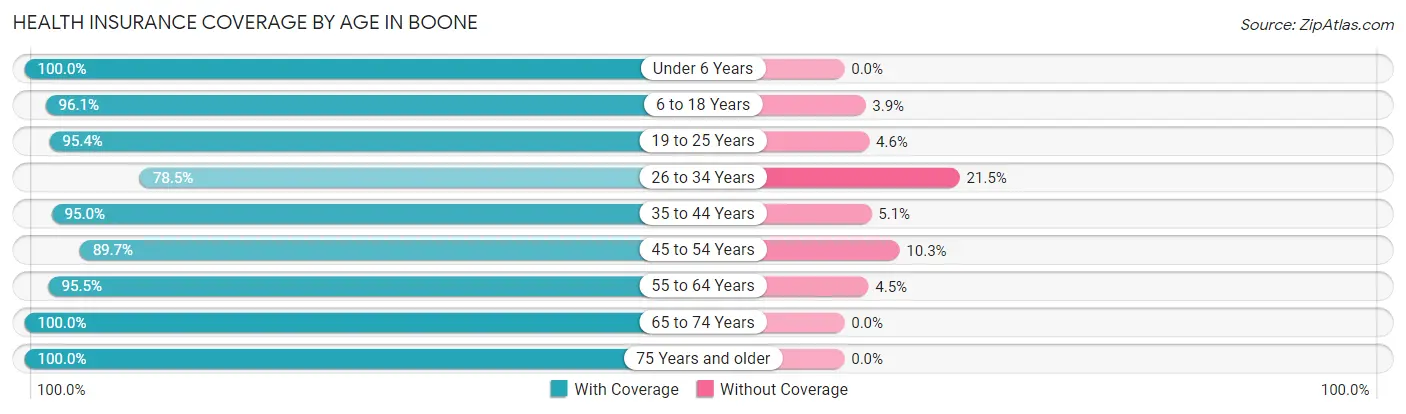
| Age Bracket | With Coverage | Without Coverage |
| Under 6 Years | 260 (100.0%) | 0 (0.0%) |
| 6 to 18 Years | 2,863 (96.1%) | 117 (3.9%) |
| 19 to 25 Years | 10,638 (95.4%) | 516 (4.6%) |
| 26 to 34 Years | 989 (78.5%) | 271 (21.5%) |
| 35 to 44 Years | 1,110 (95.0%) | 59 (5.1%) |
| 45 to 54 Years | 576 (89.7%) | 66 (10.3%) |
| 55 to 64 Years | 914 (95.5%) | 43 (4.5%) |
| 65 to 74 Years | 399 (100.0%) | 0 (0.0%) |
| 75 Years and older | 438 (100.0%) | 0 (0.0%) |
| Total | 18,187 (94.4%) | 1,072 (5.6%) |
Health Insurance Coverage by Citizenship Status in Boone
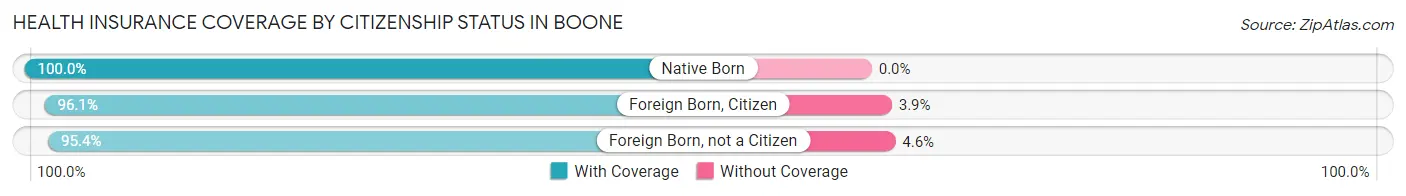
| Citizenship Status | With Coverage | Without Coverage |
| Native Born | 260 (100.0%) | 0 (0.0%) |
| Foreign Born, Citizen | 2,863 (96.1%) | 117 (3.9%) |
| Foreign Born, not a Citizen | 10,638 (95.4%) | 516 (4.6%) |
Health Insurance Coverage by Household Income in Boone
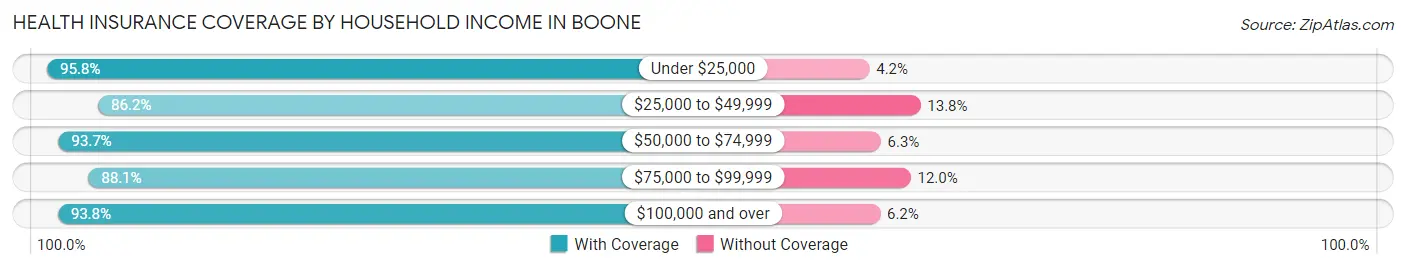
| Household Income | With Coverage | Without Coverage |
| Under $25,000 | 5,945 (95.8%) | 261 (4.2%) |
| $25,000 to $49,999 | 2,898 (86.2%) | 463 (13.8%) |
| $50,000 to $74,999 | 1,152 (93.7%) | 78 (6.3%) |
| $75,000 to $99,999 | 928 (88.0%) | 126 (11.9%) |
| $100,000 and over | 1,911 (93.8%) | 127 (6.2%) |
Public vs Private Health Insurance Coverage by Age in Boone
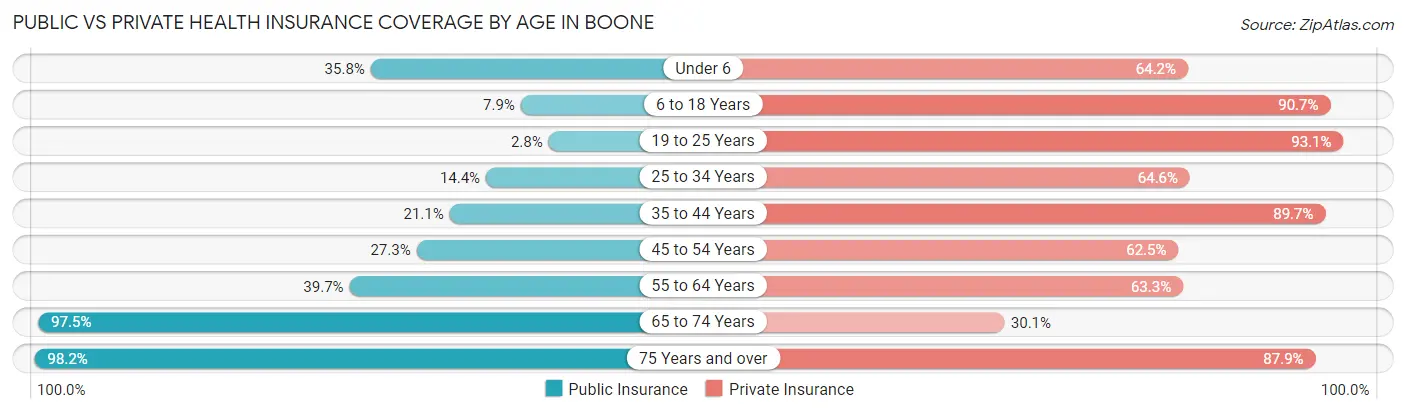
| Age Bracket | Public Insurance | Private Insurance |
| Under 6 | 93 (35.8%) | 167 (64.2%) |
| 6 to 18 Years | 236 (7.9%) | 2,702 (90.7%) |
| 19 to 25 Years | 307 (2.8%) | 10,383 (93.1%) |
| 25 to 34 Years | 181 (14.4%) | 814 (64.6%) |
| 35 to 44 Years | 247 (21.1%) | 1,049 (89.7%) |
| 45 to 54 Years | 175 (27.3%) | 401 (62.5%) |
| 55 to 64 Years | 380 (39.7%) | 606 (63.3%) |
| 65 to 74 Years | 389 (97.5%) | 120 (30.1%) |
| 75 Years and over | 430 (98.2%) | 385 (87.9%) |
| Total | 2,438 (12.7%) | 16,627 (86.3%) |
Disability Status by Sex by Age in Boone
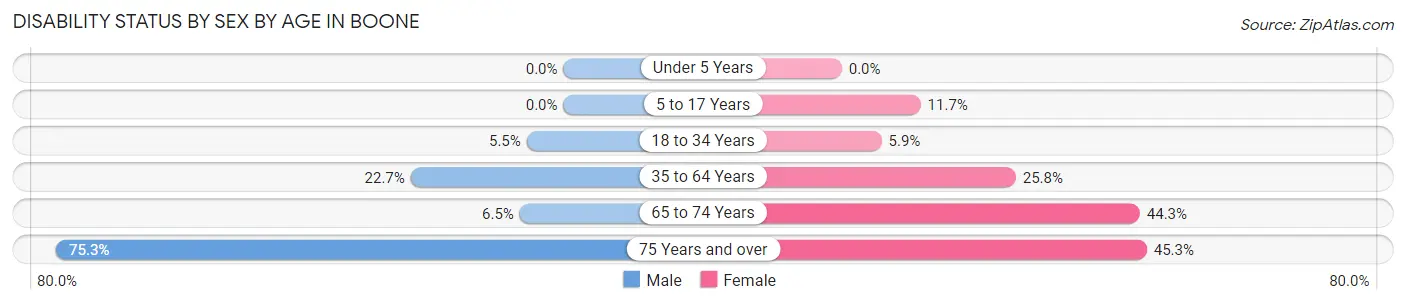
| Age Bracket | Male | Female |
| Under 5 Years | 0 (0.0%) | 0 (0.0%) |
| 5 to 17 Years | 0 (0.0%) | 35 (11.7%) |
| 18 to 34 Years | 363 (5.4%) | 476 (5.9%) |
| 35 to 64 Years | 310 (22.7%) | 362 (25.8%) |
| 65 to 74 Years | 14 (6.5%) | 81 (44.3%) |
| 75 Years and over | 122 (75.3%) | 125 (45.3%) |
Disability Class by Sex by Age in Boone
Disability Class: Hearing Difficulty
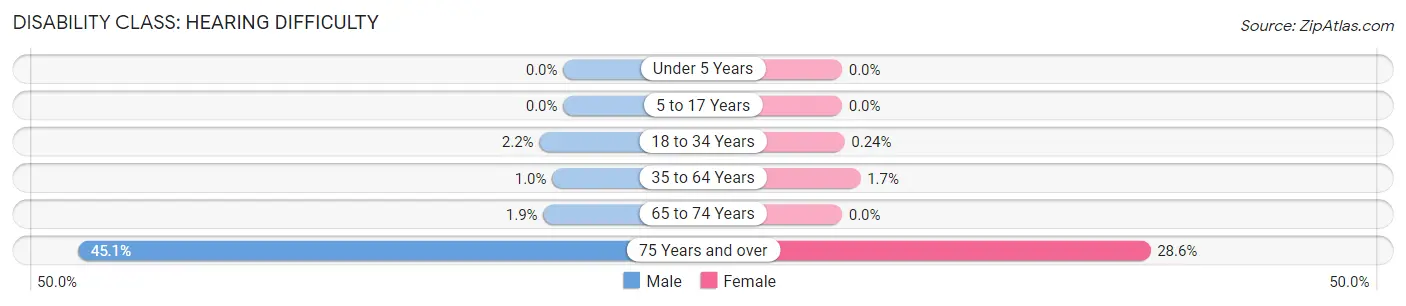
| Age Bracket | Male | Female |
| Under 5 Years | 0 (0.0%) | 0 (0.0%) |
| 5 to 17 Years | 0 (0.0%) | 0 (0.0%) |
| 18 to 34 Years | 148 (2.2%) | 19 (0.2%) |
| 35 to 64 Years | 14 (1.0%) | 24 (1.7%) |
| 65 to 74 Years | 4 (1.8%) | 0 (0.0%) |
| 75 Years and over | 73 (45.1%) | 79 (28.6%) |
Disability Class: Vision Difficulty
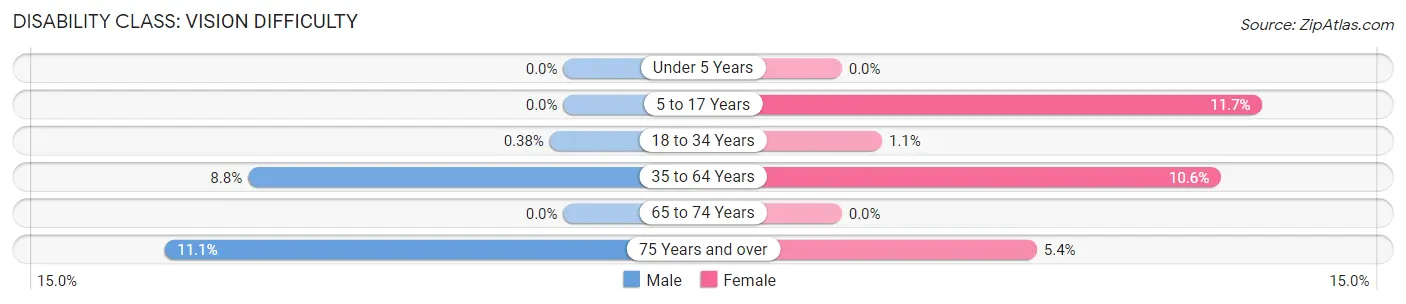
| Age Bracket | Male | Female |
| Under 5 Years | 0 (0.0%) | 0 (0.0%) |
| 5 to 17 Years | 0 (0.0%) | 35 (11.7%) |
| 18 to 34 Years | 25 (0.4%) | 90 (1.1%) |
| 35 to 64 Years | 120 (8.8%) | 148 (10.6%) |
| 65 to 74 Years | 0 (0.0%) | 0 (0.0%) |
| 75 Years and over | 18 (11.1%) | 15 (5.4%) |
Disability Class: Cognitive Difficulty
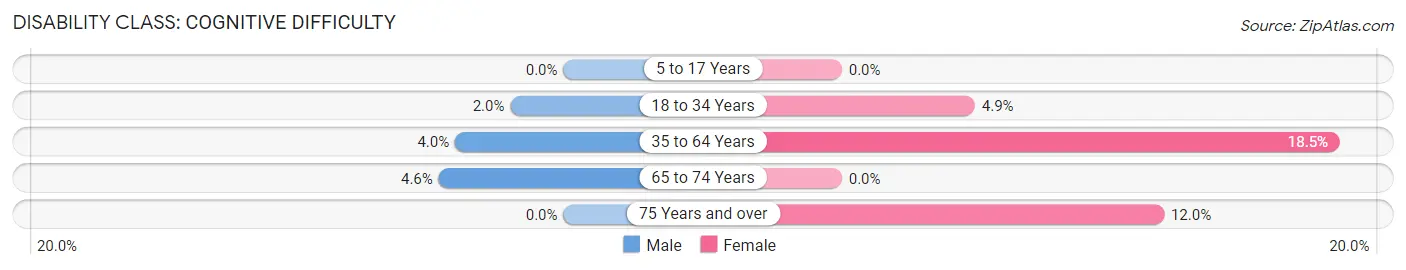
| Age Bracket | Male | Female |
| 5 to 17 Years | 0 (0.0%) | 0 (0.0%) |
| 18 to 34 Years | 131 (2.0%) | 398 (4.9%) |
| 35 to 64 Years | 55 (4.0%) | 259 (18.5%) |
| 65 to 74 Years | 10 (4.6%) | 0 (0.0%) |
| 75 Years and over | 0 (0.0%) | 33 (12.0%) |
Disability Class: Ambulatory Difficulty
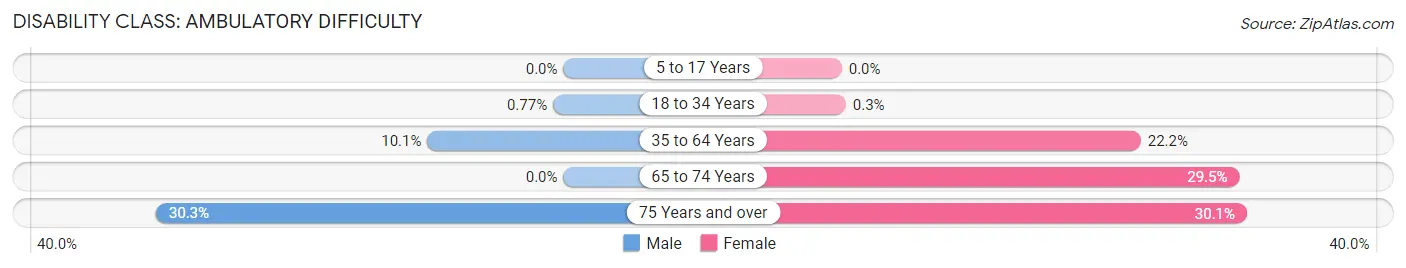
| Age Bracket | Male | Female |
| 5 to 17 Years | 0 (0.0%) | 0 (0.0%) |
| 18 to 34 Years | 51 (0.8%) | 24 (0.3%) |
| 35 to 64 Years | 138 (10.1%) | 311 (22.2%) |
| 65 to 74 Years | 0 (0.0%) | 54 (29.5%) |
| 75 Years and over | 49 (30.2%) | 83 (30.1%) |
Disability Class: Self-Care Difficulty
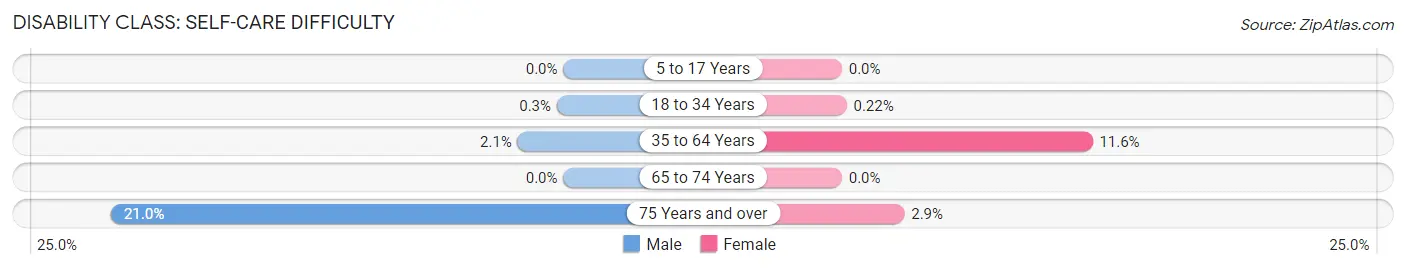
| Age Bracket | Male | Female |
| 5 to 17 Years | 0 (0.0%) | 0 (0.0%) |
| 18 to 34 Years | 20 (0.3%) | 18 (0.2%) |
| 35 to 64 Years | 29 (2.1%) | 163 (11.6%) |
| 65 to 74 Years | 0 (0.0%) | 0 (0.0%) |
| 75 Years and over | 34 (21.0%) | 8 (2.9%) |
Technology Access in Boone
Computing Device Access in Boone
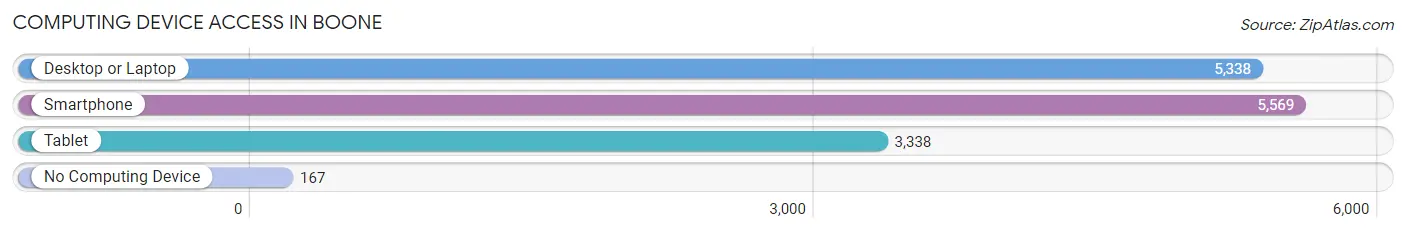
| Device Type | # Households | % Households |
| Desktop or Laptop | 5,338 | 91.4% |
| Smartphone | 5,569 | 95.4% |
| Tablet | 3,338 | 57.2% |
| No Computing Device | 167 | 2.9% |
| Total | 5,839 | 100.0% |
Internet Access in Boone
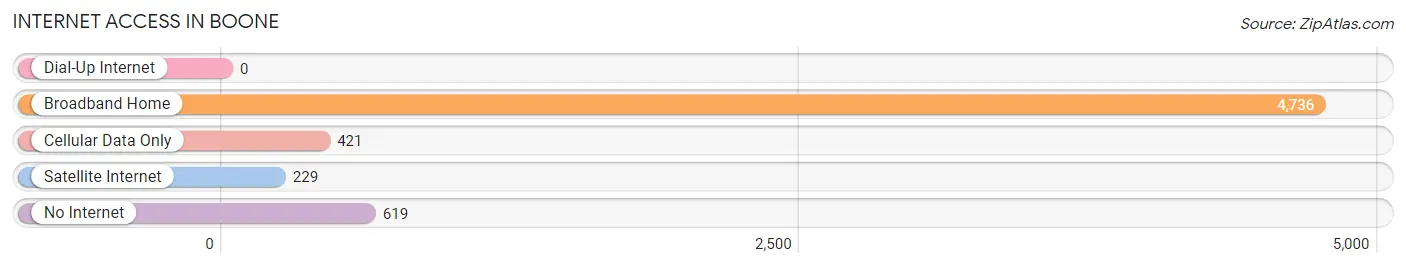
| Internet Type | # Households | % Households |
| Dial-Up Internet | 0 | 0.0% |
| Broadband Home | 4,736 | 81.1% |
| Cellular Data Only | 421 | 7.2% |
| Satellite Internet | 229 | 3.9% |
| No Internet | 619 | 10.6% |
| Total | 5,839 | 100.0% |
Boone Summary
Boone, North Carolina is a small town located in the Blue Ridge Mountains of western North Carolina. It is the county seat of Watauga County and is home to Appalachian State University. The town has a population of approximately 17,000 people and is known for its outdoor recreation opportunities, vibrant arts and culture scene, and friendly people.
Geography
Boone is located in the Blue Ridge Mountains of western North Carolina, approximately 80 miles northeast of Asheville. The town is situated at an elevation of 3,333 feet, making it one of the highest towns in the eastern United States. The town is surrounded by the Pisgah National Forest and is close to the Appalachian Trail. Boone is also close to several ski resorts, including Appalachian Ski Mountain and Sugar Mountain.
Economy
Boone’s economy is largely driven by tourism and education. The town is home to Appalachian State University, which has an enrollment of over 19,000 students. The university is a major employer in the area and provides a significant economic boost to the town. In addition, Boone is a popular tourist destination due to its proximity to the Blue Ridge Mountains and its outdoor recreation opportunities. The town is also home to several restaurants, shops, and other businesses that cater to visitors and locals alike.
Demographics
As of the 2010 census, Boone had a population of 17,122 people. The racial makeup of the town was 90.2% White, 4.2% African American, 0.3% Native American, 2.2% Asian, 0.1% Pacific Islander, 1.3% from other races, and 1.7% from two or more races. The median household income was $35,945 and the median family income was $50,945.
History
Boone was founded in 1872 and was named after the famous explorer Daniel Boone. The town was originally a small farming community, but it began to grow in the early 20th century when the railroad arrived. The town was also home to several mills and factories, which provided employment for many of the town’s residents. In the 1950s, the town began to experience a period of growth due to the opening of Appalachian State University. The university has since become a major employer in the area and has helped to shape the town’s economy and culture.
Conclusion
Boone, North Carolina is a small town located in the Blue Ridge Mountains of western North Carolina. It is the county seat of Watauga County and is home to Appalachian State University. The town has a population of approximately 17,000 people and is known for its outdoor recreation opportunities, vibrant arts and culture scene, and friendly people. The town’s economy is largely driven by tourism and education, and it is a popular tourist destination due to its proximity to the Blue Ridge Mountains and its outdoor recreation opportunities. Boone was founded in 1872 and was named after the famous explorer Daniel Boone. The town has experienced a period of growth since the 1950s due to the opening of Appalachian State University.
Common Questions
What is Per Capita Income in Boone?
Per Capita income in Boone is $15,722.
What is the Median Family Income in Boone?
Median Family Income in Boone is $77,901.
What is the Median Household income in Boone?
Median Household Income in Boone is $28,242.
What is Income or Wage Gap in Boone?
Income or Wage Gap in Boone is 27.2%.
Women in Boone earn 72.8 cents for every dollar earned by a man.
What is Inequality or Gini Index in Boone?
Inequality or Gini Index in Boone is 0.57.
What is the Total Population of Boone?
Total Population of Boone is 19,368.
What is the Total Male Population of Boone?
Total Male Population of Boone is 8,874.
What is the Total Female Population of Boone?
Total Female Population of Boone is 10,494.
What is the Ratio of Males per 100 Females in Boone?
There are 84.56 Males per 100 Females in Boone.
What is the Ratio of Females per 100 Males in Boone?
There are 118.26 Females per 100 Males in Boone.
What is the Median Population Age in Boone?
Median Population Age in Boone is 21.4 Years.
What is the Average Family Size in Boone
Average Family Size in Boone is 2.8 People.
What is the Average Household Size in Boone
Average Household Size in Boone is 2.4 People.
How Large is the Labor Force in Boone?
There are 9,943 People in the Labor Forcein in Boone.
What is the Percentage of People in the Labor Force in Boone?
53.6% of People are in the Labor Force in Boone.
What is the Unemployment Rate in Boone?
Unemployment Rate in Boone is 16.6%.