Whitakers, NC Map & Demographics
Whitakers Map
Whitakers Overview
$23,240
PER CAPITA INCOME
$46,181
AVG FAMILY INCOME
$34,375
AVG HOUSEHOLD INCOME
36.2%
WAGE / INCOME GAP [ % ]
63.8¢/ $1
WAGE / INCOME GAP [ $ ]
0.43
INEQUALITY / GINI INDEX
462
TOTAL POPULATION
213
MALE POPULATION
249
FEMALE POPULATION
85.54
MALES / 100 FEMALES
116.90
FEMALES / 100 MALES
32.8
MEDIAN AGE
2.8
AVG FAMILY SIZE
2.0
AVG HOUSEHOLD SIZE
224
LABOR FORCE [ PEOPLE ]
62.9%
PERCENT IN LABOR FORCE
6.7%
UNEMPLOYMENT RATE
Whitakers Zip Codes
Whitakers Area Codes
Income in Whitakers
Income Overview in Whitakers
Per Capita Income in Whitakers is $23,240, while median incomes of families and households are $46,181 and $34,375 respectively.
| Characteristic | Number | Measure |
| Per Capita Income | 462 | $23,240 |
| Median Family Income | 123 | $46,181 |
| Mean Family Income | 123 | $57,224 |
| Median Household Income | 234 | $34,375 |
| Mean Household Income | 234 | $45,700 |
| Income Deficit | 123 | $0 |
| Wage / Income Gap (%) | 462 | 36.15% |
| Wage / Income Gap ($) | 462 | 63.85¢ per $1 |
| Gini / Inequality Index | 462 | 0.43 |
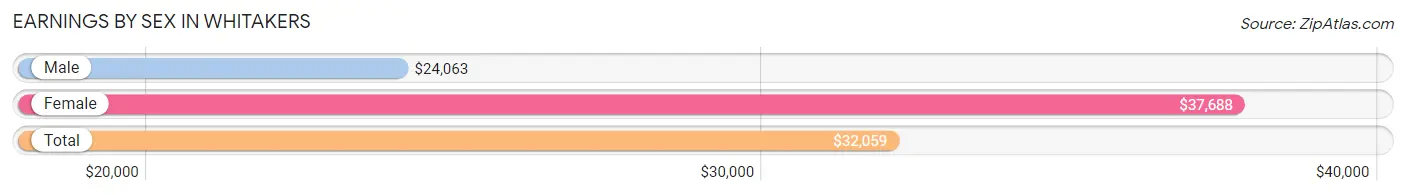
Earnings by Sex in Whitakers
Average Earnings in Whitakers are $32,059, $24,063 for men and $37,688 for women, a difference of 36.1%.
| Sex | Number | Average Earnings |
| Male | 115 (50.4%) | $24,063 |
| Female | 113 (49.6%) | $37,688 |
| Total | 228 (100.0%) | $32,059 |
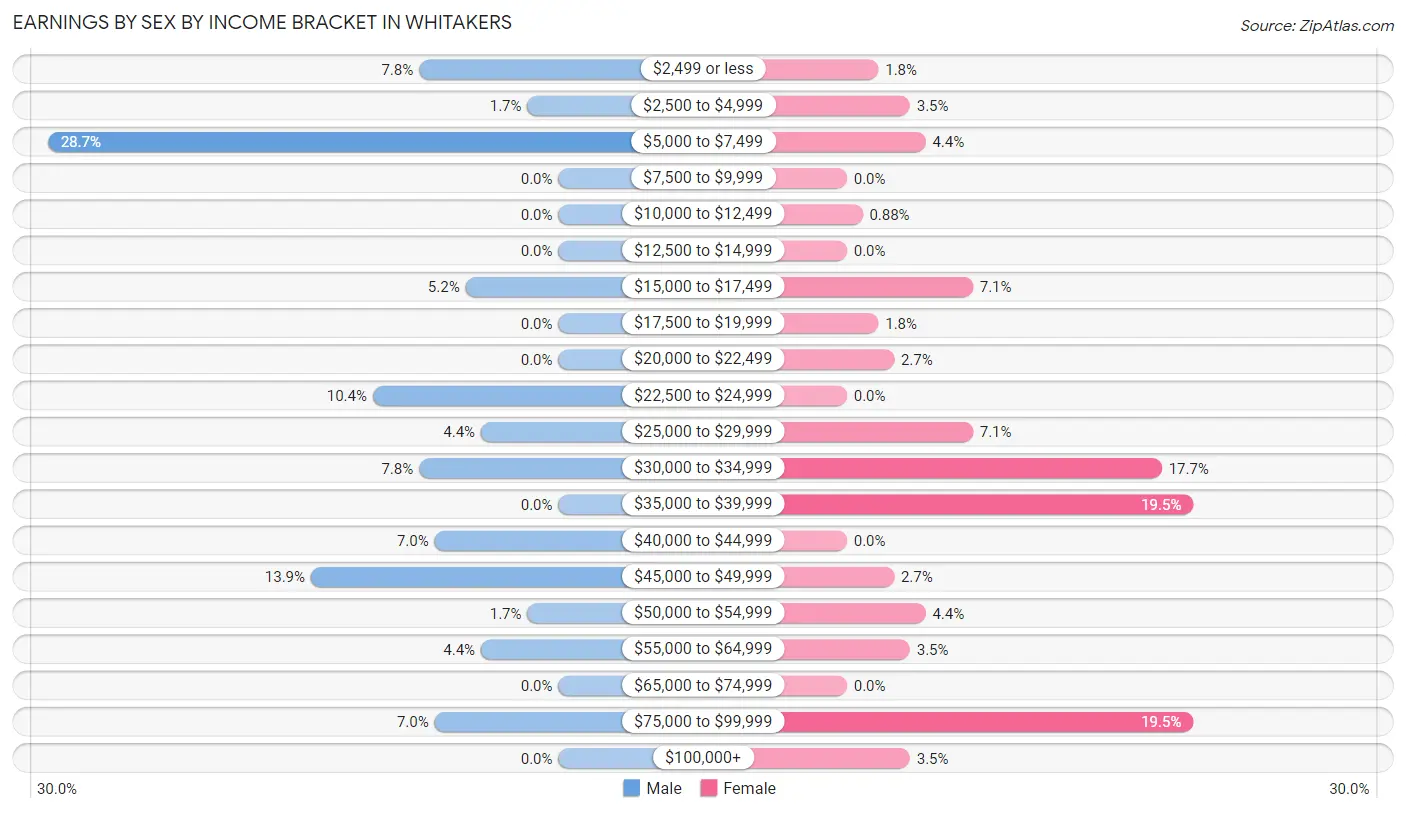
Earnings by Sex by Income Bracket in Whitakers
The most common earnings brackets in Whitakers are $5,000 to $7,499 for men (33 | 28.7%) and $35,000 to $39,999 for women (22 | 19.5%).
| Income | Male | Female |
| $2,499 or less | 9 (7.8%) | 2 (1.8%) |
| $2,500 to $4,999 | 2 (1.7%) | 4 (3.5%) |
| $5,000 to $7,499 | 33 (28.7%) | 5 (4.4%) |
| $7,500 to $9,999 | 0 (0.0%) | 0 (0.0%) |
| $10,000 to $12,499 | 0 (0.0%) | 1 (0.9%) |
| $12,500 to $14,999 | 0 (0.0%) | 0 (0.0%) |
| $15,000 to $17,499 | 6 (5.2%) | 8 (7.1%) |
| $17,500 to $19,999 | 0 (0.0%) | 2 (1.8%) |
| $20,000 to $22,499 | 0 (0.0%) | 3 (2.6%) |
| $22,500 to $24,999 | 12 (10.4%) | 0 (0.0%) |
| $25,000 to $29,999 | 5 (4.3%) | 8 (7.1%) |
| $30,000 to $34,999 | 9 (7.8%) | 20 (17.7%) |
| $35,000 to $39,999 | 0 (0.0%) | 22 (19.5%) |
| $40,000 to $44,999 | 8 (7.0%) | 0 (0.0%) |
| $45,000 to $49,999 | 16 (13.9%) | 3 (2.6%) |
| $50,000 to $54,999 | 2 (1.7%) | 5 (4.4%) |
| $55,000 to $64,999 | 5 (4.3%) | 4 (3.5%) |
| $65,000 to $74,999 | 0 (0.0%) | 0 (0.0%) |
| $75,000 to $99,999 | 8 (7.0%) | 22 (19.5%) |
| $100,000+ | 0 (0.0%) | 4 (3.5%) |
| Total | 115 (100.0%) | 113 (100.0%) |
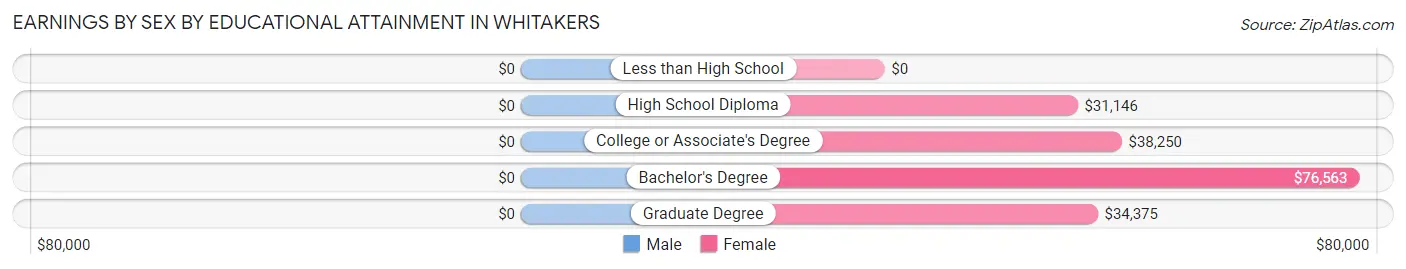
Earnings by Sex by Educational Attainment in Whitakers
| Educational Attainment | Male Income | Female Income |
| Less than High School | - | - |
| High School Diploma | - | - |
| College or Associate's Degree | - | - |
| Bachelor's Degree | - | - |
| Graduate Degree | - | - |
| Total | $24,688 | $38,250 |
Family Income in Whitakers
Family Income Brackets in Whitakers
According to the Whitakers family income data, there are 28 families falling into the $35,000 to $49,999 income range, which is the most common income bracket and makes up 22.8% of all families.
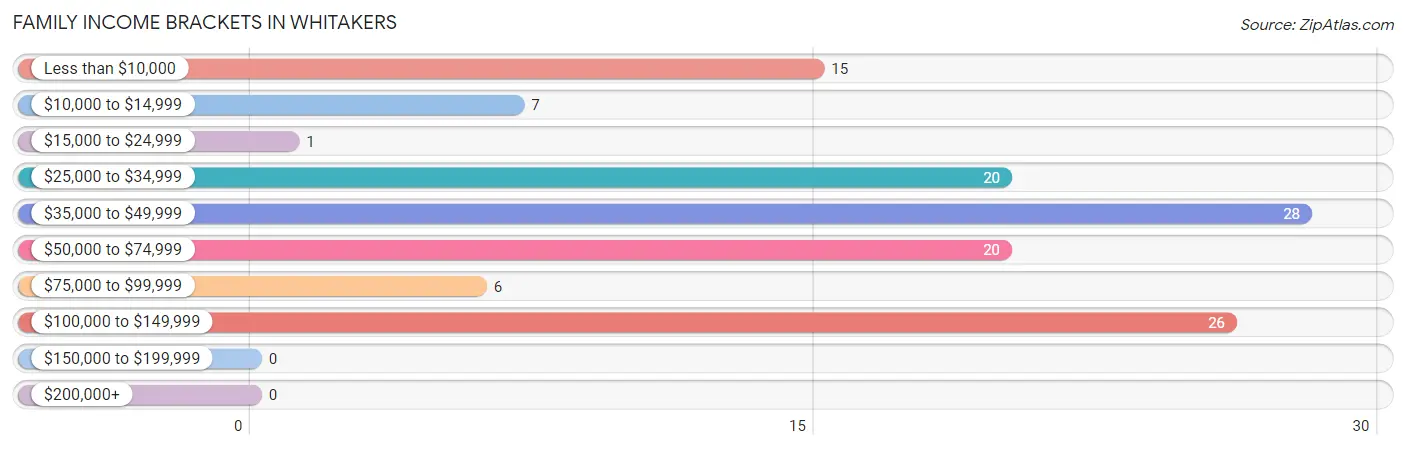
| Income Bracket | # Families | % Families |
| Less than $10,000 | 15 | 12.2% |
| $10,000 to $14,999 | 7 | 5.7% |
| $15,000 to $24,999 | 1 | 0.8% |
| $25,000 to $34,999 | 20 | 16.3% |
| $35,000 to $49,999 | 28 | 22.8% |
| $50,000 to $74,999 | 20 | 16.3% |
| $75,000 to $99,999 | 6 | 4.9% |
| $100,000 to $149,999 | 26 | 21.1% |
| $150,000 to $199,999 | 0 | 0.0% |
| $200,000+ | 0 | 0.0% |
Family Income by Famaliy Size in Whitakers
2-person families (62 | 50.4%) account for the highest median family income in Whitakers with $46,528 per family, while 2-person families (62 | 50.4%) have the highest median income of $23,264 per family member.
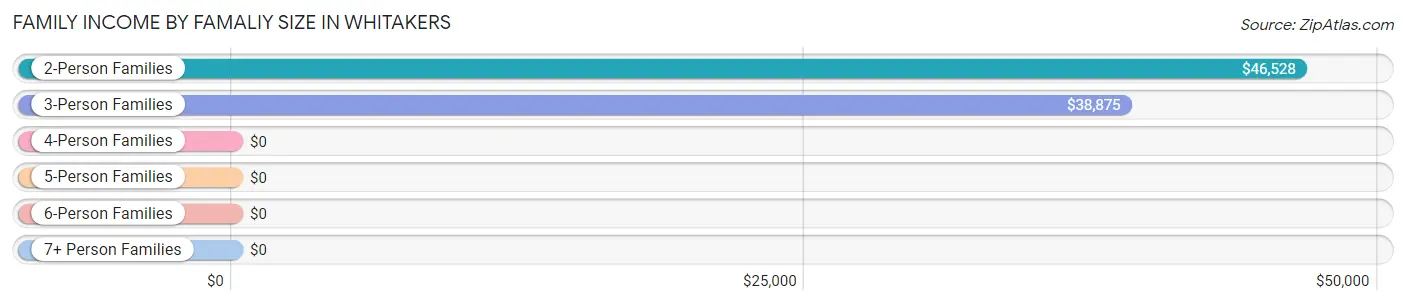
| Income Bracket | # Families | Median Income |
| 2-Person Families | 62 (50.4%) | $46,528 |
| 3-Person Families | 21 (17.1%) | $38,875 |
| 4-Person Families | 21 (17.1%) | $0 |
| 5-Person Families | 17 (13.8%) | $0 |
| 6-Person Families | 0 (0.0%) | $0 |
| 7+ Person Families | 2 (1.6%) | $0 |
| Total | 123 (100.0%) | $46,181 |
Family Income by Number of Earners in Whitakers
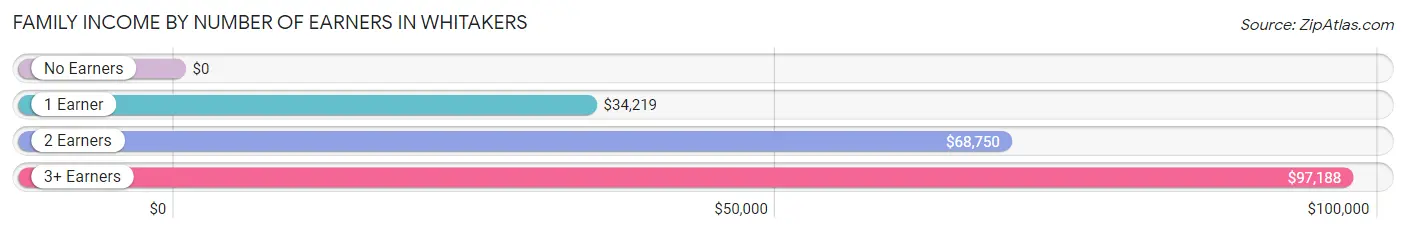
| Number of Earners | # Families | Median Income |
| No Earners | 21 (17.1%) | $0 |
| 1 Earner | 55 (44.7%) | $34,219 |
| 2 Earners | 36 (29.3%) | $68,750 |
| 3+ Earners | 11 (8.9%) | $97,188 |
| Total | 123 (100.0%) | $46,181 |
Household Income in Whitakers
Household Income Brackets in Whitakers
With 42 households falling in the category, the $25,000 to $34,999 income range is the most frequent in Whitakers, accounting for 17.9% of all households.
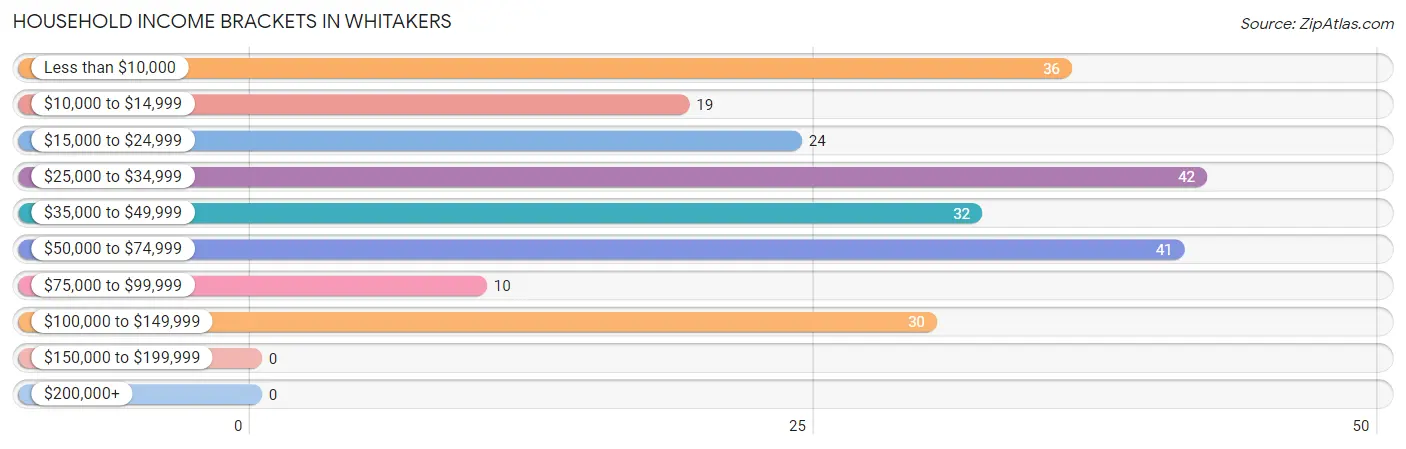
| Income Bracket | # Households | % Households |
| Less than $10,000 | 36 | 15.4% |
| $10,000 to $14,999 | 19 | 8.1% |
| $15,000 to $24,999 | 24 | 10.3% |
| $25,000 to $34,999 | 42 | 17.9% |
| $35,000 to $49,999 | 32 | 13.7% |
| $50,000 to $74,999 | 41 | 17.5% |
| $75,000 to $99,999 | 10 | 4.3% |
| $100,000 to $149,999 | 30 | 12.8% |
| $150,000 to $199,999 | 0 | 0.0% |
| $200,000+ | 0 | 0.0% |
Household Income by Householder Age in Whitakers
The median household income in Whitakers is $34,375, with the highest median household income of $45,764 found in the 45 to 64 years age bracket for the primary householder. A total of 91 households (38.9%) fall into this category. Meanwhile, the 15 to 24 years age bracket for the primary householder has the lowest median household income of $0, with 3 households (1.3%) in this group.
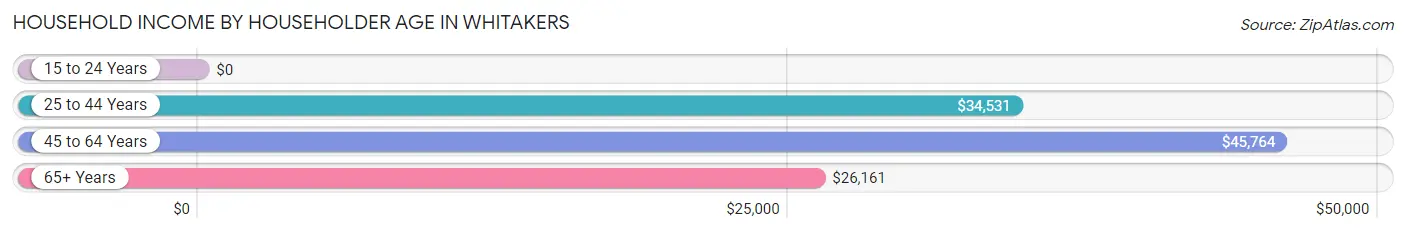
| Income Bracket | # Households | Median Income |
| 15 to 24 Years | 3 (1.3%) | $0 |
| 25 to 44 Years | 89 (38.0%) | $34,531 |
| 45 to 64 Years | 91 (38.9%) | $45,764 |
| 65+ Years | 51 (21.8%) | $26,161 |
| Total | 234 (100.0%) | $34,375 |
Poverty in Whitakers
Income Below Poverty by Sex and Age in Whitakers
With 17.8% poverty level for males and 26.5% for females among the residents of Whitakers, 5 year old males and 6 to 11 year old females are the most vulnerable to poverty, with 6 males (66.7%) and 7 females (70.0%) in their respective age groups living below the poverty level.
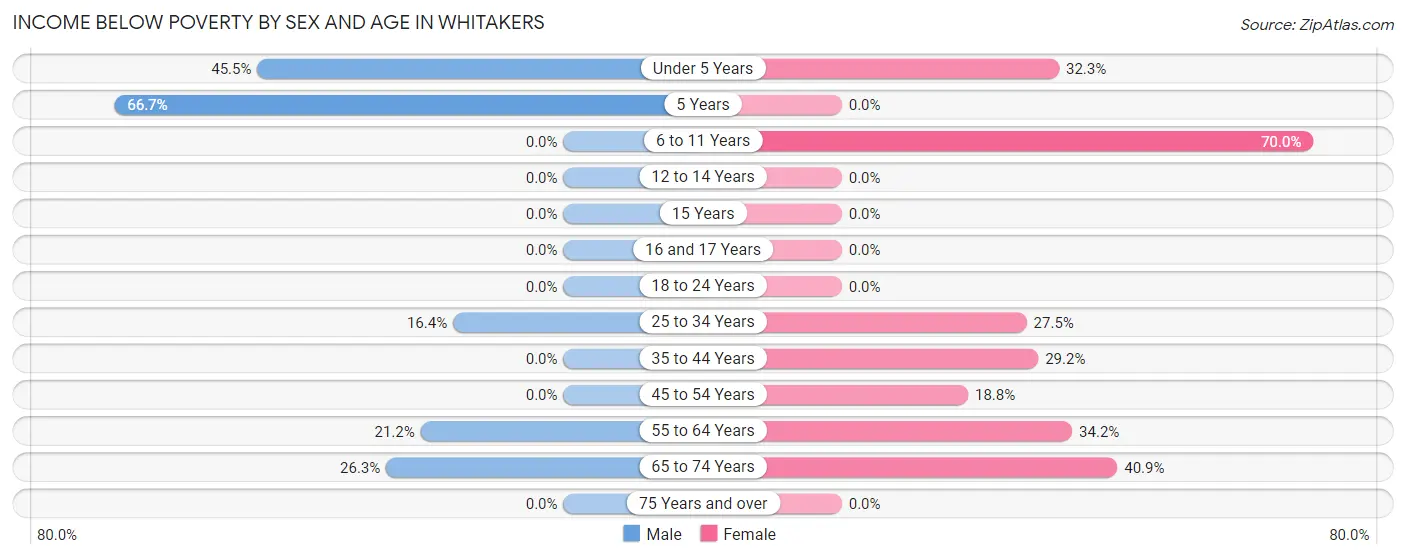
| Age Bracket | Male | Female |
| Under 5 Years | 10 (45.5%) | 10 (32.3%) |
| 5 Years | 6 (66.7%) | 0 (0.0%) |
| 6 to 11 Years | 0 (0.0%) | 7 (70.0%) |
| 12 to 14 Years | 0 (0.0%) | 0 (0.0%) |
| 15 Years | 0 (0.0%) | 0 (0.0%) |
| 16 and 17 Years | 0 (0.0%) | 0 (0.0%) |
| 18 to 24 Years | 0 (0.0%) | 0 (0.0%) |
| 25 to 34 Years | 10 (16.4%) | 14 (27.5%) |
| 35 to 44 Years | 0 (0.0%) | 7 (29.2%) |
| 45 to 54 Years | 0 (0.0%) | 6 (18.8%) |
| 55 to 64 Years | 7 (21.2%) | 13 (34.2%) |
| 65 to 74 Years | 5 (26.3%) | 9 (40.9%) |
| 75 Years and over | 0 (0.0%) | 0 (0.0%) |
| Total | 38 (17.8%) | 66 (26.5%) |
Income Above Poverty by Sex and Age in Whitakers
According to the poverty statistics in Whitakers, males aged 6 to 11 years and females aged 12 to 14 years are the age groups that are most secure financially, with 100.0% of males and 100.0% of females in these age groups living above the poverty line.
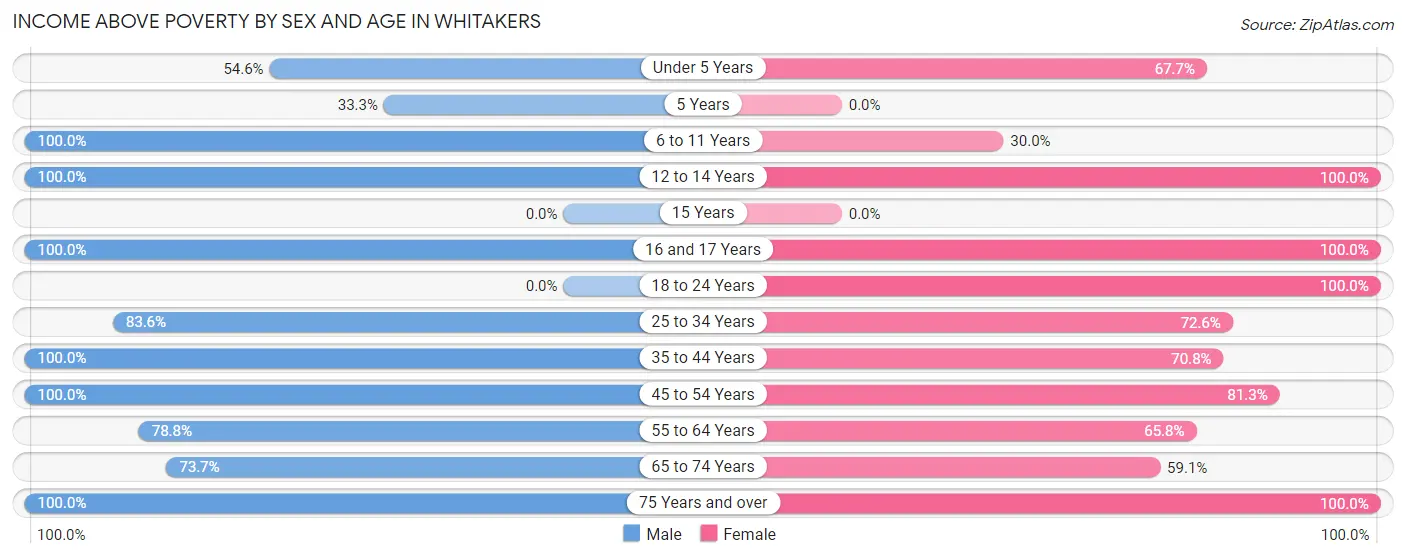
| Age Bracket | Male | Female |
| Under 5 Years | 12 (54.5%) | 21 (67.7%) |
| 5 Years | 3 (33.3%) | 0 (0.0%) |
| 6 to 11 Years | 10 (100.0%) | 3 (30.0%) |
| 12 to 14 Years | 7 (100.0%) | 17 (100.0%) |
| 15 Years | 0 (0.0%) | 0 (0.0%) |
| 16 and 17 Years | 19 (100.0%) | 4 (100.0%) |
| 18 to 24 Years | 0 (0.0%) | 9 (100.0%) |
| 25 to 34 Years | 51 (83.6%) | 37 (72.6%) |
| 35 to 44 Years | 12 (100.0%) | 17 (70.8%) |
| 45 to 54 Years | 18 (100.0%) | 26 (81.2%) |
| 55 to 64 Years | 26 (78.8%) | 25 (65.8%) |
| 65 to 74 Years | 14 (73.7%) | 13 (59.1%) |
| 75 Years and over | 3 (100.0%) | 11 (100.0%) |
| Total | 175 (82.2%) | 183 (73.5%) |
Income Below Poverty Among Married-Couple Families in Whitakers
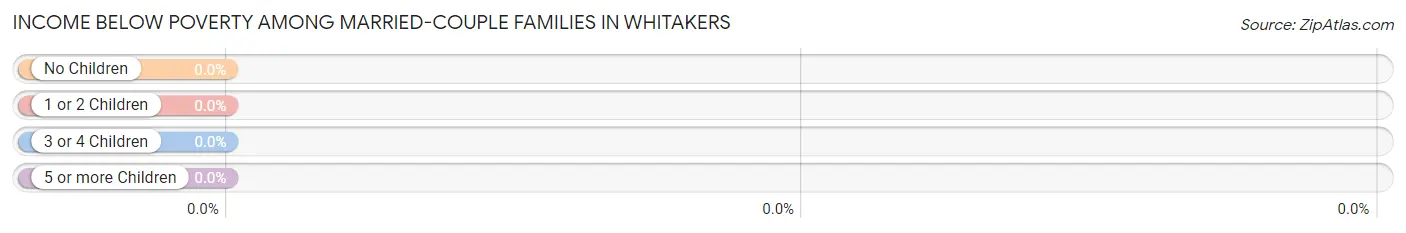
| Children | Above Poverty | Below Poverty |
| No Children | 32 (100.0%) | 0 (0.0%) |
| 1 or 2 Children | 2 (100.0%) | 0 (0.0%) |
| 3 or 4 Children | 17 (100.0%) | 0 (0.0%) |
| 5 or more Children | 0 (0.0%) | 0 (0.0%) |
| Total | 51 (100.0%) | 0 (0.0%) |
Income Below Poverty Among Single-Parent Households in Whitakers
According to the poverty data in Whitakers, 76.9% or 10 single-father households and 20.3% or 12 single-mother households are living below the poverty line. Among single-father households, those with 3 or 4 children have the highest poverty rate, with 10 households (100.0%) experiencing poverty. Likewise, among single-mother households, those with no children have the highest poverty rate, with 7 households (41.2%) falling below the poverty line.
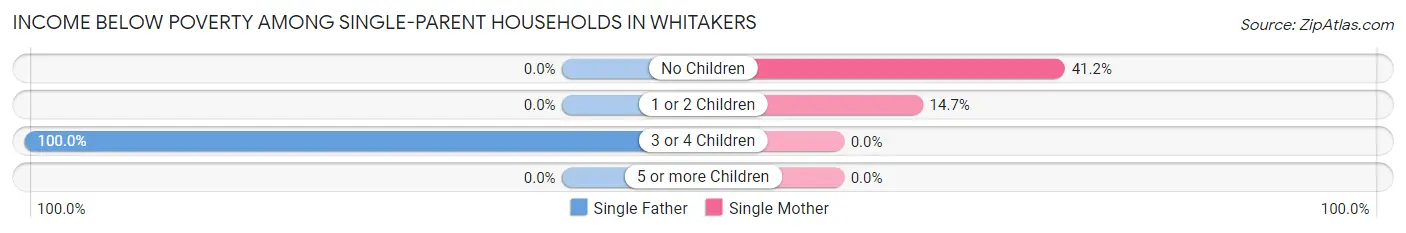
| Children | Single Father | Single Mother |
| No Children | 0 (0.0%) | 7 (41.2%) |
| 1 or 2 Children | 0 (0.0%) | 5 (14.7%) |
| 3 or 4 Children | 10 (100.0%) | 0 (0.0%) |
| 5 or more Children | 0 (0.0%) | 0 (0.0%) |
| Total | 10 (76.9%) | 12 (20.3%) |
Income Below Poverty Among Married-Couple vs Single-Parent Households in Whitakers
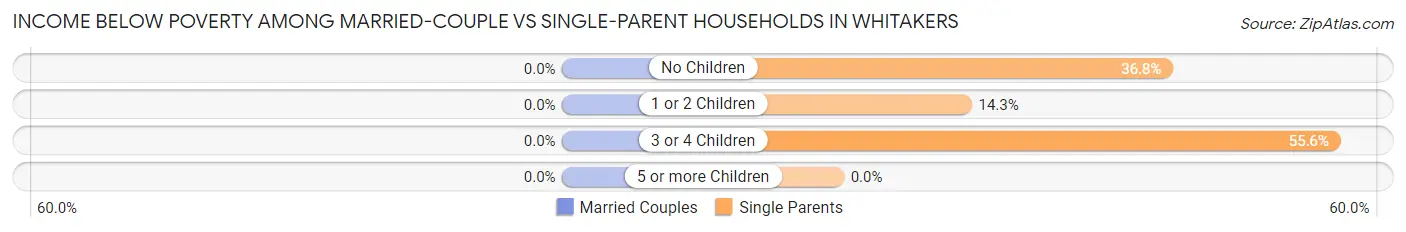
| Children | Married-Couple Families | Single-Parent Households |
| No Children | 0 (0.0%) | 7 (36.8%) |
| 1 or 2 Children | 0 (0.0%) | 5 (14.3%) |
| 3 or 4 Children | 0 (0.0%) | 10 (55.6%) |
| 5 or more Children | 0 (0.0%) | 0 (0.0%) |
| Total | 0 (0.0%) | 22 (30.6%) |
Race in Whitakers
The most populous races in Whitakers are Black / African American (393 | 85.1%), White / Caucasian (54 | 11.7%), and Two or more Races (15 | 3.3%).
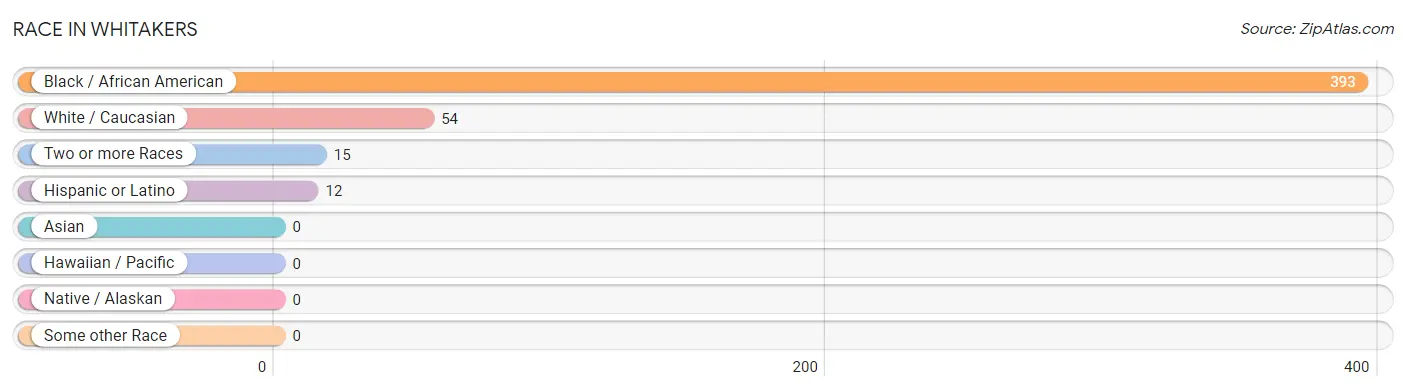
| Race | # Population | % Population |
| Asian | 0 | 0.0% |
| Black / African American | 393 | 85.1% |
| Hawaiian / Pacific | 0 | 0.0% |
| Hispanic or Latino | 12 | 2.6% |
| Native / Alaskan | 0 | 0.0% |
| White / Caucasian | 54 | 11.7% |
| Two or more Races | 15 | 3.3% |
| Some other Race | 0 | 0.0% |
| Total | 462 | 100.0% |
Ancestry in Whitakers
The most populous ancestries reported in Whitakers are Central American (12 | 2.6%), Panamanian (12 | 2.6%), American (11 | 2.4%), German (8 | 1.7%), and Scotch-Irish (7 | 1.5%), together accounting for 10.8% of all Whitakers residents.
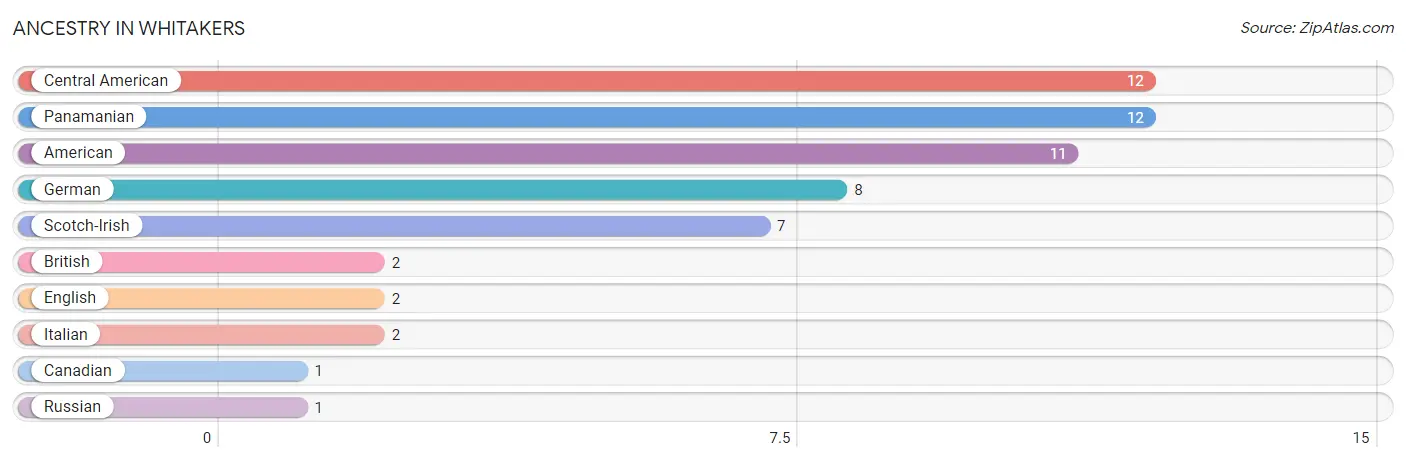
| Ancestry | # Population | % Population |
| American | 11 | 2.4% |
| British | 2 | 0.4% |
| Canadian | 1 | 0.2% |
| Central American | 12 | 2.6% |
| English | 2 | 0.4% |
| German | 8 | 1.7% |
| Italian | 2 | 0.4% |
| Panamanian | 12 | 2.6% |
| Russian | 1 | 0.2% |
| Scotch-Irish | 7 | 1.5% | View All 10 Rows |
Immigrants in Whitakers
The most numerous immigrant groups reported in Whitakers came from Central America (3 | 0.6%), Latin America (3 | 0.6%), Panama (3 | 0.6%), Canada (1 | 0.2%), and Eastern Europe (1 | 0.2%), together accounting for 2.4% of all Whitakers residents.
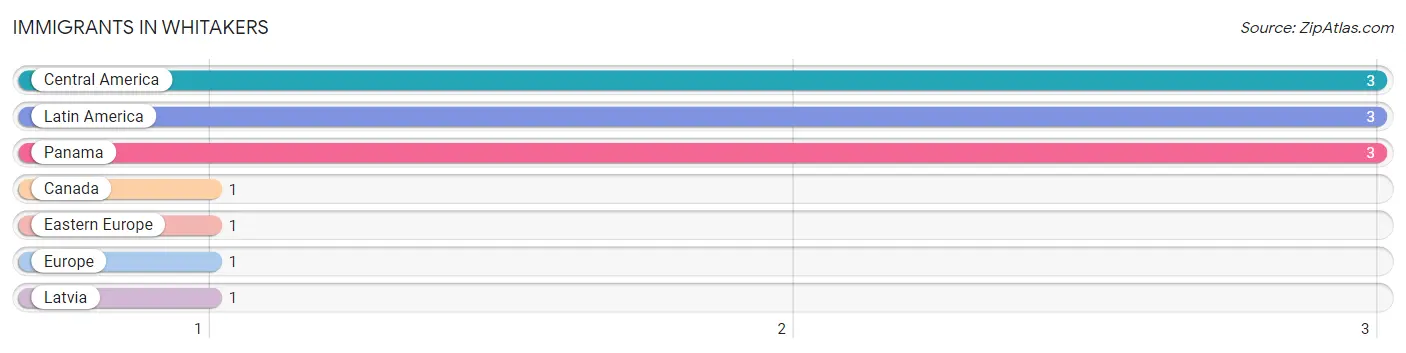
| Immigration Origin | # Population | % Population |
| Canada | 1 | 0.2% |
| Central America | 3 | 0.6% |
| Eastern Europe | 1 | 0.2% |
| Europe | 1 | 0.2% |
| Latin America | 3 | 0.6% |
| Latvia | 1 | 0.2% |
| Panama | 3 | 0.6% | View All 7 Rows |
Sex and Age in Whitakers
Sex and Age in Whitakers
The most populous age groups in Whitakers are 25 to 29 Years (37 | 17.4%) for men and 30 to 34 Years (39 | 15.7%) for women.
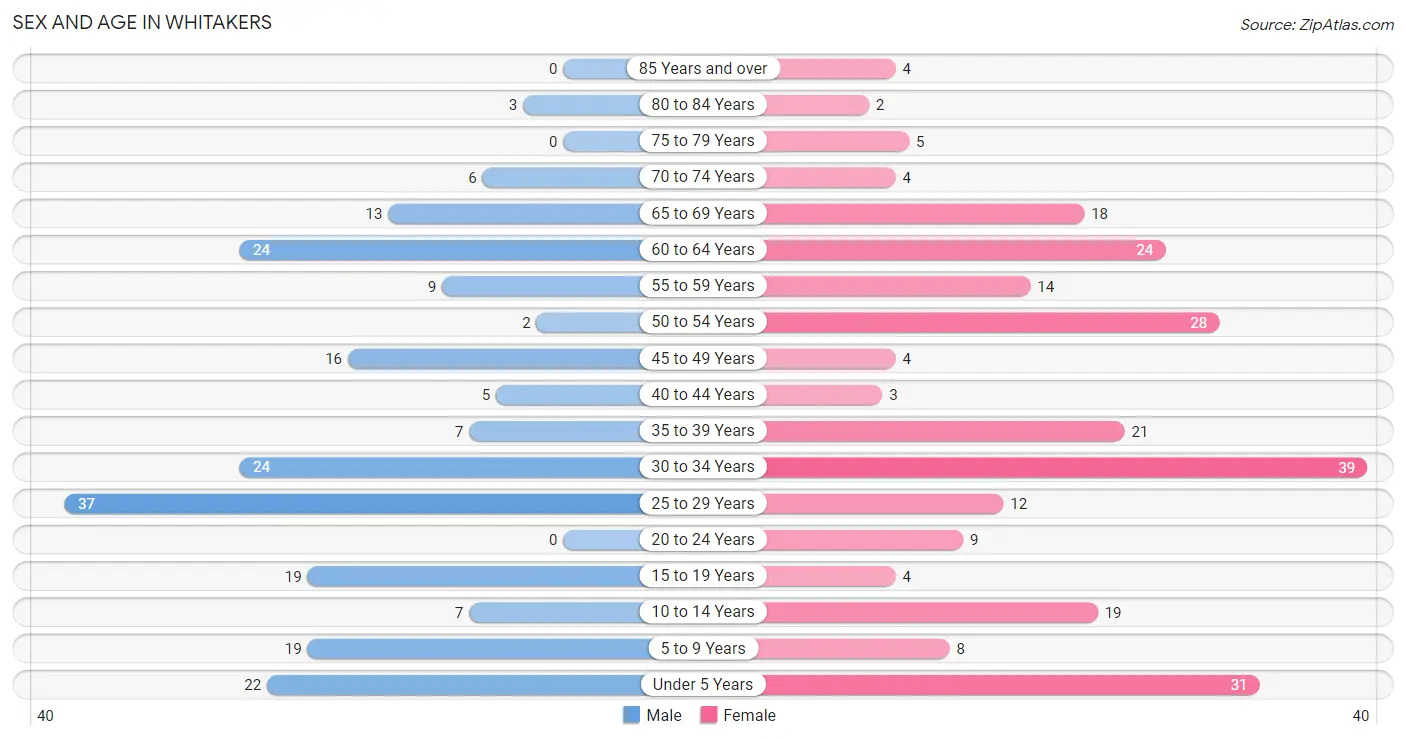
| Age Bracket | Male | Female |
| Under 5 Years | 22 (10.3%) | 31 (12.4%) |
| 5 to 9 Years | 19 (8.9%) | 8 (3.2%) |
| 10 to 14 Years | 7 (3.3%) | 19 (7.6%) |
| 15 to 19 Years | 19 (8.9%) | 4 (1.6%) |
| 20 to 24 Years | 0 (0.0%) | 9 (3.6%) |
| 25 to 29 Years | 37 (17.4%) | 12 (4.8%) |
| 30 to 34 Years | 24 (11.3%) | 39 (15.7%) |
| 35 to 39 Years | 7 (3.3%) | 21 (8.4%) |
| 40 to 44 Years | 5 (2.4%) | 3 (1.2%) |
| 45 to 49 Years | 16 (7.5%) | 4 (1.6%) |
| 50 to 54 Years | 2 (0.9%) | 28 (11.2%) |
| 55 to 59 Years | 9 (4.2%) | 14 (5.6%) |
| 60 to 64 Years | 24 (11.3%) | 24 (9.6%) |
| 65 to 69 Years | 13 (6.1%) | 18 (7.2%) |
| 70 to 74 Years | 6 (2.8%) | 4 (1.6%) |
| 75 to 79 Years | 0 (0.0%) | 5 (2.0%) |
| 80 to 84 Years | 3 (1.4%) | 2 (0.8%) |
| 85 Years and over | 0 (0.0%) | 4 (1.6%) |
| Total | 213 (100.0%) | 249 (100.0%) |
Families and Households in Whitakers
Median Family Size in Whitakers
The median family size in Whitakers is 2.76 persons per family, with single male/father families (13 | 10.6%) accounting for the largest median family size of 3.08 persons per family. On the other hand, single female/mother families (59 | 48.0%) represent the smallest median family size with 2.66 persons per family.
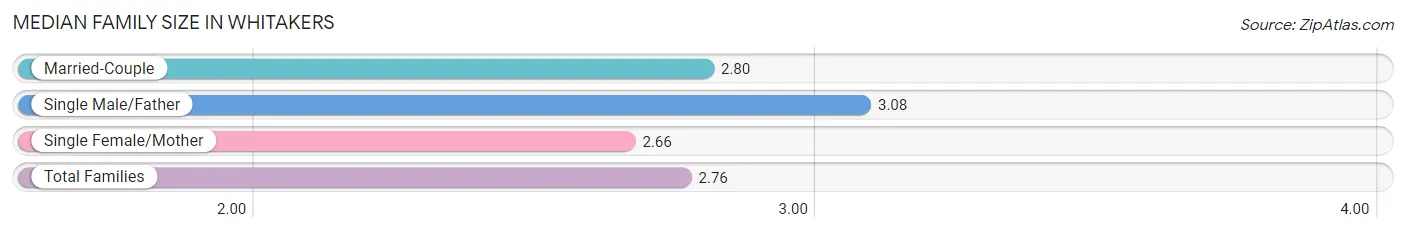
| Family Type | # Families | Family Size |
| Married-Couple | 51 (41.5%) | 2.80 |
| Single Male/Father | 13 (10.6%) | 3.08 |
| Single Female/Mother | 59 (48.0%) | 2.66 |
| Total Families | 123 (100.0%) | 2.76 |
Median Household Size in Whitakers
The median household size in Whitakers is 1.97 persons per household, with single male/father households (13 | 5.6%) accounting for the largest median household size of 3.77 persons per household. non-family households (111 | 47.4%) represent the smallest median household size with 1.02 persons per household.
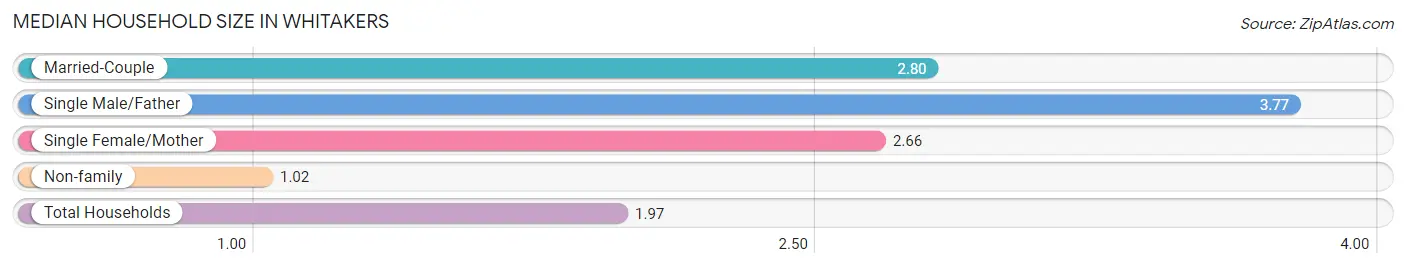
| Household Type | # Households | Household Size |
| Married-Couple | 51 (21.8%) | 2.80 |
| Single Male/Father | 13 (5.6%) | 3.77 |
| Single Female/Mother | 59 (25.2%) | 2.66 |
| Non-family | 111 (47.4%) | 1.02 |
| Total Households | 234 (100.0%) | 1.97 |
Household Size by Marriage Status in Whitakers
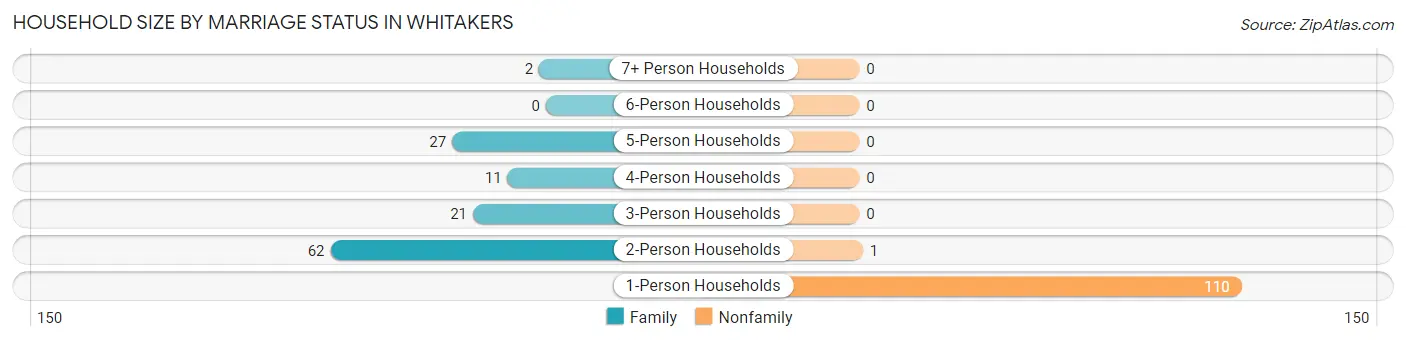
Out of a total of 234 households in Whitakers, 123 (52.6%) are family households, while 111 (47.4%) are nonfamily households. The most numerous type of family households are 2-person households, comprising 62, and the most common type of nonfamily households are 1-person households, comprising 110.
| Household Size | Family Households | Nonfamily Households |
| 1-Person Households | - | 110 (47.0%) |
| 2-Person Households | 62 (26.5%) | 1 (0.4%) |
| 3-Person Households | 21 (9.0%) | 0 (0.0%) |
| 4-Person Households | 11 (4.7%) | 0 (0.0%) |
| 5-Person Households | 27 (11.5%) | 0 (0.0%) |
| 6-Person Households | 0 (0.0%) | 0 (0.0%) |
| 7+ Person Households | 2 (0.9%) | 0 (0.0%) |
| Total | 123 (52.6%) | 111 (47.4%) |
Female Fertility in Whitakers
Fertility by Age in Whitakers
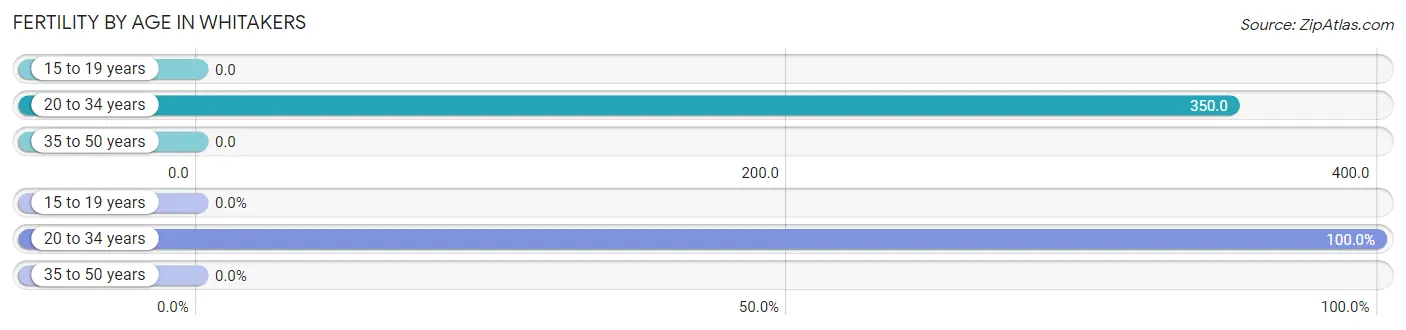
Average fertility rate in Whitakers is 228.0 births per 1,000 women. Women in the age bracket of 20 to 34 years have the highest fertility rate with 350.0 births per 1,000 women. Women in the age bracket of 20 to 34 years acount for 100.0% of all women with births.
| Age Bracket | Women with Births | Births / 1,000 Women |
| 15 to 19 years | 0 (0.0%) | 0.0 |
| 20 to 34 years | 21 (100.0%) | 350.0 |
| 35 to 50 years | 0 (0.0%) | 0.0 |
| Total | 21 (100.0%) | 228.0 |
Fertility by Age by Marriage Status in Whitakers
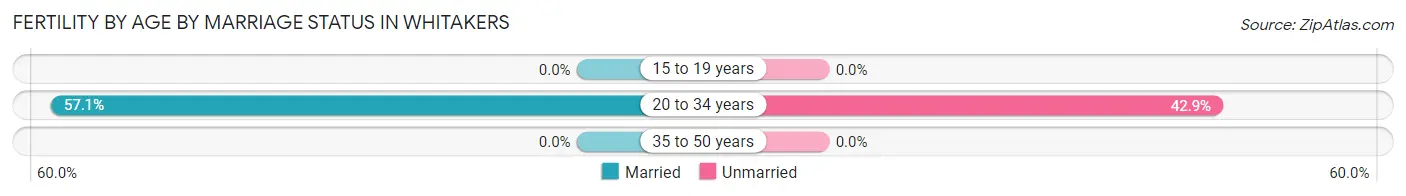
57.1% of women with births (21) in Whitakers are married. The highest percentage of unmarried women with births falls into 20 to 34 years age bracket with 42.9% of them unmarried at the time of birth, while the lowest percentage of unmarried women with births belong to 20 to 34 years age bracket with 42.9% of them unmarried.
| Age Bracket | Married | Unmarried |
| 15 to 19 years | 0 (0.0%) | 0 (0.0%) |
| 20 to 34 years | 12 (57.1%) | 9 (42.9%) |
| 35 to 50 years | 0 (0.0%) | 0 (0.0%) |
| Total | 12 (57.1%) | 9 (42.9%) |
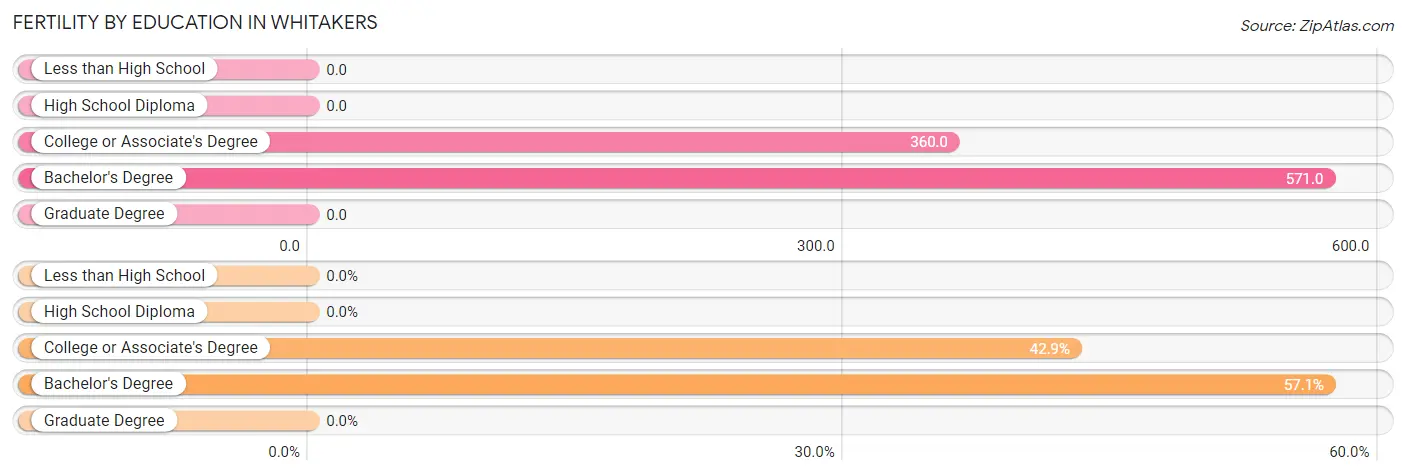
Fertility by Education in Whitakers
| Educational Attainment | Women with Births | Births / 1,000 Women |
| Less than High School | 0 (0.0%) | 0.0 |
| High School Diploma | 0 (0.0%) | 0.0 |
| College or Associate's Degree | 9 (42.9%) | 360.0 |
| Bachelor's Degree | 12 (57.1%) | 571.0 |
| Graduate Degree | 0 (0.0%) | 0.0 |
| Total | 21 (100.0%) | 228.0 |
Fertility by Education by Marriage Status in Whitakers
42.9% of women with births in Whitakers are unmarried. Women with the educational attainment of bachelor's degree are most likely to be married with 100.0% of them married at childbirth, while women with the educational attainment of college or associate's degree are least likely to be married with 100.0% of them unmarried at childbirth.
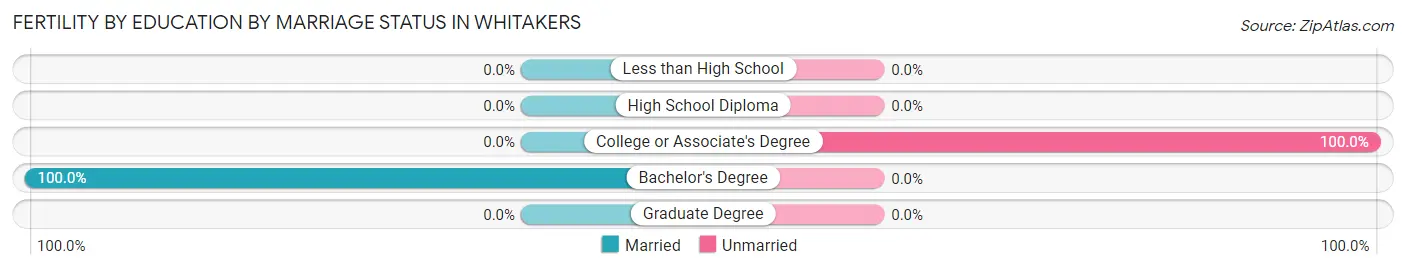
| Educational Attainment | Married | Unmarried |
| Less than High School | 0 (0.0%) | 0 (0.0%) |
| High School Diploma | 0 (0.0%) | 0 (0.0%) |
| College or Associate's Degree | 0 (0.0%) | 9 (100.0%) |
| Bachelor's Degree | 12 (100.0%) | 0 (0.0%) |
| Graduate Degree | 0 (0.0%) | 0 (0.0%) |
| Total | 12 (57.1%) | 9 (42.9%) |
Employment Characteristics in Whitakers
Employment by Class of Employer in Whitakers
Among the 209 employed individuals in Whitakers, private company employees (105 | 50.2%), local government employees (33 | 15.8%), and state government employees (27 | 12.9%) make up the most common classes of employment.
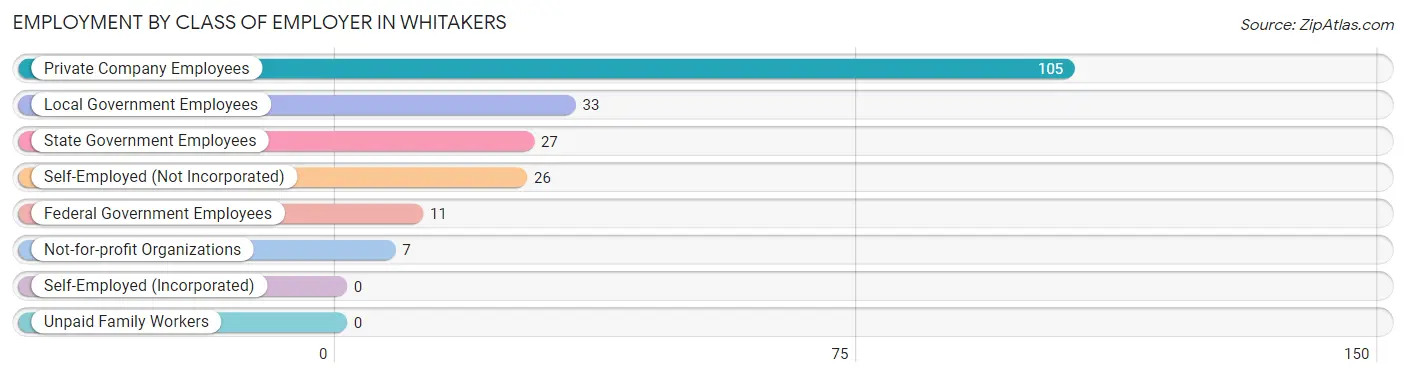
| Employer Class | # Employees | % Employees |
| Private Company Employees | 105 | 50.2% |
| Self-Employed (Incorporated) | 0 | 0.0% |
| Self-Employed (Not Incorporated) | 26 | 12.4% |
| Not-for-profit Organizations | 7 | 3.4% |
| Local Government Employees | 33 | 15.8% |
| State Government Employees | 27 | 12.9% |
| Federal Government Employees | 11 | 5.3% |
| Unpaid Family Workers | 0 | 0.0% |
| Total | 209 | 100.0% |
Employment Status by Age in Whitakers
According to the labor force statistics for Whitakers, out of the total population over 16 years of age (356), 62.9% or 224 individuals are in the labor force, with 6.7% or 15 of them unemployed. The age group with the highest labor force participation rate is 20 to 24 years, with 100.0% or 9 individuals in the labor force. Within the labor force, the 20 to 24 years age range has the highest percentage of unemployed individuals, with 33.3% or 3 of them being unemployed.
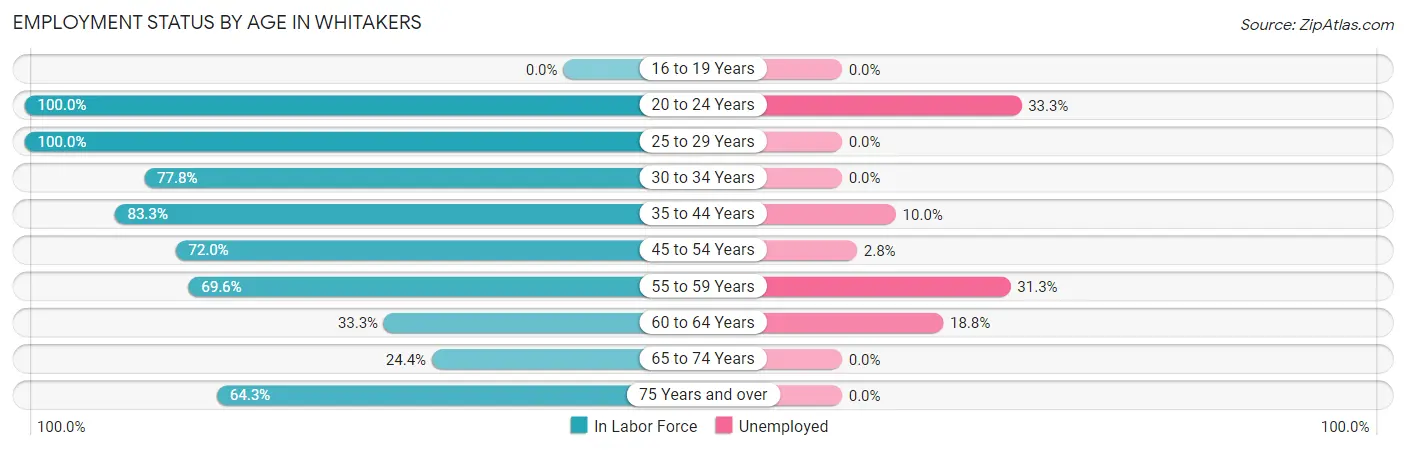
| Age Bracket | In Labor Force | Unemployed |
| 16 to 19 Years | 0 (0.0%) | 0 (0.0%) |
| 20 to 24 Years | 9 (100.0%) | 3 (33.3%) |
| 25 to 29 Years | 49 (100.0%) | 0 (0.0%) |
| 30 to 34 Years | 49 (77.8%) | 0 (0.0%) |
| 35 to 44 Years | 30 (83.3%) | 3 (10.0%) |
| 45 to 54 Years | 36 (72.0%) | 1 (2.8%) |
| 55 to 59 Years | 16 (69.6%) | 5 (31.3%) |
| 60 to 64 Years | 16 (33.3%) | 3 (18.8%) |
| 65 to 74 Years | 10 (24.4%) | 0 (0.0%) |
| 75 Years and over | 9 (64.3%) | 0 (0.0%) |
| Total | 224 (62.9%) | 15 (6.7%) |
Employment Status by Educational Attainment in Whitakers
According to labor force statistics for Whitakers, 72.9% of individuals (196) out of the total population between 25 and 64 years of age (269) are in the labor force, with 6.1% or 12 of them being unemployed. The group with the highest labor force participation rate are those with the educational attainment of bachelor's degree or higher, with 95.6% or 43 individuals in the labor force. Within the labor force, individuals with college / associate degree education have the highest percentage of unemployment, with 10.8% or 8 of them being unemployed.
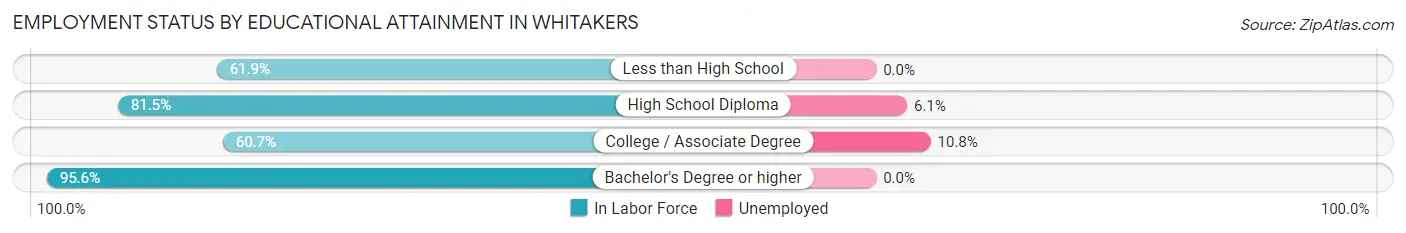
| Educational Attainment | In Labor Force | Unemployed |
| Less than High School | 13 (61.9%) | 0 (0.0%) |
| High School Diploma | 66 (81.5%) | 5 (6.1%) |
| College / Associate Degree | 74 (60.7%) | 13 (10.8%) |
| Bachelor's Degree or higher | 43 (95.6%) | 0 (0.0%) |
| Total | 196 (72.9%) | 16 (6.1%) |
Employment Occupations by Sex in Whitakers
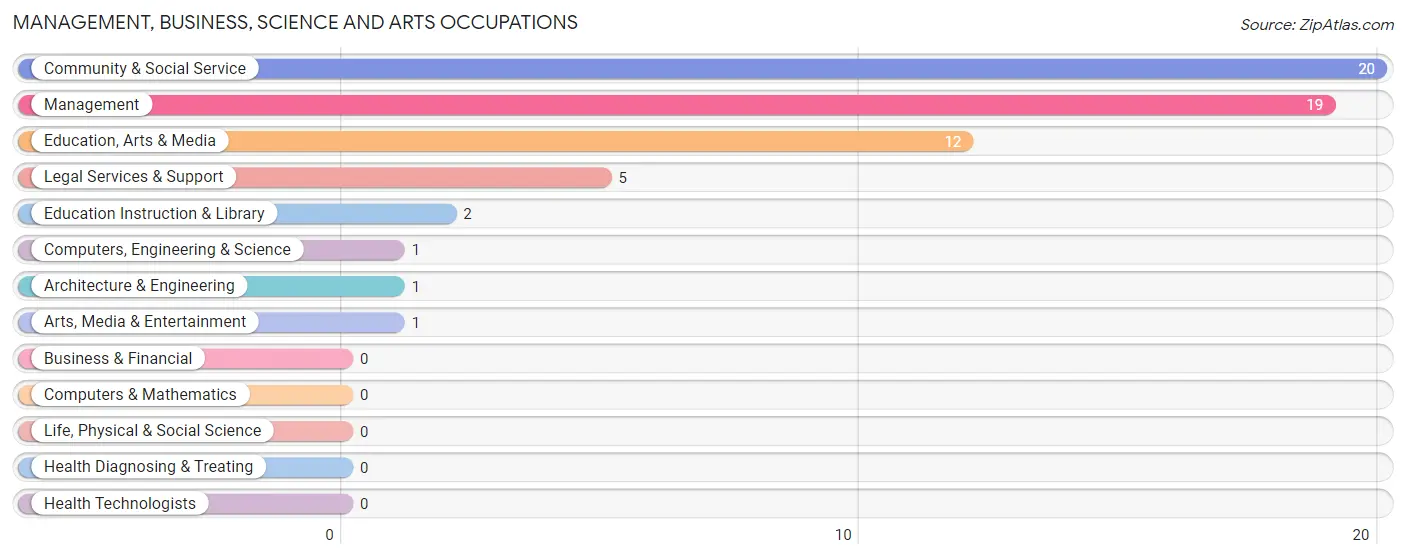
Management, Business, Science and Arts Occupations
The most common Management, Business, Science and Arts occupations in Whitakers are Community & Social Service (20 | 9.6%), Management (19 | 9.1%), Education, Arts & Media (12 | 5.7%), Legal Services & Support (5 | 2.4%), and Education Instruction & Library (2 | 1.0%).
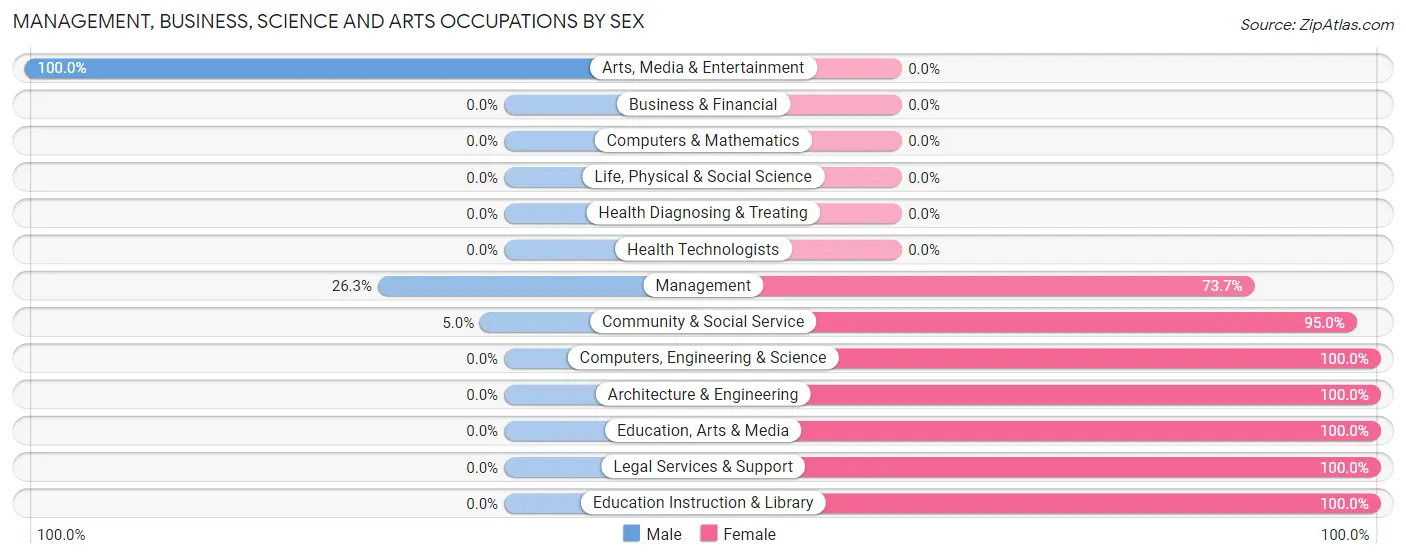
Management, Business, Science and Arts Occupations by Sex
Within the Management, Business, Science and Arts occupations in Whitakers, the most male-oriented occupations are Arts, Media & Entertainment (100.0%), Management (26.3%), and Community & Social Service (5.0%), while the most female-oriented occupations are Computers, Engineering & Science (100.0%), Architecture & Engineering (100.0%), and Education, Arts & Media (100.0%).
| Occupation | Male | Female |
| Management | 5 (26.3%) | 14 (73.7%) |
| Business & Financial | 0 (0.0%) | 0 (0.0%) |
| Computers, Engineering & Science | 0 (0.0%) | 1 (100.0%) |
| Computers & Mathematics | 0 (0.0%) | 0 (0.0%) |
| Architecture & Engineering | 0 (0.0%) | 1 (100.0%) |
| Life, Physical & Social Science | 0 (0.0%) | 0 (0.0%) |
| Community & Social Service | 1 (5.0%) | 19 (95.0%) |
| Education, Arts & Media | 0 (0.0%) | 12 (100.0%) |
| Legal Services & Support | 0 (0.0%) | 5 (100.0%) |
| Education Instruction & Library | 0 (0.0%) | 2 (100.0%) |
| Arts, Media & Entertainment | 1 (100.0%) | 0 (0.0%) |
| Health Diagnosing & Treating | 0 (0.0%) | 0 (0.0%) |
| Health Technologists | 0 (0.0%) | 0 (0.0%) |
| Total (Category) | 6 (15.0%) | 34 (85.0%) |
| Total (Overall) | 106 (50.7%) | 103 (49.3%) |
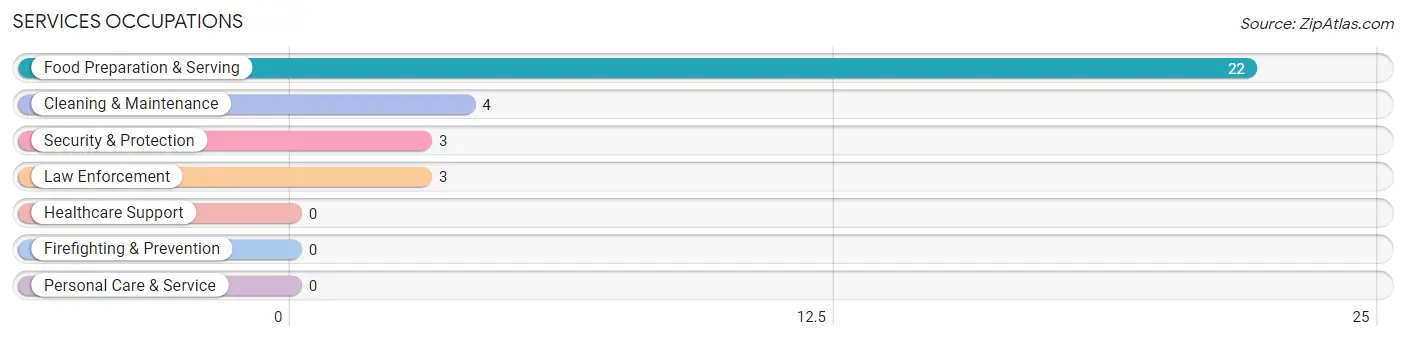
Services Occupations
The most common Services occupations in Whitakers are Food Preparation & Serving (22 | 10.5%), Cleaning & Maintenance (4 | 1.9%), Security & Protection (3 | 1.4%), and Law Enforcement (3 | 1.4%).
Services Occupations by Sex
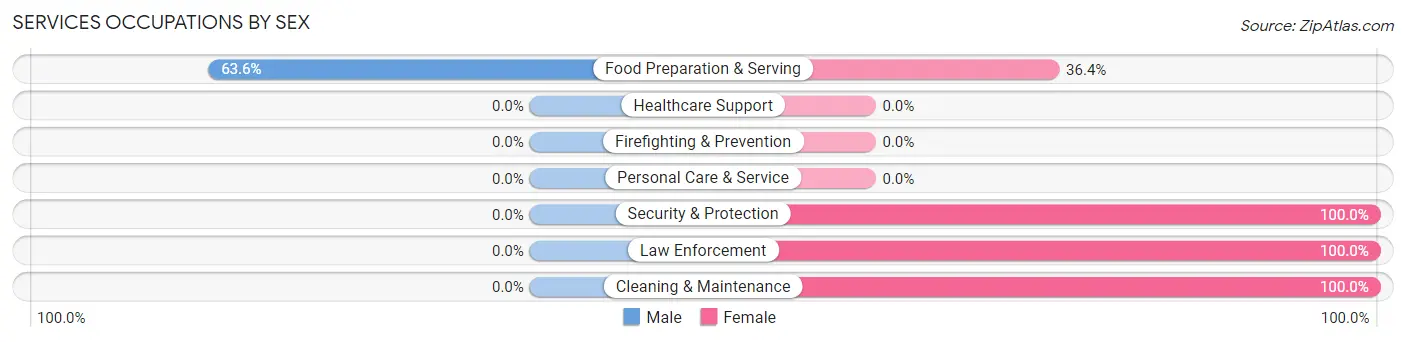
| Occupation | Male | Female |
| Healthcare Support | 0 (0.0%) | 0 (0.0%) |
| Security & Protection | 0 (0.0%) | 3 (100.0%) |
| Firefighting & Prevention | 0 (0.0%) | 0 (0.0%) |
| Law Enforcement | 0 (0.0%) | 3 (100.0%) |
| Food Preparation & Serving | 14 (63.6%) | 8 (36.4%) |
| Cleaning & Maintenance | 0 (0.0%) | 4 (100.0%) |
| Personal Care & Service | 0 (0.0%) | 0 (0.0%) |
| Total (Category) | 14 (48.3%) | 15 (51.7%) |
| Total (Overall) | 106 (50.7%) | 103 (49.3%) |
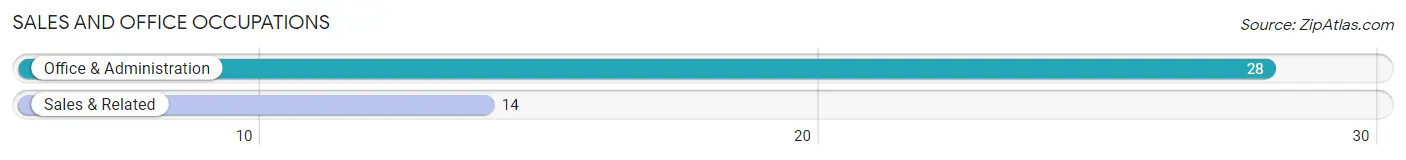
Sales and Office Occupations
The most common Sales and Office occupations in Whitakers are Office & Administration (28 | 13.4%), and Sales & Related (14 | 6.7%).
Sales and Office Occupations by Sex
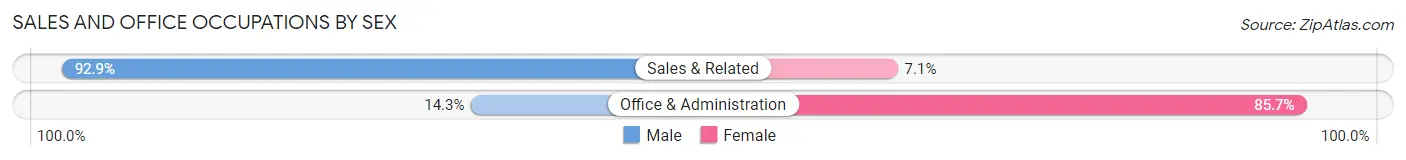
| Occupation | Male | Female |
| Sales & Related | 13 (92.9%) | 1 (7.1%) |
| Office & Administration | 4 (14.3%) | 24 (85.7%) |
| Total (Category) | 17 (40.5%) | 25 (59.5%) |
| Total (Overall) | 106 (50.7%) | 103 (49.3%) |
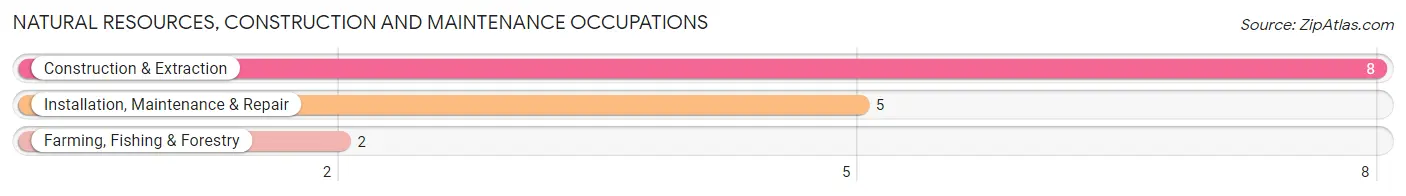
Natural Resources, Construction and Maintenance Occupations
The most common Natural Resources, Construction and Maintenance occupations in Whitakers are Construction & Extraction (8 | 3.8%), Installation, Maintenance & Repair (5 | 2.4%), and Farming, Fishing & Forestry (2 | 1.0%).
Natural Resources, Construction and Maintenance Occupations by Sex
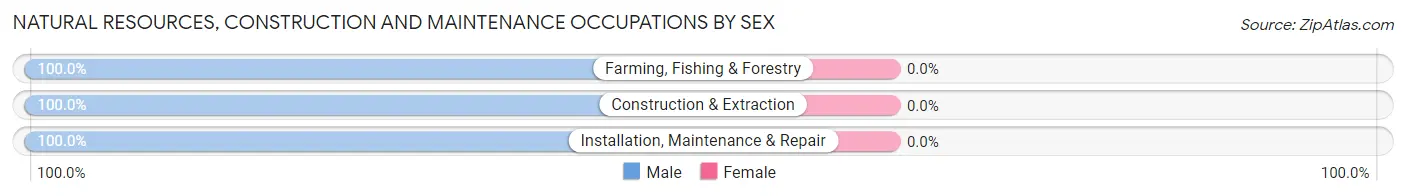
| Occupation | Male | Female |
| Farming, Fishing & Forestry | 2 (100.0%) | 0 (0.0%) |
| Construction & Extraction | 8 (100.0%) | 0 (0.0%) |
| Installation, Maintenance & Repair | 5 (100.0%) | 0 (0.0%) |
| Total (Category) | 15 (100.0%) | 0 (0.0%) |
| Total (Overall) | 106 (50.7%) | 103 (49.3%) |
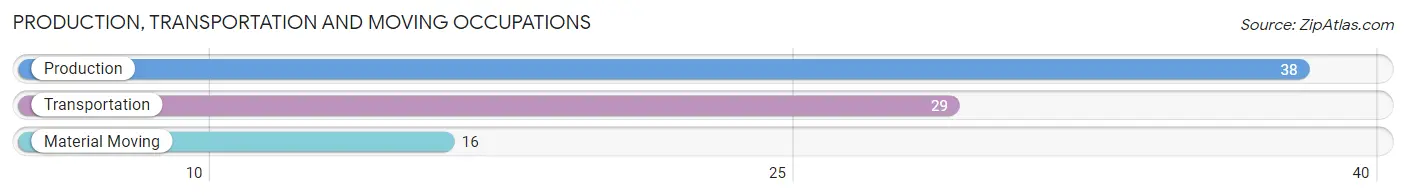
Production, Transportation and Moving Occupations
The most common Production, Transportation and Moving occupations in Whitakers are Production (38 | 18.2%), Transportation (29 | 13.9%), and Material Moving (16 | 7.7%).
Production, Transportation and Moving Occupations by Sex
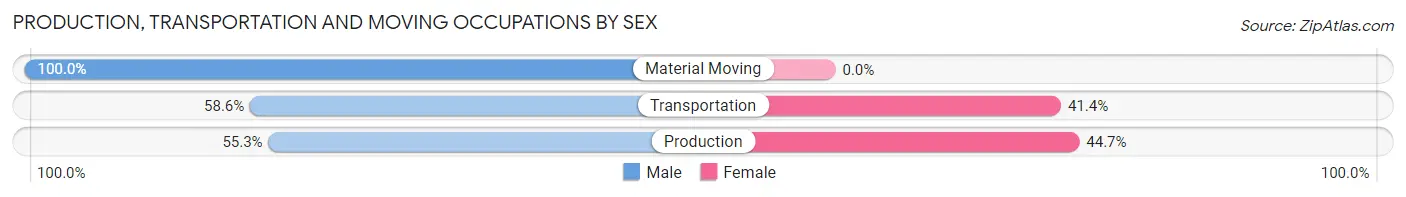
| Occupation | Male | Female |
| Production | 21 (55.3%) | 17 (44.7%) |
| Transportation | 17 (58.6%) | 12 (41.4%) |
| Material Moving | 16 (100.0%) | 0 (0.0%) |
| Total (Category) | 54 (65.1%) | 29 (34.9%) |
| Total (Overall) | 106 (50.7%) | 103 (49.3%) |
Employment Industries by Sex in Whitakers
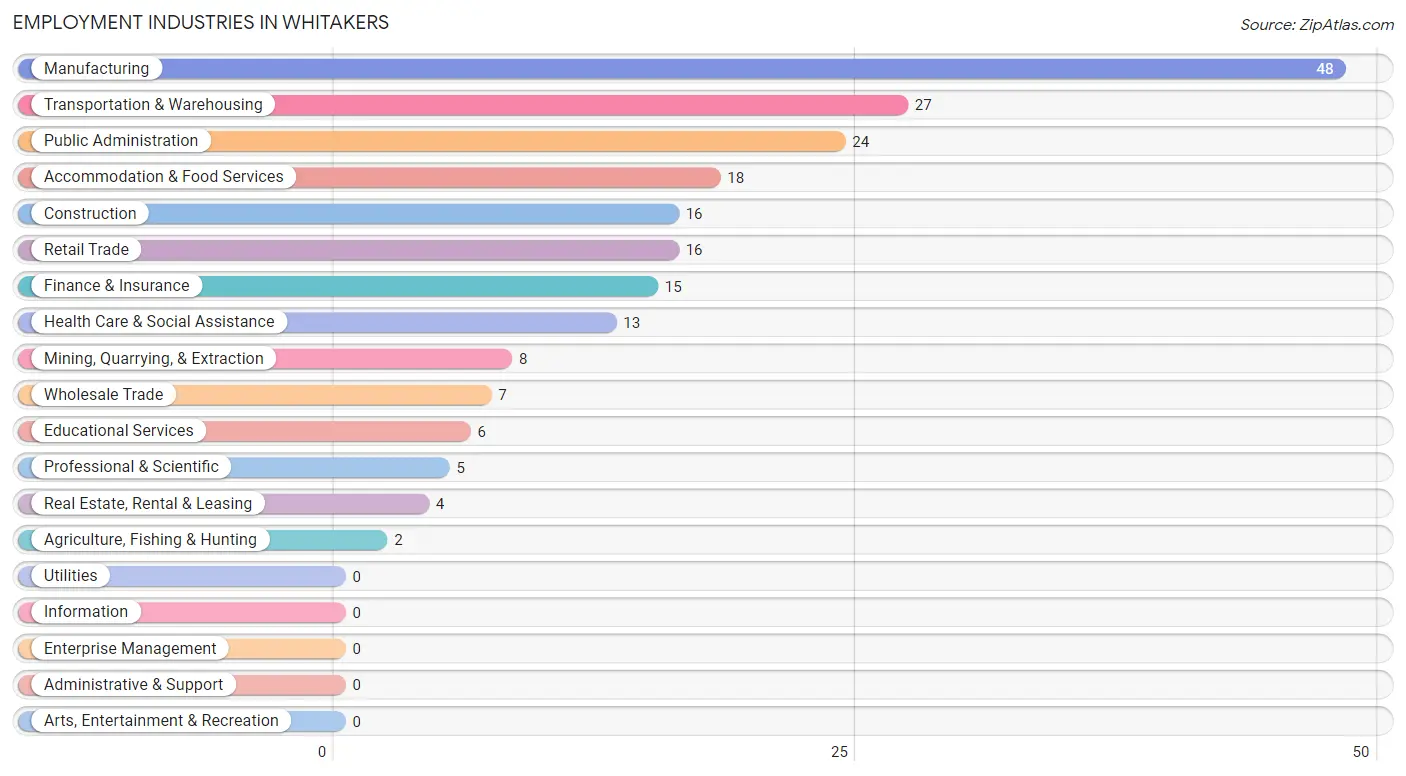
Employment Industries in Whitakers
The major employment industries in Whitakers include Manufacturing (48 | 23.0%), Transportation & Warehousing (27 | 12.9%), Public Administration (24 | 11.5%), Accommodation & Food Services (18 | 8.6%), and Construction (16 | 7.7%).
Employment Industries by Sex in Whitakers
The Whitakers industries that see more men than women are Agriculture, Fishing & Hunting (100.0%), Mining, Quarrying, & Extraction (100.0%), and Construction (100.0%), whereas the industries that tend to have a higher number of women are Finance & Insurance (100.0%), Real Estate, Rental & Leasing (100.0%), and Professional & Scientific (100.0%).
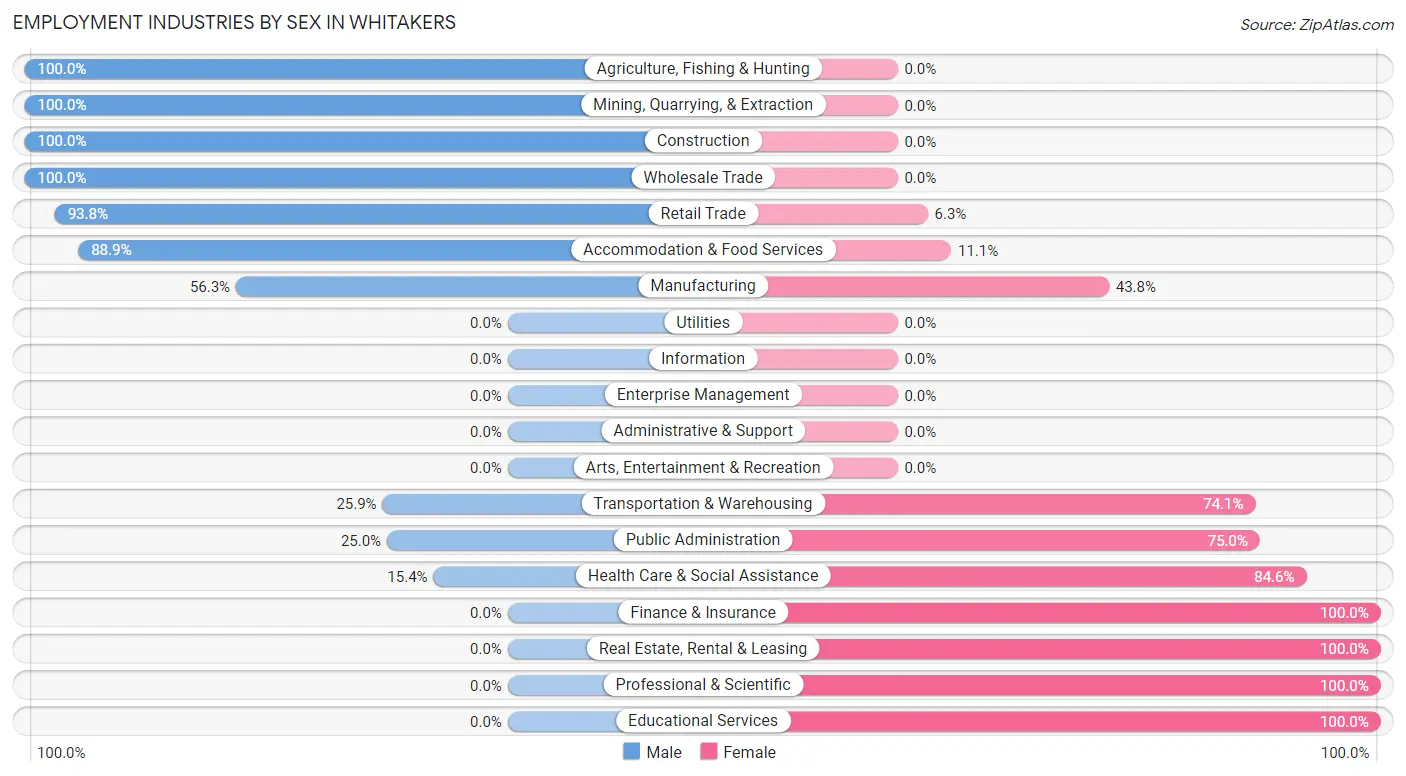
| Industry | Male | Female |
| Agriculture, Fishing & Hunting | 2 (100.0%) | 0 (0.0%) |
| Mining, Quarrying, & Extraction | 8 (100.0%) | 0 (0.0%) |
| Construction | 16 (100.0%) | 0 (0.0%) |
| Manufacturing | 27 (56.2%) | 21 (43.8%) |
| Wholesale Trade | 7 (100.0%) | 0 (0.0%) |
| Retail Trade | 15 (93.8%) | 1 (6.2%) |
| Transportation & Warehousing | 7 (25.9%) | 20 (74.1%) |
| Utilities | 0 (0.0%) | 0 (0.0%) |
| Information | 0 (0.0%) | 0 (0.0%) |
| Finance & Insurance | 0 (0.0%) | 15 (100.0%) |
| Real Estate, Rental & Leasing | 0 (0.0%) | 4 (100.0%) |
| Professional & Scientific | 0 (0.0%) | 5 (100.0%) |
| Enterprise Management | 0 (0.0%) | 0 (0.0%) |
| Administrative & Support | 0 (0.0%) | 0 (0.0%) |
| Educational Services | 0 (0.0%) | 6 (100.0%) |
| Health Care & Social Assistance | 2 (15.4%) | 11 (84.6%) |
| Arts, Entertainment & Recreation | 0 (0.0%) | 0 (0.0%) |
| Accommodation & Food Services | 16 (88.9%) | 2 (11.1%) |
| Public Administration | 6 (25.0%) | 18 (75.0%) |
| Total | 106 (50.7%) | 103 (49.3%) |
Education in Whitakers
School Enrollment in Whitakers
The most common levels of schooling among the 130 students in Whitakers are nursery / preschool (37 | 28.5%), middle school (26 | 20.0%), and high school (23 | 17.7%).
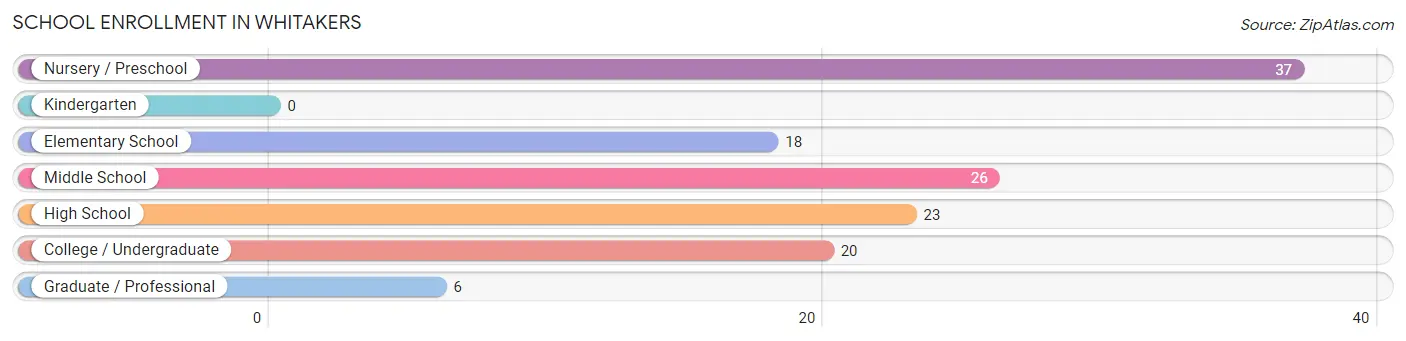
| School Level | # Students | % Students |
| Nursery / Preschool | 37 | 28.5% |
| Kindergarten | 0 | 0.0% |
| Elementary School | 18 | 13.9% |
| Middle School | 26 | 20.0% |
| High School | 23 | 17.7% |
| College / Undergraduate | 20 | 15.4% |
| Graduate / Professional | 6 | 4.6% |
| Total | 130 | 100.0% |
School Enrollment by Age by Funding Source in Whitakers
Out of a total of 130 students who are enrolled in schools in Whitakers, 9 (6.9%) attend a private institution, while the remaining 121 (93.1%) are enrolled in public schools. The age group of 10 to 14 year olds has the highest likelihood of being enrolled in private schools, with 5 (19.2% in the age bracket) enrolled. Conversely, the age group of 3 to 4 year olds has the lowest likelihood of being enrolled in a private school, with 28 (100.0% in the age bracket) attending a public institution.
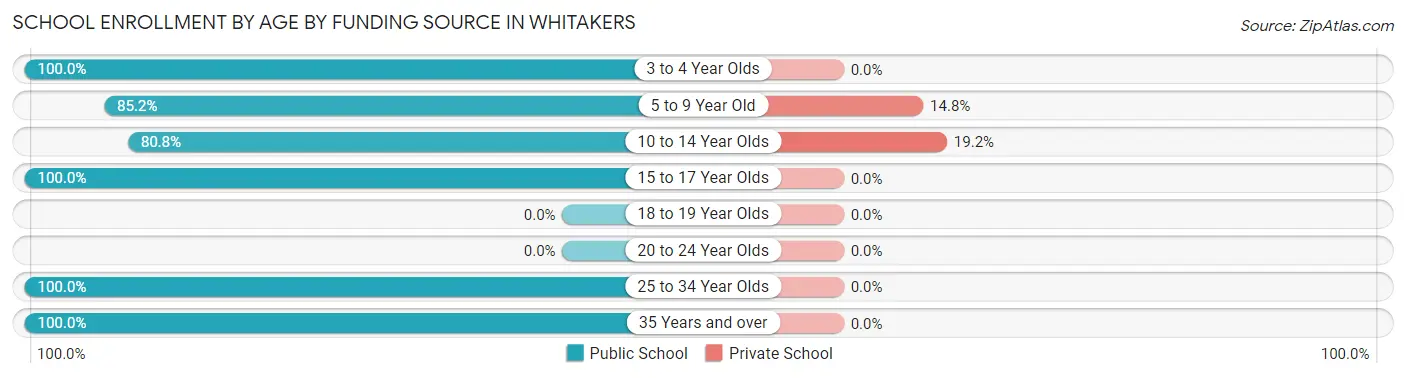
| Age Bracket | Public School | Private School |
| 3 to 4 Year Olds | 28 (100.0%) | 0 (0.0%) |
| 5 to 9 Year Old | 23 (85.2%) | 4 (14.8%) |
| 10 to 14 Year Olds | 21 (80.8%) | 5 (19.2%) |
| 15 to 17 Year Olds | 23 (100.0%) | 0 (0.0%) |
| 18 to 19 Year Olds | 0 (0.0%) | 0 (0.0%) |
| 20 to 24 Year Olds | 0 (0.0%) | 0 (0.0%) |
| 25 to 34 Year Olds | 9 (100.0%) | 0 (0.0%) |
| 35 Years and over | 17 (100.0%) | 0 (0.0%) |
| Total | 121 (93.1%) | 9 (6.9%) |
Educational Attainment by Field of Study in Whitakers
Bio, nature & agricultural (13 | 23.2%), arts & humanities (13 | 23.2%), science & technology (7 | 12.5%), computers & mathematics (5 | 8.9%), and multidisciplinary studies (5 | 8.9%) are the most common fields of study among 56 individuals in Whitakers who have obtained a bachelor's degree or higher.
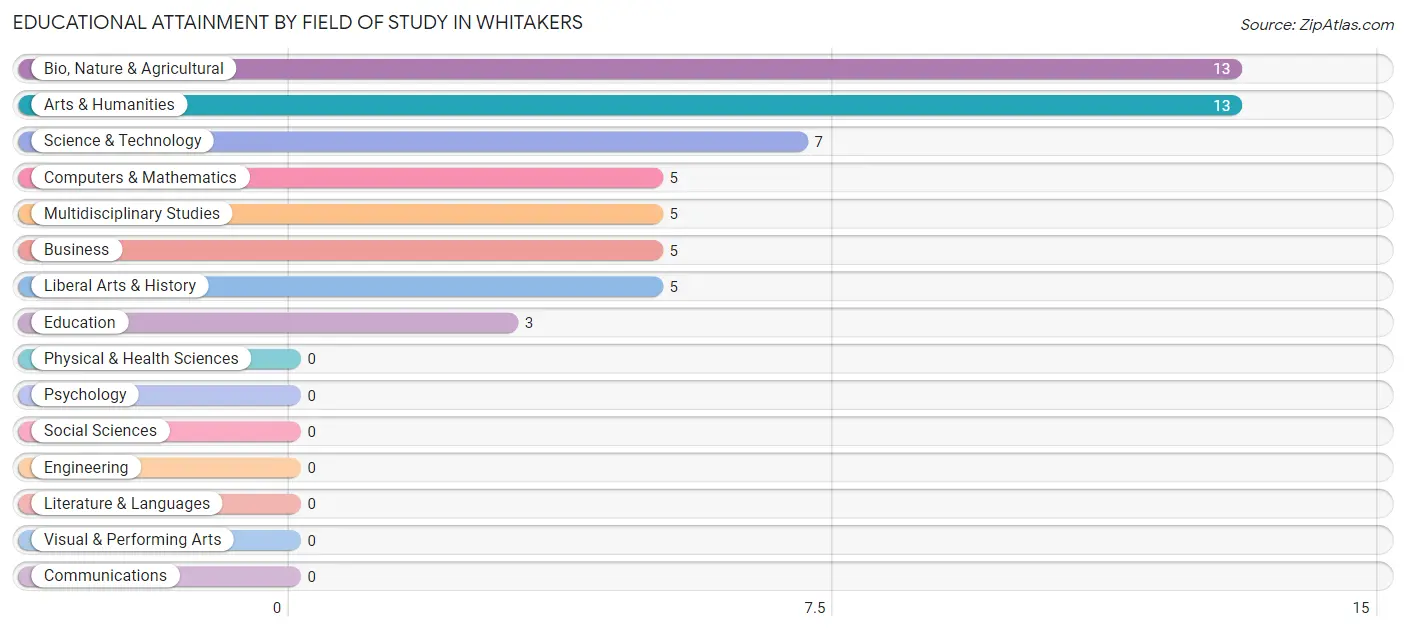
| Field of Study | # Graduates | % Graduates |
| Computers & Mathematics | 5 | 8.9% |
| Bio, Nature & Agricultural | 13 | 23.2% |
| Physical & Health Sciences | 0 | 0.0% |
| Psychology | 0 | 0.0% |
| Social Sciences | 0 | 0.0% |
| Engineering | 0 | 0.0% |
| Multidisciplinary Studies | 5 | 8.9% |
| Science & Technology | 7 | 12.5% |
| Business | 5 | 8.9% |
| Education | 3 | 5.4% |
| Literature & Languages | 0 | 0.0% |
| Liberal Arts & History | 5 | 8.9% |
| Visual & Performing Arts | 0 | 0.0% |
| Communications | 0 | 0.0% |
| Arts & Humanities | 13 | 23.2% |
| Total | 56 | 100.0% |
Transportation & Commute in Whitakers
Vehicle Availability by Sex in Whitakers
The most prevalent vehicle ownership categories in Whitakers are males with 1 vehicle (39, accounting for 36.8%) and females with 1 vehicle (26, making up 37.9%).
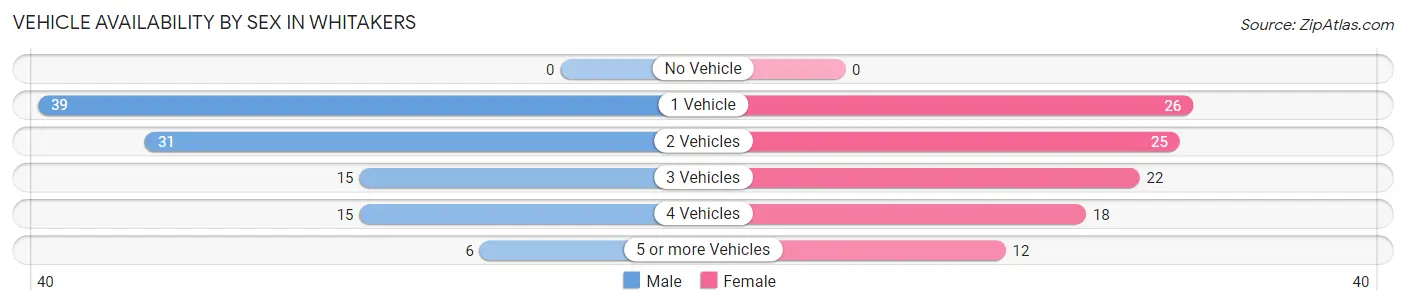
| Vehicles Available | Male | Female |
| No Vehicle | 0 (0.0%) | 0 (0.0%) |
| 1 Vehicle | 39 (36.8%) | 26 (25.2%) |
| 2 Vehicles | 31 (29.2%) | 25 (24.3%) |
| 3 Vehicles | 15 (14.1%) | 22 (21.4%) |
| 4 Vehicles | 15 (14.1%) | 18 (17.5%) |
| 5 or more Vehicles | 6 (5.7%) | 12 (11.7%) |
| Total | 106 (100.0%) | 103 (100.0%) |
Commute Time in Whitakers
The most frequently occuring commute durations in Whitakers are 30 to 34 minutes (41 commuters, 21.2%), 25 to 29 minutes (25 commuters, 13.0%), and 15 to 19 minutes (20 commuters, 10.4%).
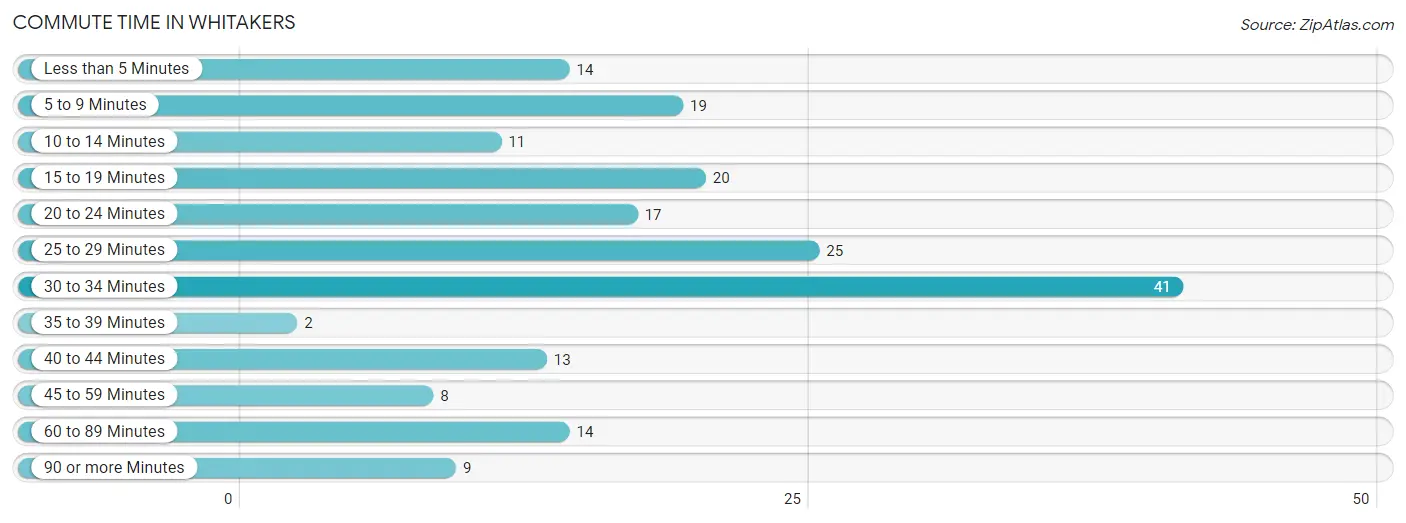
| Commute Time | # Commuters | % Commuters |
| Less than 5 Minutes | 14 | 7.2% |
| 5 to 9 Minutes | 19 | 9.8% |
| 10 to 14 Minutes | 11 | 5.7% |
| 15 to 19 Minutes | 20 | 10.4% |
| 20 to 24 Minutes | 17 | 8.8% |
| 25 to 29 Minutes | 25 | 13.0% |
| 30 to 34 Minutes | 41 | 21.2% |
| 35 to 39 Minutes | 2 | 1.0% |
| 40 to 44 Minutes | 13 | 6.7% |
| 45 to 59 Minutes | 8 | 4.2% |
| 60 to 89 Minutes | 14 | 7.2% |
| 90 or more Minutes | 9 | 4.7% |
Commute Time by Sex in Whitakers
The most common commute times in Whitakers are 30 to 34 minutes (19 commuters, 17.9%) for males and 30 to 34 minutes (22 commuters, 25.3%) for females.
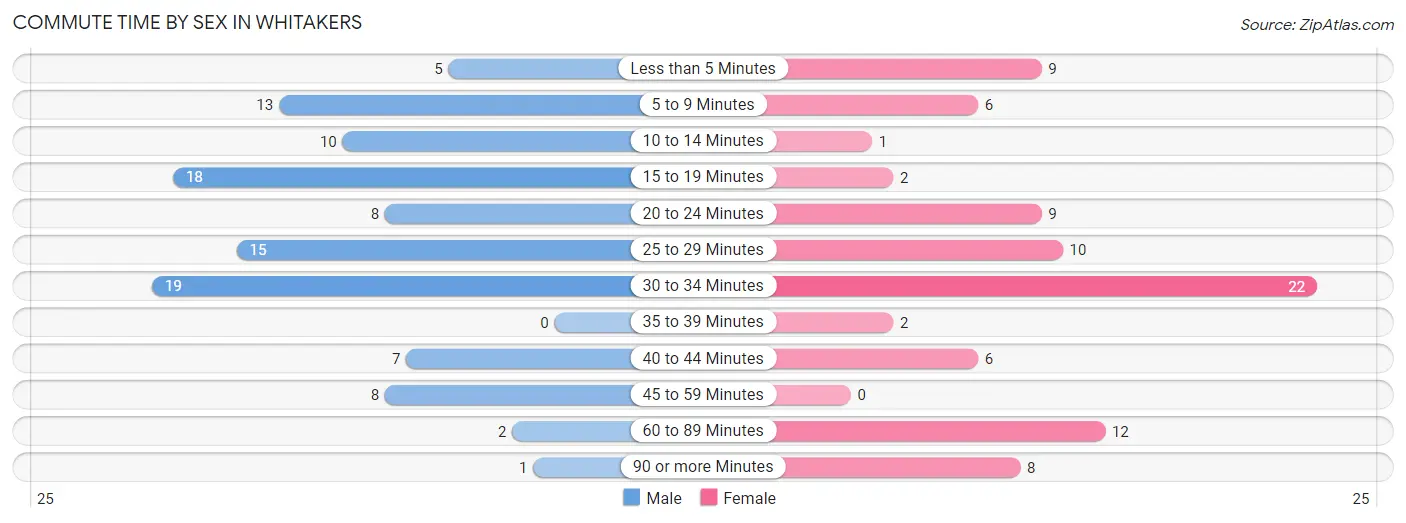
| Commute Time | Male | Female |
| Less than 5 Minutes | 5 (4.7%) | 9 (10.3%) |
| 5 to 9 Minutes | 13 (12.3%) | 6 (6.9%) |
| 10 to 14 Minutes | 10 (9.4%) | 1 (1.1%) |
| 15 to 19 Minutes | 18 (17.0%) | 2 (2.3%) |
| 20 to 24 Minutes | 8 (7.5%) | 9 (10.3%) |
| 25 to 29 Minutes | 15 (14.1%) | 10 (11.5%) |
| 30 to 34 Minutes | 19 (17.9%) | 22 (25.3%) |
| 35 to 39 Minutes | 0 (0.0%) | 2 (2.3%) |
| 40 to 44 Minutes | 7 (6.6%) | 6 (6.9%) |
| 45 to 59 Minutes | 8 (7.5%) | 0 (0.0%) |
| 60 to 89 Minutes | 2 (1.9%) | 12 (13.8%) |
| 90 or more Minutes | 1 (0.9%) | 8 (9.2%) |
Time of Departure to Work by Sex in Whitakers
The most frequent times of departure to work in Whitakers are 6:30 AM to 6:59 AM (18, 17.0%) for males and 7:00 AM to 7:29 AM (18, 20.7%) for females.
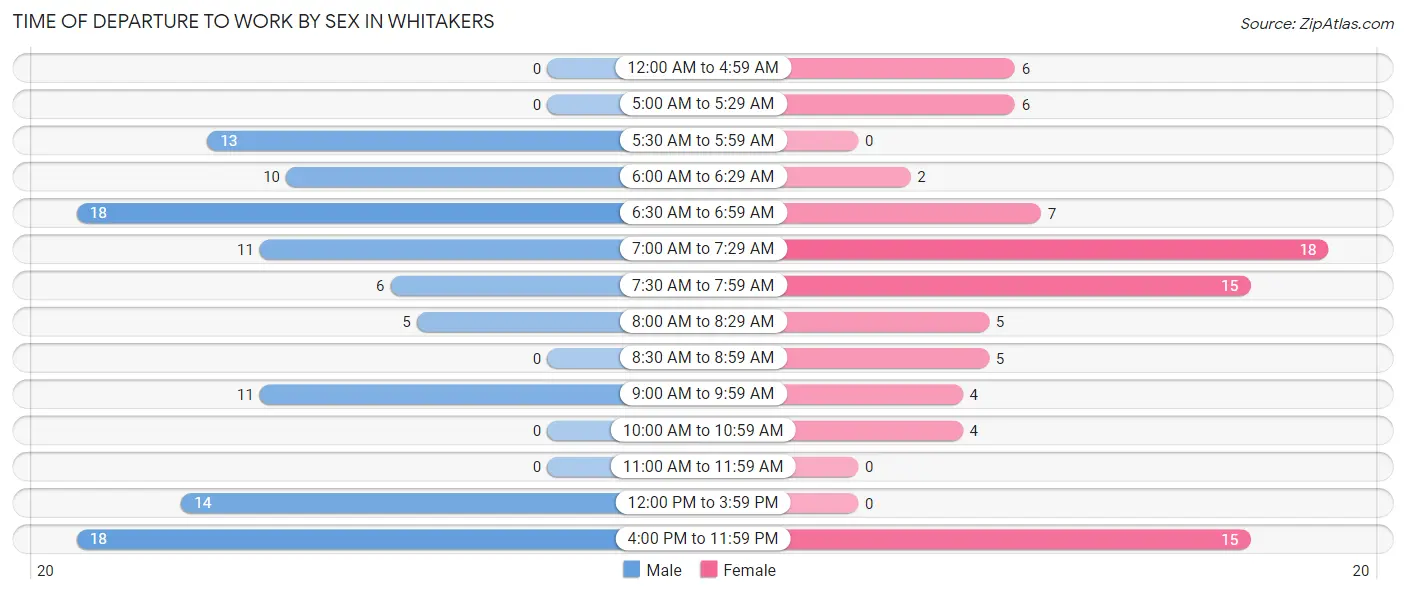
| Time of Departure | Male | Female |
| 12:00 AM to 4:59 AM | 0 (0.0%) | 6 (6.9%) |
| 5:00 AM to 5:29 AM | 0 (0.0%) | 6 (6.9%) |
| 5:30 AM to 5:59 AM | 13 (12.3%) | 0 (0.0%) |
| 6:00 AM to 6:29 AM | 10 (9.4%) | 2 (2.3%) |
| 6:30 AM to 6:59 AM | 18 (17.0%) | 7 (8.1%) |
| 7:00 AM to 7:29 AM | 11 (10.4%) | 18 (20.7%) |
| 7:30 AM to 7:59 AM | 6 (5.7%) | 15 (17.2%) |
| 8:00 AM to 8:29 AM | 5 (4.7%) | 5 (5.8%) |
| 8:30 AM to 8:59 AM | 0 (0.0%) | 5 (5.8%) |
| 9:00 AM to 9:59 AM | 11 (10.4%) | 4 (4.6%) |
| 10:00 AM to 10:59 AM | 0 (0.0%) | 4 (4.6%) |
| 11:00 AM to 11:59 AM | 0 (0.0%) | 0 (0.0%) |
| 12:00 PM to 3:59 PM | 14 (13.2%) | 0 (0.0%) |
| 4:00 PM to 11:59 PM | 18 (17.0%) | 15 (17.2%) |
| Total | 106 (100.0%) | 87 (100.0%) |
Housing Occupancy in Whitakers
Occupancy by Ownership in Whitakers
Of the total 234 dwellings in Whitakers, owner-occupied units account for 137 (58.6%), while renter-occupied units make up 97 (41.4%).
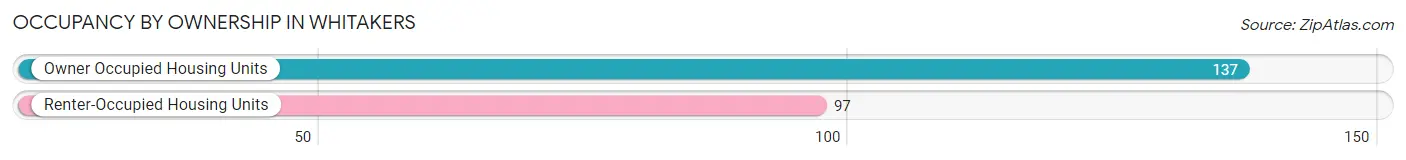
| Occupancy | # Housing Units | % Housing Units |
| Owner Occupied Housing Units | 137 | 58.6% |
| Renter-Occupied Housing Units | 97 | 41.4% |
| Total Occupied Housing Units | 234 | 100.0% |
Occupancy by Household Size in Whitakers
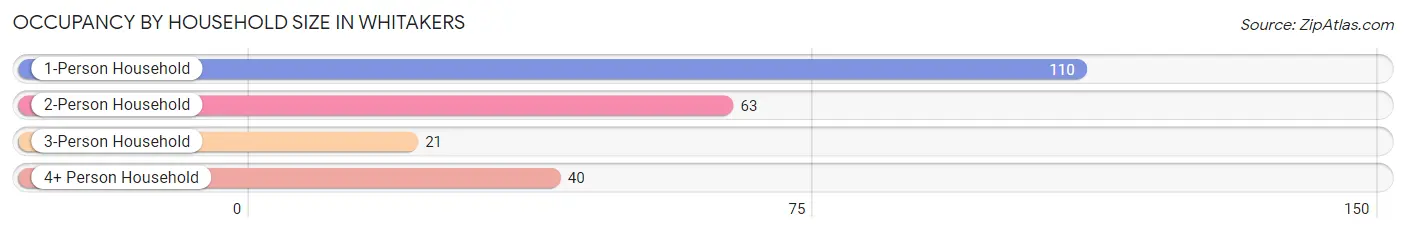
| Household Size | # Housing Units | % Housing Units |
| 1-Person Household | 110 | 47.0% |
| 2-Person Household | 63 | 26.9% |
| 3-Person Household | 21 | 9.0% |
| 4+ Person Household | 40 | 17.1% |
| Total Housing Units | 234 | 100.0% |
Occupancy by Ownership by Household Size in Whitakers
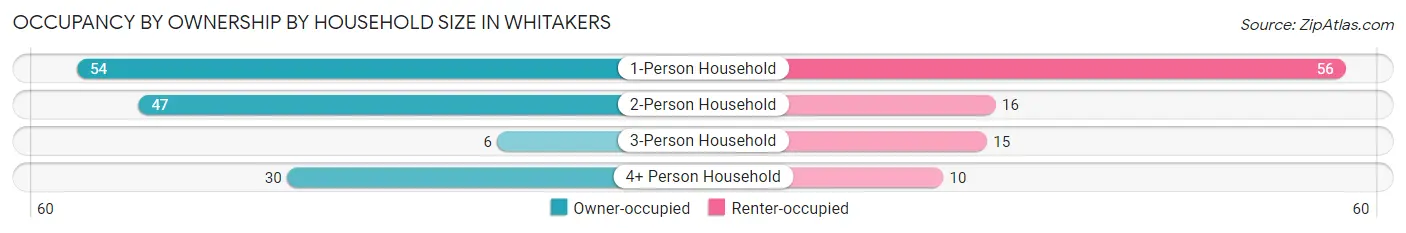
| Household Size | Owner-occupied | Renter-occupied |
| 1-Person Household | 54 (49.1%) | 56 (50.9%) |
| 2-Person Household | 47 (74.6%) | 16 (25.4%) |
| 3-Person Household | 6 (28.6%) | 15 (71.4%) |
| 4+ Person Household | 30 (75.0%) | 10 (25.0%) |
| Total Housing Units | 137 (58.6%) | 97 (41.4%) |
Occupancy by Educational Attainment in Whitakers
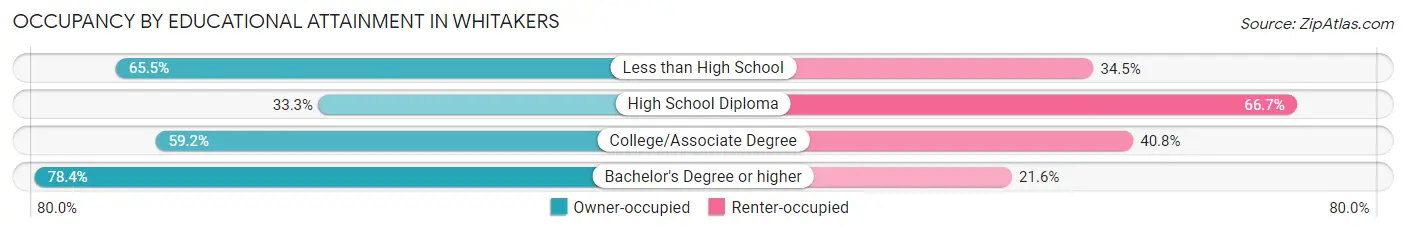
| Household Size | Owner-occupied | Renter-occupied |
| Less than High School | 19 (65.5%) | 10 (34.5%) |
| High School Diploma | 17 (33.3%) | 34 (66.7%) |
| College/Associate Degree | 61 (59.2%) | 42 (40.8%) |
| Bachelor's Degree or higher | 40 (78.4%) | 11 (21.6%) |
Occupancy by Age of Householder in Whitakers
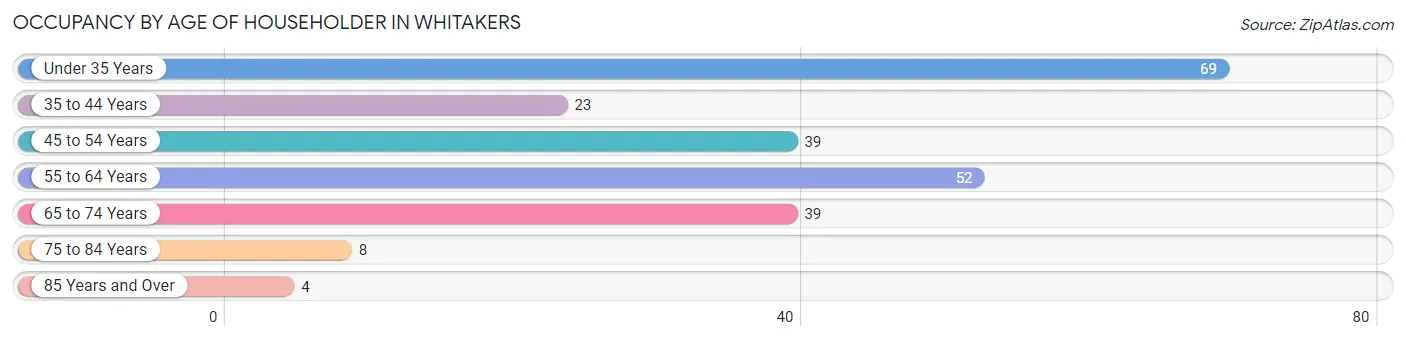
| Age Bracket | # Households | % Households |
| Under 35 Years | 69 | 29.5% |
| 35 to 44 Years | 23 | 9.8% |
| 45 to 54 Years | 39 | 16.7% |
| 55 to 64 Years | 52 | 22.2% |
| 65 to 74 Years | 39 | 16.7% |
| 75 to 84 Years | 8 | 3.4% |
| 85 Years and Over | 4 | 1.7% |
| Total | 234 | 100.0% |
Housing Finances in Whitakers
Median Income by Occupancy in Whitakers
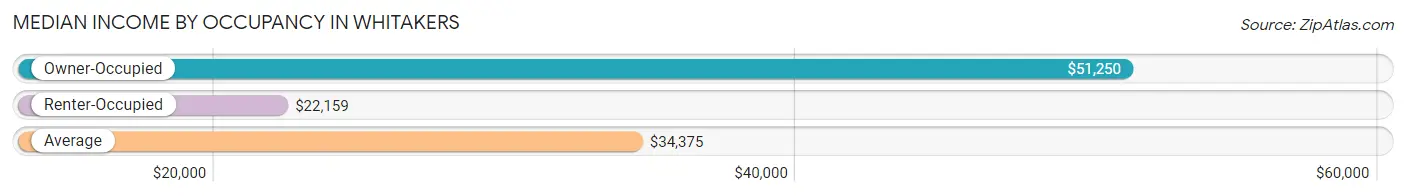
| Occupancy Type | # Households | Median Income |
| Owner-Occupied | 137 (58.6%) | $51,250 |
| Renter-Occupied | 97 (41.4%) | $22,159 |
| Average | 234 (100.0%) | $34,375 |
Occupancy by Householder Income Bracket in Whitakers
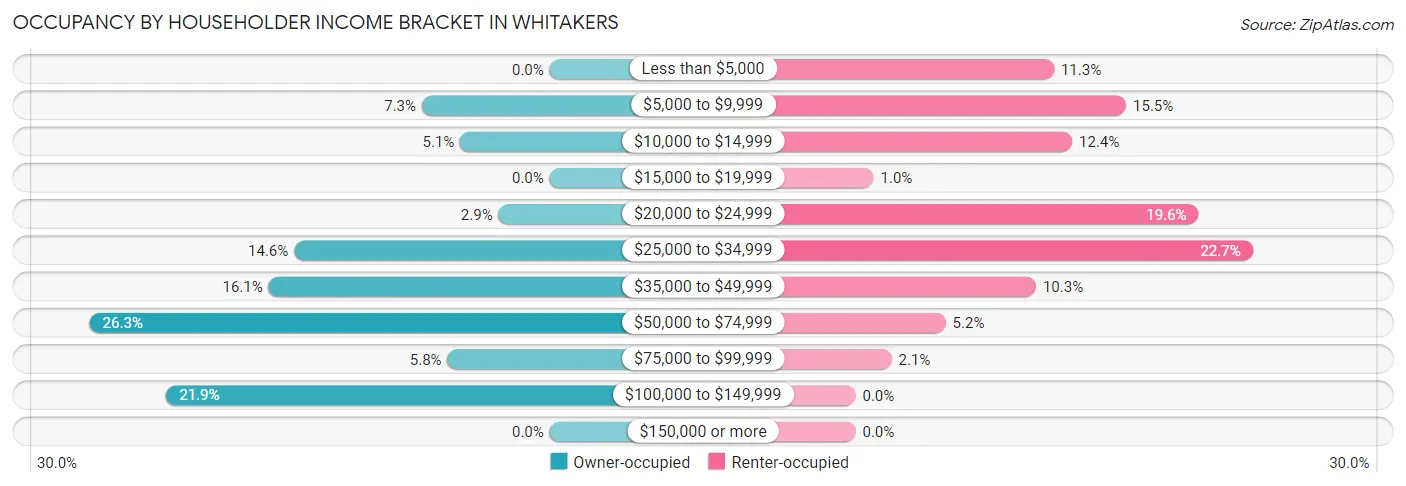
| Income Bracket | Owner-occupied | Renter-occupied |
| Less than $5,000 | 0 (0.0%) | 11 (11.3%) |
| $5,000 to $9,999 | 10 (7.3%) | 15 (15.5%) |
| $10,000 to $14,999 | 7 (5.1%) | 12 (12.4%) |
| $15,000 to $19,999 | 0 (0.0%) | 1 (1.0%) |
| $20,000 to $24,999 | 4 (2.9%) | 19 (19.6%) |
| $25,000 to $34,999 | 20 (14.6%) | 22 (22.7%) |
| $35,000 to $49,999 | 22 (16.1%) | 10 (10.3%) |
| $50,000 to $74,999 | 36 (26.3%) | 5 (5.1%) |
| $75,000 to $99,999 | 8 (5.8%) | 2 (2.1%) |
| $100,000 to $149,999 | 30 (21.9%) | 0 (0.0%) |
| $150,000 or more | 0 (0.0%) | 0 (0.0%) |
| Total | 137 (100.0%) | 97 (100.0%) |
Monthly Housing Cost Tiers in Whitakers
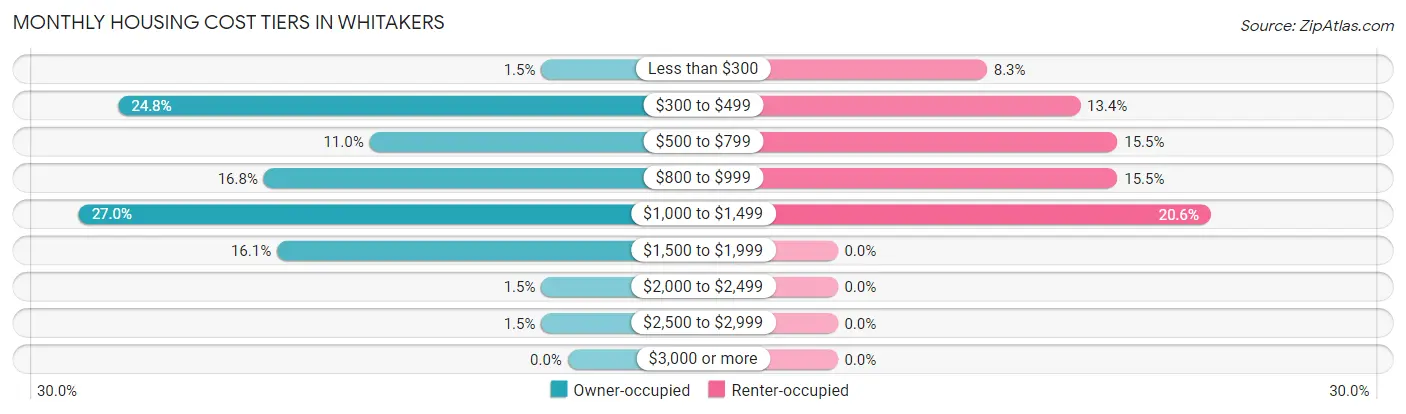
| Monthly Cost | Owner-occupied | Renter-occupied |
| Less than $300 | 2 (1.5%) | 8 (8.3%) |
| $300 to $499 | 34 (24.8%) | 13 (13.4%) |
| $500 to $799 | 15 (11.0%) | 15 (15.5%) |
| $800 to $999 | 23 (16.8%) | 15 (15.5%) |
| $1,000 to $1,499 | 37 (27.0%) | 20 (20.6%) |
| $1,500 to $1,999 | 22 (16.1%) | 0 (0.0%) |
| $2,000 to $2,499 | 2 (1.5%) | 0 (0.0%) |
| $2,500 to $2,999 | 2 (1.5%) | 0 (0.0%) |
| $3,000 or more | 0 (0.0%) | 0 (0.0%) |
| Total | 137 (100.0%) | 97 (100.0%) |
Physical Housing Characteristics in Whitakers
Housing Structures in Whitakers
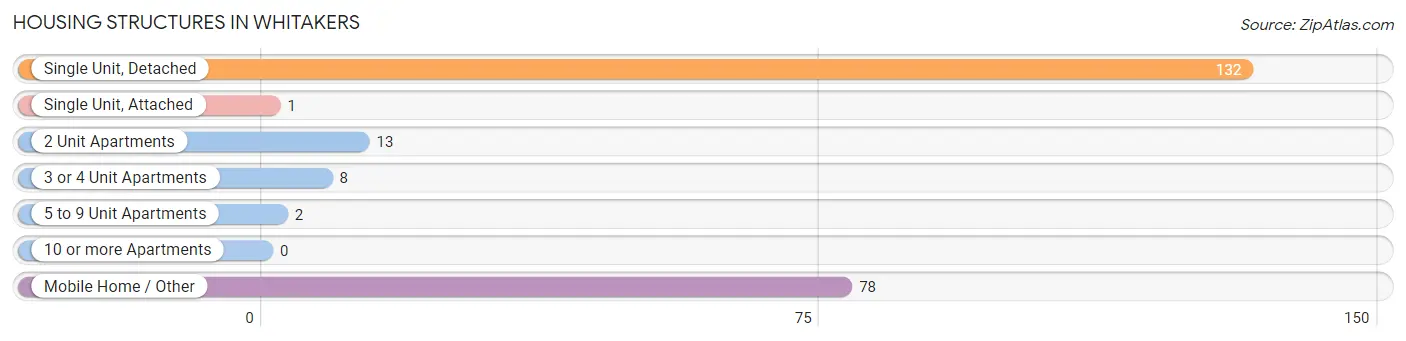
| Structure Type | # Housing Units | % Housing Units |
| Single Unit, Detached | 132 | 56.4% |
| Single Unit, Attached | 1 | 0.4% |
| 2 Unit Apartments | 13 | 5.6% |
| 3 or 4 Unit Apartments | 8 | 3.4% |
| 5 to 9 Unit Apartments | 2 | 0.9% |
| 10 or more Apartments | 0 | 0.0% |
| Mobile Home / Other | 78 | 33.3% |
| Total | 234 | 100.0% |
Housing Structures by Occupancy in Whitakers
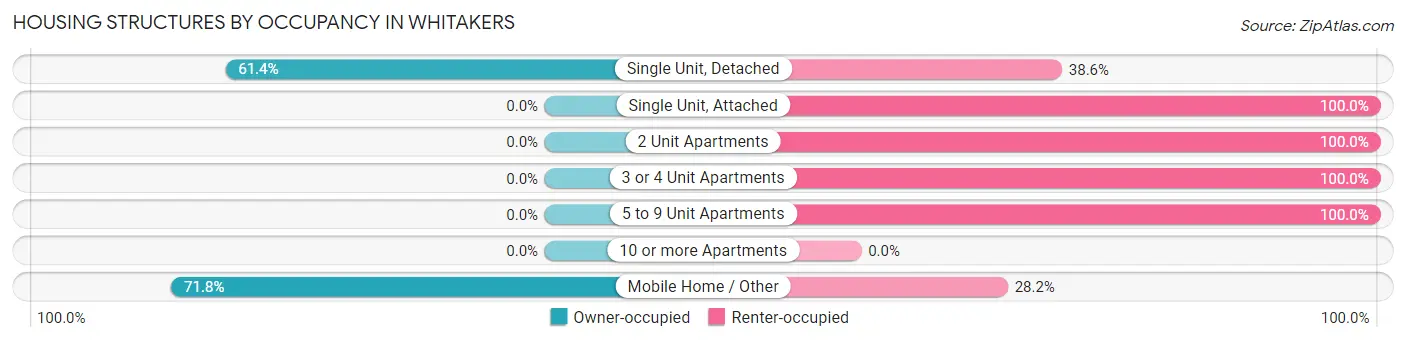
| Structure Type | Owner-occupied | Renter-occupied |
| Single Unit, Detached | 81 (61.4%) | 51 (38.6%) |
| Single Unit, Attached | 0 (0.0%) | 1 (100.0%) |
| 2 Unit Apartments | 0 (0.0%) | 13 (100.0%) |
| 3 or 4 Unit Apartments | 0 (0.0%) | 8 (100.0%) |
| 5 to 9 Unit Apartments | 0 (0.0%) | 2 (100.0%) |
| 10 or more Apartments | 0 (0.0%) | 0 (0.0%) |
| Mobile Home / Other | 56 (71.8%) | 22 (28.2%) |
| Total | 137 (58.6%) | 97 (41.4%) |
Housing Structures by Number of Rooms in Whitakers
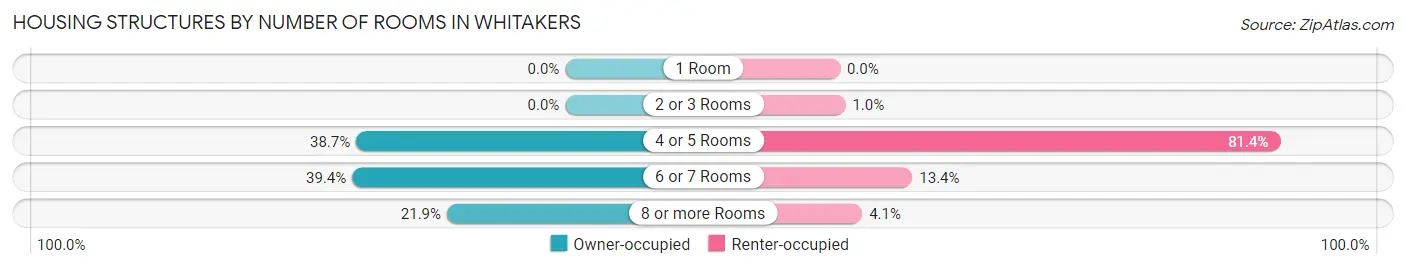
| Number of Rooms | Owner-occupied | Renter-occupied |
| 1 Room | 0 (0.0%) | 0 (0.0%) |
| 2 or 3 Rooms | 0 (0.0%) | 1 (1.0%) |
| 4 or 5 Rooms | 53 (38.7%) | 79 (81.4%) |
| 6 or 7 Rooms | 54 (39.4%) | 13 (13.4%) |
| 8 or more Rooms | 30 (21.9%) | 4 (4.1%) |
| Total | 137 (100.0%) | 97 (100.0%) |
Housing Structure by Heating Type in Whitakers
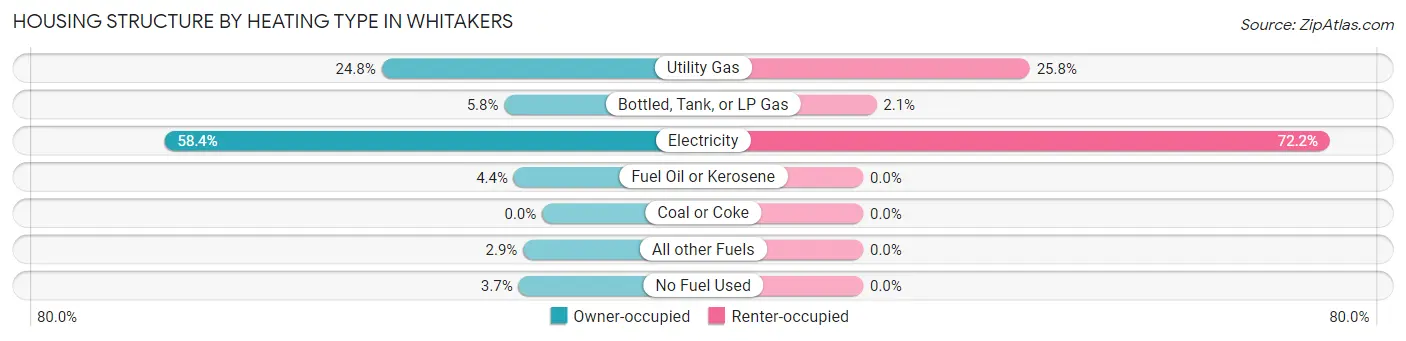
| Heating Type | Owner-occupied | Renter-occupied |
| Utility Gas | 34 (24.8%) | 25 (25.8%) |
| Bottled, Tank, or LP Gas | 8 (5.8%) | 2 (2.1%) |
| Electricity | 80 (58.4%) | 70 (72.2%) |
| Fuel Oil or Kerosene | 6 (4.4%) | 0 (0.0%) |
| Coal or Coke | 0 (0.0%) | 0 (0.0%) |
| All other Fuels | 4 (2.9%) | 0 (0.0%) |
| No Fuel Used | 5 (3.6%) | 0 (0.0%) |
| Total | 137 (100.0%) | 97 (100.0%) |
Household Vehicle Usage in Whitakers
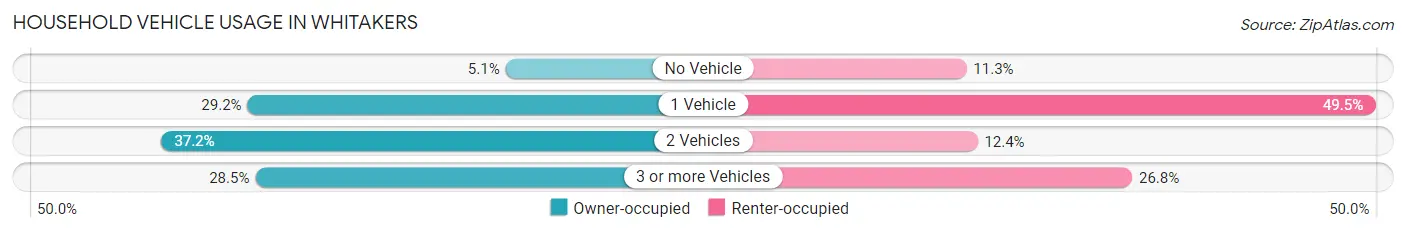
| Vehicles per Household | Owner-occupied | Renter-occupied |
| No Vehicle | 7 (5.1%) | 11 (11.3%) |
| 1 Vehicle | 40 (29.2%) | 48 (49.5%) |
| 2 Vehicles | 51 (37.2%) | 12 (12.4%) |
| 3 or more Vehicles | 39 (28.5%) | 26 (26.8%) |
| Total | 137 (100.0%) | 97 (100.0%) |
Real Estate & Mortgages in Whitakers
Real Estate and Mortgage Overview in Whitakers
| Characteristic | Without Mortgage | With Mortgage |
| Housing Units | 51 | 86 |
| Median Property Value | - | - |
| Median Household Income | $25,804 | $0 |
| Monthly Housing Costs | $448 | $0 |
| Real Estate Taxes | $529 | $0 |
Property Value by Mortgage Status in Whitakers
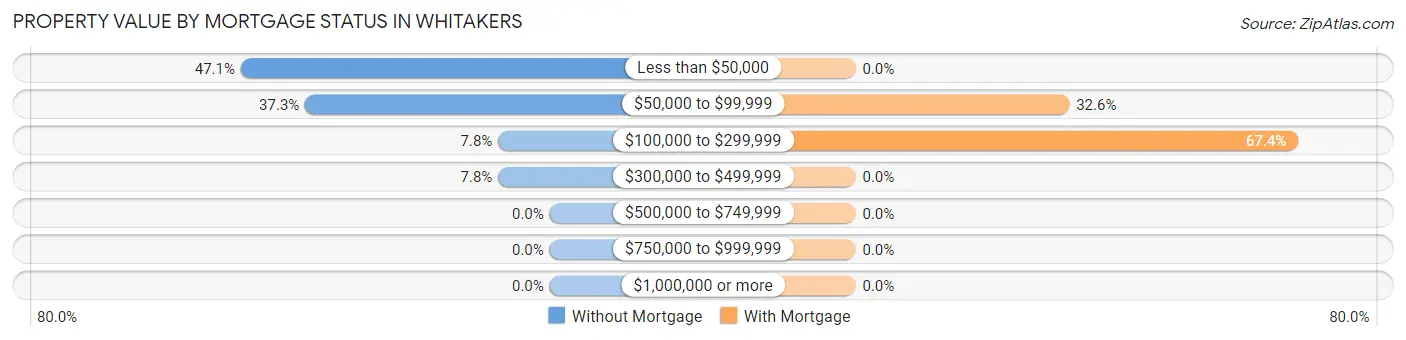
| Property Value | Without Mortgage | With Mortgage |
| Less than $50,000 | 24 (47.1%) | 0 (0.0%) |
| $50,000 to $99,999 | 19 (37.2%) | 28 (32.6%) |
| $100,000 to $299,999 | 4 (7.8%) | 58 (67.4%) |
| $300,000 to $499,999 | 4 (7.8%) | 0 (0.0%) |
| $500,000 to $749,999 | 0 (0.0%) | 0 (0.0%) |
| $750,000 to $999,999 | 0 (0.0%) | 0 (0.0%) |
| $1,000,000 or more | 0 (0.0%) | 0 (0.0%) |
| Total | 51 (100.0%) | 86 (100.0%) |
Household Income by Mortgage Status in Whitakers
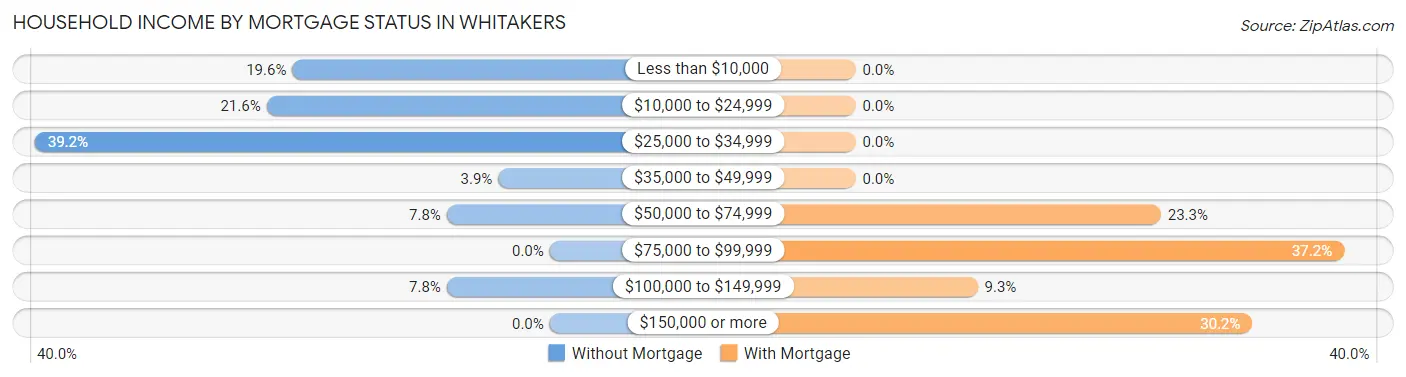
| Household Income | Without Mortgage | With Mortgage |
| Less than $10,000 | 10 (19.6%) | 0 (0.0%) |
| $10,000 to $24,999 | 11 (21.6%) | 0 (0.0%) |
| $25,000 to $34,999 | 20 (39.2%) | 0 (0.0%) |
| $35,000 to $49,999 | 2 (3.9%) | 0 (0.0%) |
| $50,000 to $74,999 | 4 (7.8%) | 20 (23.3%) |
| $75,000 to $99,999 | 0 (0.0%) | 32 (37.2%) |
| $100,000 to $149,999 | 4 (7.8%) | 8 (9.3%) |
| $150,000 or more | 0 (0.0%) | 26 (30.2%) |
| Total | 51 (100.0%) | 86 (100.0%) |
Property Value to Household Income Ratio in Whitakers
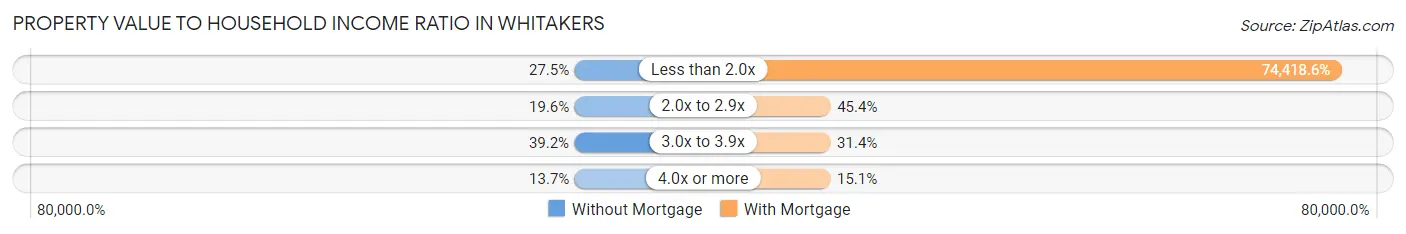
| Value-to-Income Ratio | Without Mortgage | With Mortgage |
| Less than 2.0x | 14 (27.5%) | 64,000 (74,418.6%) |
| 2.0x to 2.9x | 10 (19.6%) | 39 (45.4%) |
| 3.0x to 3.9x | 20 (39.2%) | 27 (31.4%) |
| 4.0x or more | 7 (13.7%) | 13 (15.1%) |
| Total | 51 (100.0%) | 86 (100.0%) |
Real Estate Taxes by Mortgage Status in Whitakers
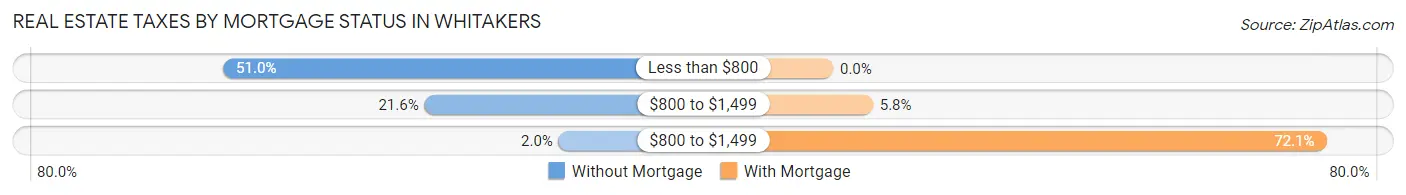
| Property Taxes | Without Mortgage | With Mortgage |
| Less than $800 | 26 (51.0%) | 0 (0.0%) |
| $800 to $1,499 | 11 (21.6%) | 5 (5.8%) |
| $800 to $1,499 | 1 (2.0%) | 62 (72.1%) |
| Total | 51 (100.0%) | 86 (100.0%) |
Health & Disability in Whitakers
Health Insurance Coverage by Age in Whitakers
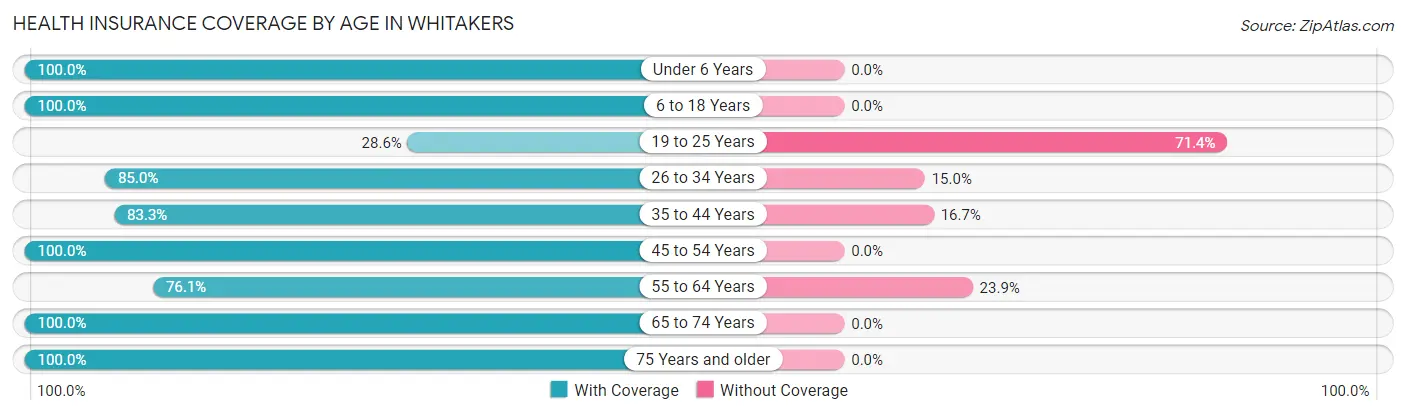
| Age Bracket | With Coverage | Without Coverage |
| Under 6 Years | 62 (100.0%) | 0 (0.0%) |
| 6 to 18 Years | 67 (100.0%) | 0 (0.0%) |
| 19 to 25 Years | 6 (28.6%) | 15 (71.4%) |
| 26 to 34 Years | 85 (85.0%) | 15 (15.0%) |
| 35 to 44 Years | 30 (83.3%) | 6 (16.7%) |
| 45 to 54 Years | 50 (100.0%) | 0 (0.0%) |
| 55 to 64 Years | 54 (76.1%) | 17 (23.9%) |
| 65 to 74 Years | 41 (100.0%) | 0 (0.0%) |
| 75 Years and older | 14 (100.0%) | 0 (0.0%) |
| Total | 409 (88.5%) | 53 (11.5%) |
Health Insurance Coverage by Citizenship Status in Whitakers
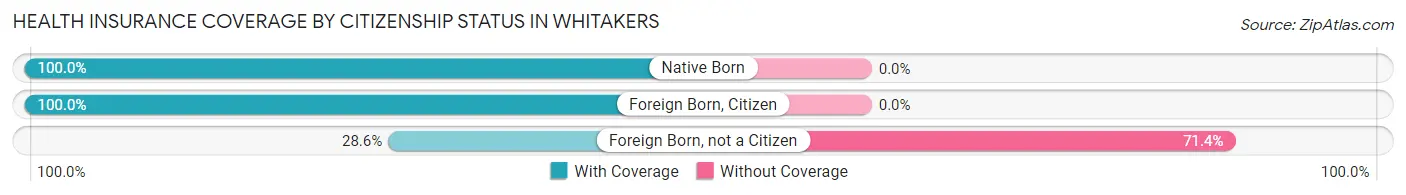
| Citizenship Status | With Coverage | Without Coverage |
| Native Born | 62 (100.0%) | 0 (0.0%) |
| Foreign Born, Citizen | 67 (100.0%) | 0 (0.0%) |
| Foreign Born, not a Citizen | 6 (28.6%) | 15 (71.4%) |
Health Insurance Coverage by Household Income in Whitakers
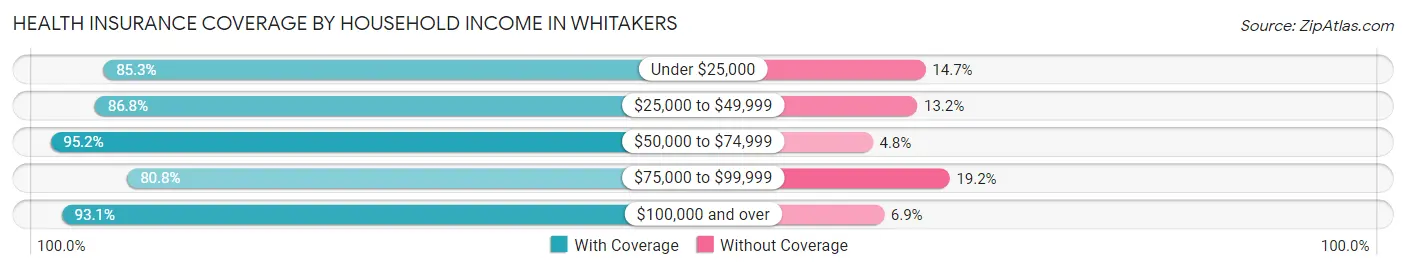
| Household Income | With Coverage | Without Coverage |
| Under $25,000 | 110 (85.3%) | 19 (14.7%) |
| $25,000 to $49,999 | 132 (86.8%) | 20 (13.2%) |
| $50,000 to $74,999 | 79 (95.2%) | 4 (4.8%) |
| $75,000 to $99,999 | 21 (80.8%) | 5 (19.2%) |
| $100,000 and over | 67 (93.1%) | 5 (6.9%) |
Public vs Private Health Insurance Coverage by Age in Whitakers
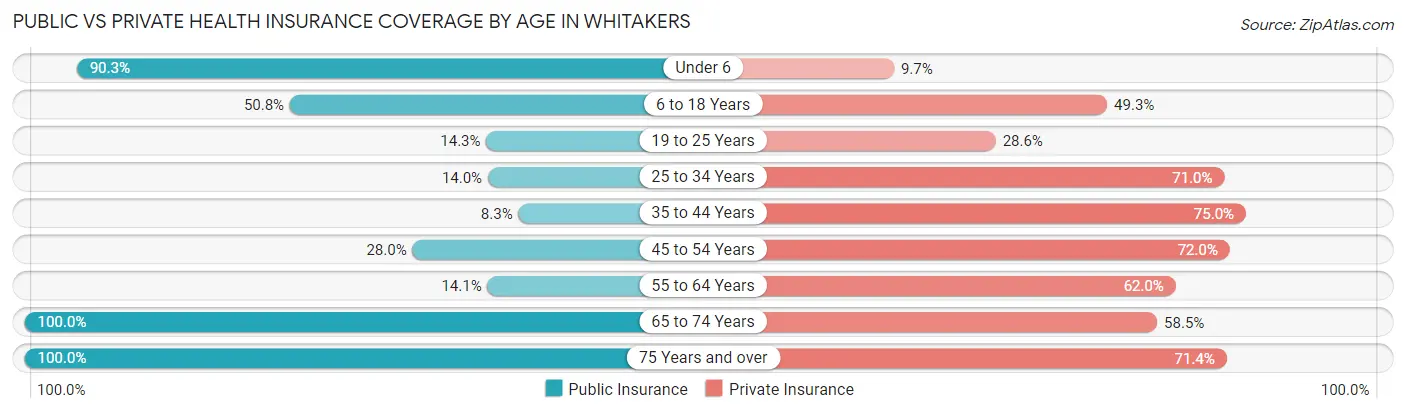
| Age Bracket | Public Insurance | Private Insurance |
| Under 6 | 56 (90.3%) | 6 (9.7%) |
| 6 to 18 Years | 34 (50.7%) | 33 (49.2%) |
| 19 to 25 Years | 3 (14.3%) | 6 (28.6%) |
| 25 to 34 Years | 14 (14.0%) | 71 (71.0%) |
| 35 to 44 Years | 3 (8.3%) | 27 (75.0%) |
| 45 to 54 Years | 14 (28.0%) | 36 (72.0%) |
| 55 to 64 Years | 10 (14.1%) | 44 (62.0%) |
| 65 to 74 Years | 41 (100.0%) | 24 (58.5%) |
| 75 Years and over | 14 (100.0%) | 10 (71.4%) |
| Total | 189 (40.9%) | 257 (55.6%) |
Disability Status by Sex by Age in Whitakers
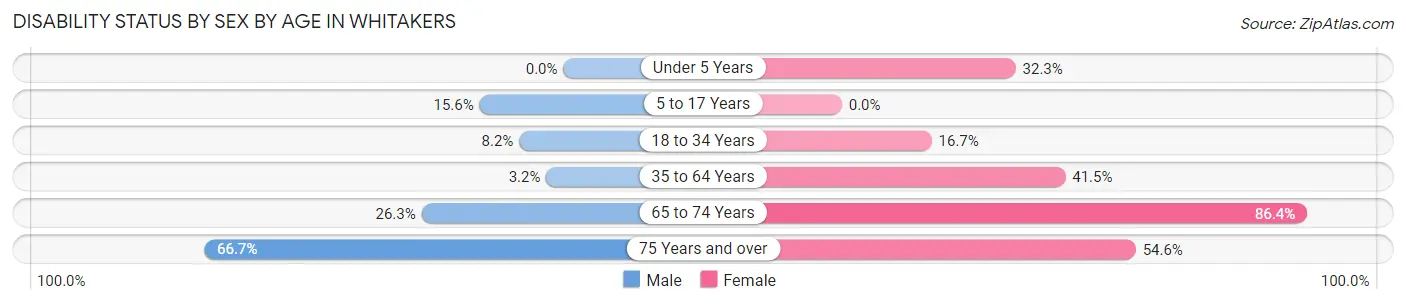
| Age Bracket | Male | Female |
| Under 5 Years | 0 (0.0%) | 10 (32.3%) |
| 5 to 17 Years | 7 (15.6%) | 0 (0.0%) |
| 18 to 34 Years | 5 (8.2%) | 10 (16.7%) |
| 35 to 64 Years | 2 (3.2%) | 39 (41.5%) |
| 65 to 74 Years | 5 (26.3%) | 19 (86.4%) |
| 75 Years and over | 2 (66.7%) | 6 (54.5%) |
Disability Class by Sex by Age in Whitakers
Disability Class: Hearing Difficulty
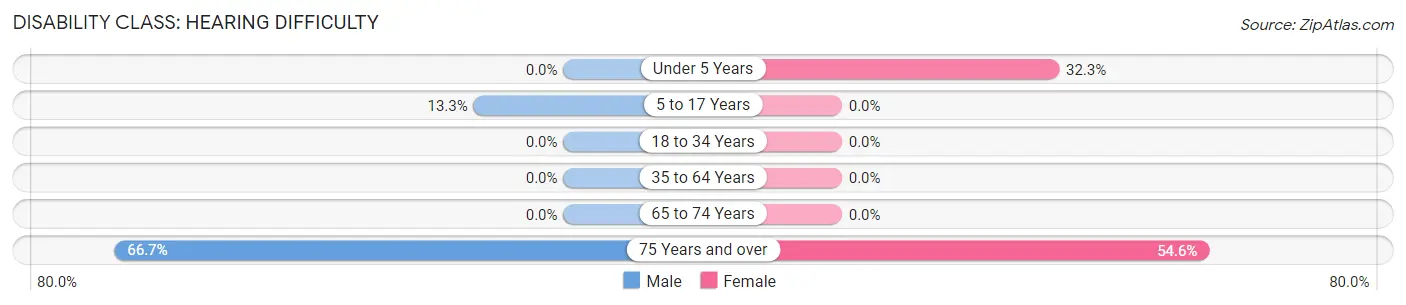
| Age Bracket | Male | Female |
| Under 5 Years | 0 (0.0%) | 10 (32.3%) |
| 5 to 17 Years | 6 (13.3%) | 0 (0.0%) |
| 18 to 34 Years | 0 (0.0%) | 0 (0.0%) |
| 35 to 64 Years | 0 (0.0%) | 0 (0.0%) |
| 65 to 74 Years | 0 (0.0%) | 0 (0.0%) |
| 75 Years and over | 2 (66.7%) | 6 (54.5%) |
Disability Class: Vision Difficulty
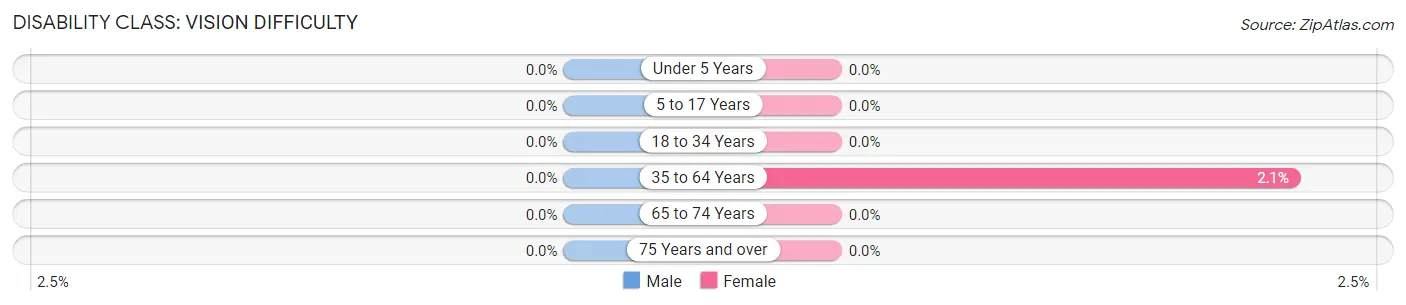
| Age Bracket | Male | Female |
| Under 5 Years | 0 (0.0%) | 0 (0.0%) |
| 5 to 17 Years | 0 (0.0%) | 0 (0.0%) |
| 18 to 34 Years | 0 (0.0%) | 0 (0.0%) |
| 35 to 64 Years | 0 (0.0%) | 2 (2.1%) |
| 65 to 74 Years | 0 (0.0%) | 0 (0.0%) |
| 75 Years and over | 0 (0.0%) | 0 (0.0%) |
Disability Class: Cognitive Difficulty
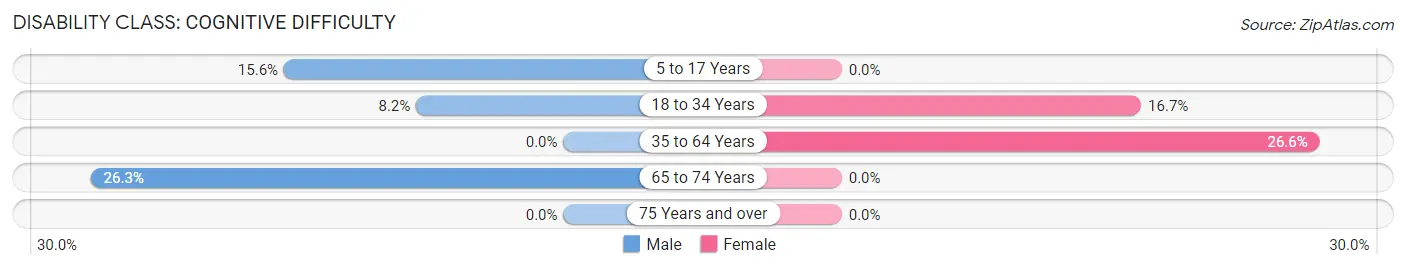
| Age Bracket | Male | Female |
| 5 to 17 Years | 7 (15.6%) | 0 (0.0%) |
| 18 to 34 Years | 5 (8.2%) | 10 (16.7%) |
| 35 to 64 Years | 0 (0.0%) | 25 (26.6%) |
| 65 to 74 Years | 5 (26.3%) | 0 (0.0%) |
| 75 Years and over | 0 (0.0%) | 0 (0.0%) |
Disability Class: Ambulatory Difficulty
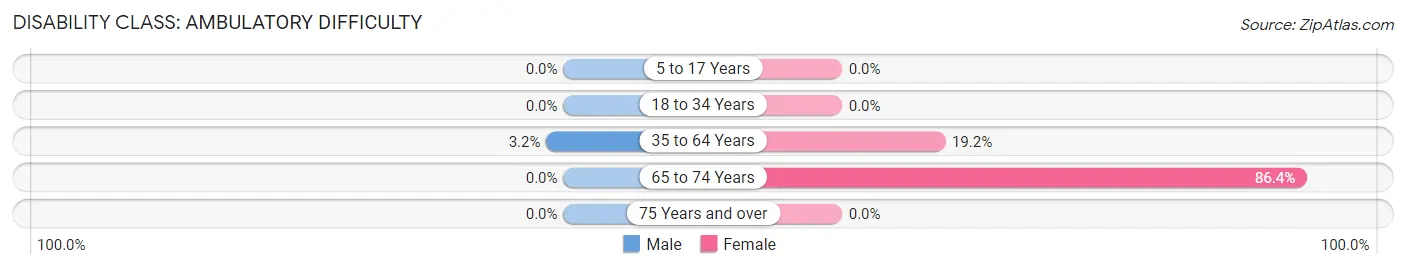
| Age Bracket | Male | Female |
| 5 to 17 Years | 0 (0.0%) | 0 (0.0%) |
| 18 to 34 Years | 0 (0.0%) | 0 (0.0%) |
| 35 to 64 Years | 2 (3.2%) | 18 (19.2%) |
| 65 to 74 Years | 0 (0.0%) | 19 (86.4%) |
| 75 Years and over | 0 (0.0%) | 0 (0.0%) |
Disability Class: Self-Care Difficulty
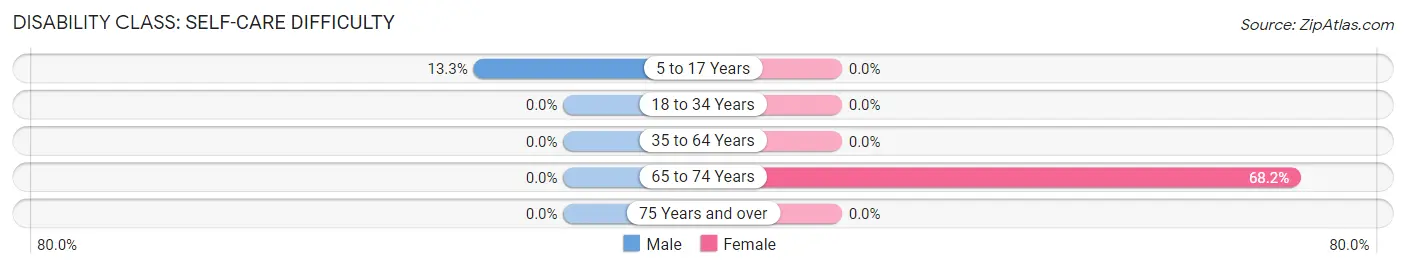
| Age Bracket | Male | Female |
| 5 to 17 Years | 6 (13.3%) | 0 (0.0%) |
| 18 to 34 Years | 0 (0.0%) | 0 (0.0%) |
| 35 to 64 Years | 0 (0.0%) | 0 (0.0%) |
| 65 to 74 Years | 0 (0.0%) | 15 (68.2%) |
| 75 Years and over | 0 (0.0%) | 0 (0.0%) |
Technology Access in Whitakers
Computing Device Access in Whitakers
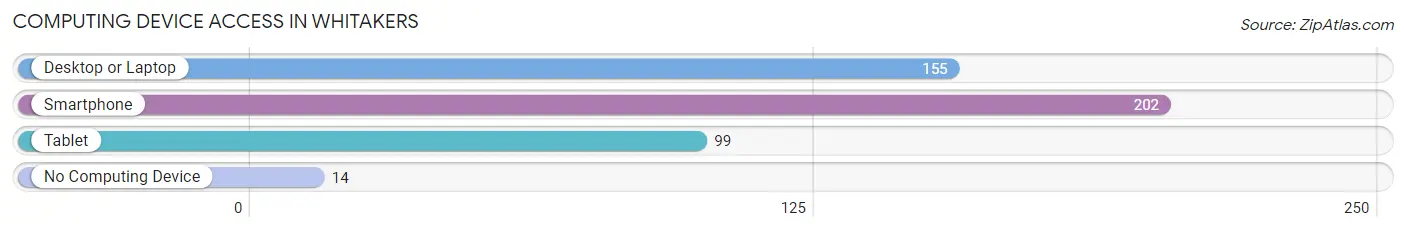
| Device Type | # Households | % Households |
| Desktop or Laptop | 155 | 66.2% |
| Smartphone | 202 | 86.3% |
| Tablet | 99 | 42.3% |
| No Computing Device | 14 | 6.0% |
| Total | 234 | 100.0% |
Internet Access in Whitakers
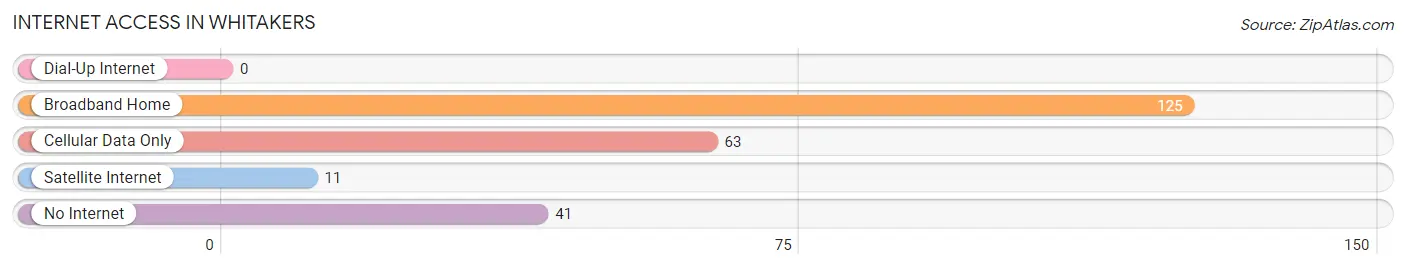
| Internet Type | # Households | % Households |
| Dial-Up Internet | 0 | 0.0% |
| Broadband Home | 125 | 53.4% |
| Cellular Data Only | 63 | 26.9% |
| Satellite Internet | 11 | 4.7% |
| No Internet | 41 | 17.5% |
| Total | 234 | 100.0% |
Whitakers Summary
Whittakers, North Carolina is a small town located in the eastern part of the state. It is situated in the foothills of the Blue Ridge Mountains and is part of the larger metropolitan area of Raleigh-Durham-Chapel Hill. The town has a population of approximately 1,500 people and is known for its rural charm and small-town atmosphere.
History
Whittakers was founded in 1790 by a group of settlers from Virginia. The town was named after the Whittaker family, who were among the first settlers. The town was originally a farming community, but in the late 19th century, the railroad came through and the town began to grow. The railroad brought new industry and jobs to the area, and the town began to thrive.
In the early 20th century, Whittakers was a popular tourist destination, with many people coming to the area to enjoy the scenic beauty of the Blue Ridge Mountains. The town also became known for its furniture industry, with several factories producing high-quality furniture.
Geography
Whittakers is located in the eastern part of North Carolina, in the foothills of the Blue Ridge Mountains. The town is situated in a valley, surrounded by rolling hills and forests. The town is located about 30 miles from Raleigh, the state capital, and about 50 miles from Charlotte.
The climate in Whittakers is mild, with temperatures ranging from the mid-50s in the winter to the mid-80s in the summer. The town receives an average of 45 inches of rain per year, and snowfall is rare.
Economy
Whittakers’ economy is largely based on agriculture and tourism. The town is home to several farms, which produce a variety of crops, including corn, soybeans, and tobacco. The town also has several furniture factories, which produce high-quality furniture for the local market.
Tourism is also an important part of the local economy. The town is home to several historic sites, including the Whittaker House, which was built in 1820 and is now a museum. The town also has several parks and outdoor recreation areas, which attract visitors from all over the region.
Demographics
Whittakers has a population of approximately 1,500 people. The town is predominantly white, with about 90% of the population being Caucasian. The town also has a small African American population, as well as a small Hispanic population. The median household income in Whittakers is $45,000, and the median home value is $150,000.
Whittakers is a small town with a rich history and a unique culture. The town is known for its rural charm and small-town atmosphere, and it is a popular destination for tourists and locals alike. The town has a strong economy, based on agriculture and tourism, and it is home to several historic sites and outdoor recreation areas. Whittakers is a great place to live, work, and visit.
Common Questions
What is Per Capita Income in Whitakers?
Per Capita income in Whitakers is $23,240.
What is the Median Family Income in Whitakers?
Median Family Income in Whitakers is $46,181.
What is the Median Household income in Whitakers?
Median Household Income in Whitakers is $34,375.
What is Income or Wage Gap in Whitakers?
Income or Wage Gap in Whitakers is 36.2%.
Women in Whitakers earn 63.8 cents for every dollar earned by a man.
What is Inequality or Gini Index in Whitakers?
Inequality or Gini Index in Whitakers is 0.43.
What is the Total Population of Whitakers?
Total Population of Whitakers is 462.
What is the Total Male Population of Whitakers?
Total Male Population of Whitakers is 213.
What is the Total Female Population of Whitakers?
Total Female Population of Whitakers is 249.
What is the Ratio of Males per 100 Females in Whitakers?
There are 85.54 Males per 100 Females in Whitakers.
What is the Ratio of Females per 100 Males in Whitakers?
There are 116.90 Females per 100 Males in Whitakers.
What is the Median Population Age in Whitakers?
Median Population Age in Whitakers is 32.8 Years.
What is the Average Family Size in Whitakers
Average Family Size in Whitakers is 2.8 People.
What is the Average Household Size in Whitakers
Average Household Size in Whitakers is 2.0 People.
How Large is the Labor Force in Whitakers?
There are 224 People in the Labor Forcein in Whitakers.
What is the Percentage of People in the Labor Force in Whitakers?
62.9% of People are in the Labor Force in Whitakers.
What is the Unemployment Rate in Whitakers?
Unemployment Rate in Whitakers is 6.7%.