Rich Square, NC Map & Demographics
Rich Square Map
Rich Square Overview
$22,399
PER CAPITA INCOME
$59,712
AVG FAMILY INCOME
$30,972
AVG HOUSEHOLD INCOME
11.7%
WAGE / INCOME GAP [ % ]
88.3¢/ $1
WAGE / INCOME GAP [ $ ]
0.50
INEQUALITY / GINI INDEX
746
TOTAL POPULATION
297
MALE POPULATION
449
FEMALE POPULATION
66.15
MALES / 100 FEMALES
151.18
FEMALES / 100 MALES
62.9
MEDIAN AGE
3.1
AVG FAMILY SIZE
2.0
AVG HOUSEHOLD SIZE
291
LABOR FORCE [ PEOPLE ]
40.9%
PERCENT IN LABOR FORCE
10.0%
UNEMPLOYMENT RATE
Rich Square Zip Codes
Rich Square Area Codes
Income in Rich Square
Income Overview in Rich Square
Per Capita Income in Rich Square is $22,399, while median incomes of families and households are $59,712 and $30,972 respectively.
| Characteristic | Number | Measure |
| Per Capita Income | 746 | $22,399 |
| Median Family Income | 141 | $59,712 |
| Mean Family Income | 141 | $74,128 |
| Median Household Income | 317 | $30,972 |
| Mean Household Income | 317 | $46,177 |
| Income Deficit | 141 | $0 |
| Wage / Income Gap (%) | 746 | 11.68% |
| Wage / Income Gap ($) | 746 | 88.32¢ per $1 |
| Gini / Inequality Index | 746 | 0.50 |
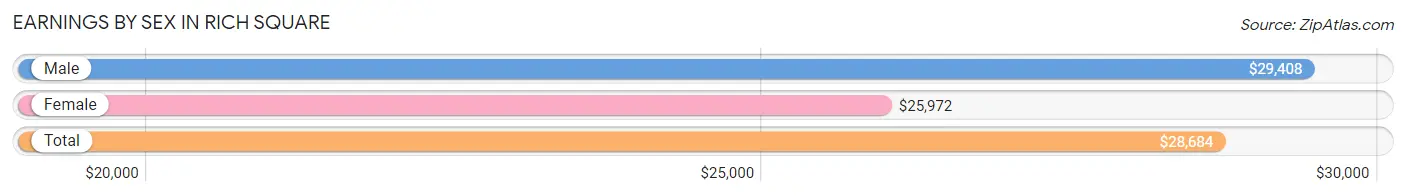
Earnings by Sex in Rich Square
Average Earnings in Rich Square are $28,684, $29,408 for men and $25,972 for women, a difference of 11.7%.
| Sex | Number | Average Earnings |
| Male | 129 (40.6%) | $29,408 |
| Female | 189 (59.4%) | $25,972 |
| Total | 318 (100.0%) | $28,684 |
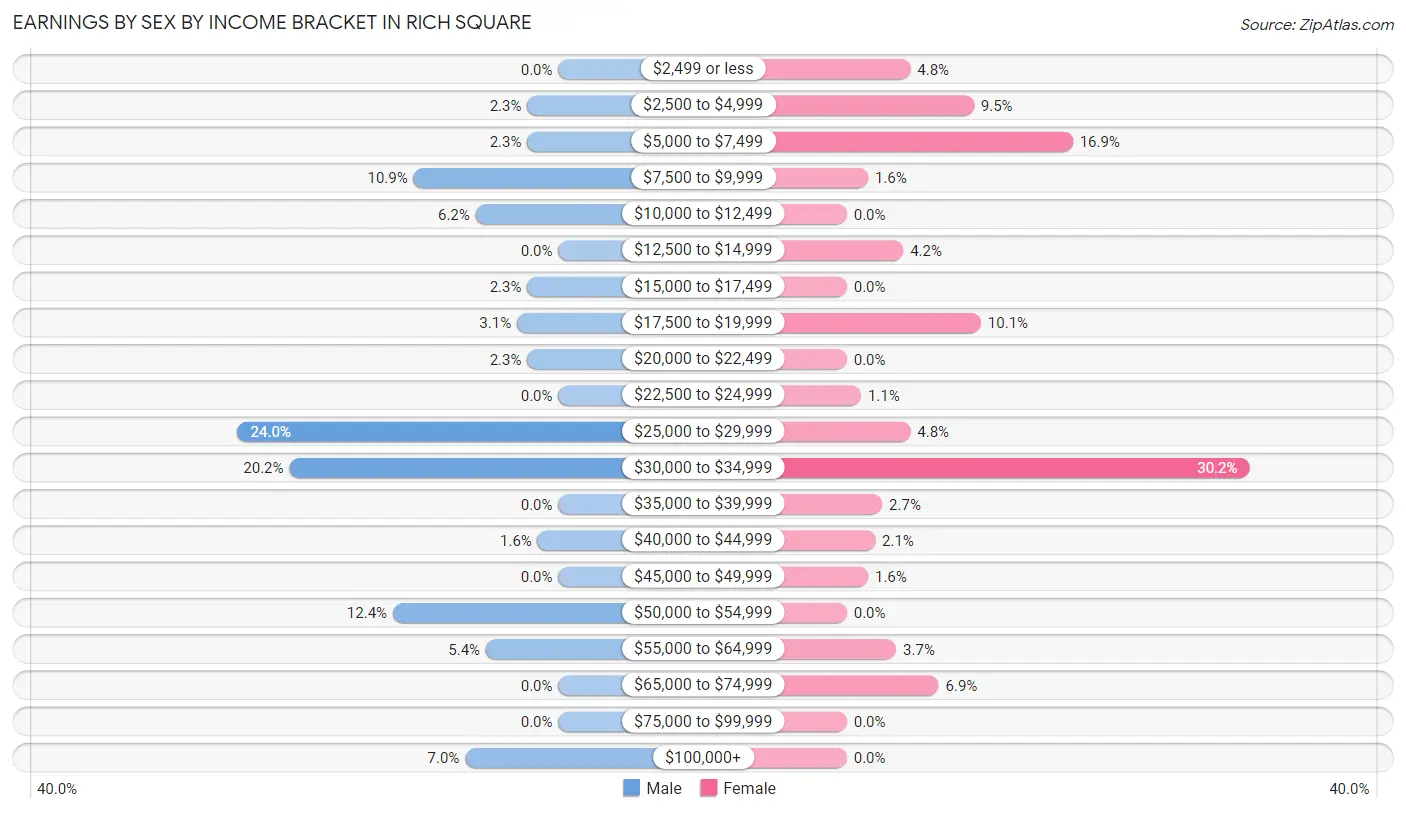
Earnings by Sex by Income Bracket in Rich Square
The most common earnings brackets in Rich Square are $25,000 to $29,999 for men (31 | 24.0%) and $30,000 to $34,999 for women (57 | 30.2%).
| Income | Male | Female |
| $2,499 or less | 0 (0.0%) | 9 (4.8%) |
| $2,500 to $4,999 | 3 (2.3%) | 18 (9.5%) |
| $5,000 to $7,499 | 3 (2.3%) | 32 (16.9%) |
| $7,500 to $9,999 | 14 (10.8%) | 3 (1.6%) |
| $10,000 to $12,499 | 8 (6.2%) | 0 (0.0%) |
| $12,500 to $14,999 | 0 (0.0%) | 8 (4.2%) |
| $15,000 to $17,499 | 3 (2.3%) | 0 (0.0%) |
| $17,500 to $19,999 | 4 (3.1%) | 19 (10.1%) |
| $20,000 to $22,499 | 3 (2.3%) | 0 (0.0%) |
| $22,500 to $24,999 | 0 (0.0%) | 2 (1.1%) |
| $25,000 to $29,999 | 31 (24.0%) | 9 (4.8%) |
| $30,000 to $34,999 | 26 (20.2%) | 57 (30.2%) |
| $35,000 to $39,999 | 0 (0.0%) | 5 (2.6%) |
| $40,000 to $44,999 | 2 (1.5%) | 4 (2.1%) |
| $45,000 to $49,999 | 0 (0.0%) | 3 (1.6%) |
| $50,000 to $54,999 | 16 (12.4%) | 0 (0.0%) |
| $55,000 to $64,999 | 7 (5.4%) | 7 (3.7%) |
| $65,000 to $74,999 | 0 (0.0%) | 13 (6.9%) |
| $75,000 to $99,999 | 0 (0.0%) | 0 (0.0%) |
| $100,000+ | 9 (7.0%) | 0 (0.0%) |
| Total | 129 (100.0%) | 189 (100.0%) |
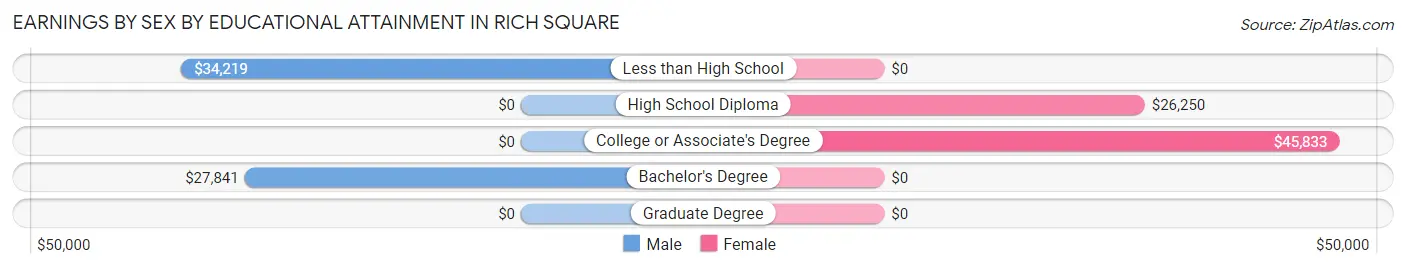
Earnings by Sex by Educational Attainment in Rich Square
Average earnings in Rich Square are $32,644 for men and $32,795 for women, a difference of 0.5%. Men with an educational attainment of less than high school enjoy the highest average annual earnings of $34,219, while those with bachelor's degree education earn the least with $27,841. Women with an educational attainment of college or associate's degree earn the most with the average annual earnings of $45,833, while those with high school diploma education have the smallest earnings of $26,250.
| Educational Attainment | Male Income | Female Income |
| Less than High School | $34,219 | $0 |
| High School Diploma | - | - |
| College or Associate's Degree | - | - |
| Bachelor's Degree | $27,841 | $0 |
| Graduate Degree | - | - |
| Total | $32,644 | $32,795 |
Family Income in Rich Square
Family Income Brackets in Rich Square
According to the Rich Square family income data, there are 42 families falling into the $100,000 to $149,999 income range, which is the most common income bracket and makes up 29.8% of all families.
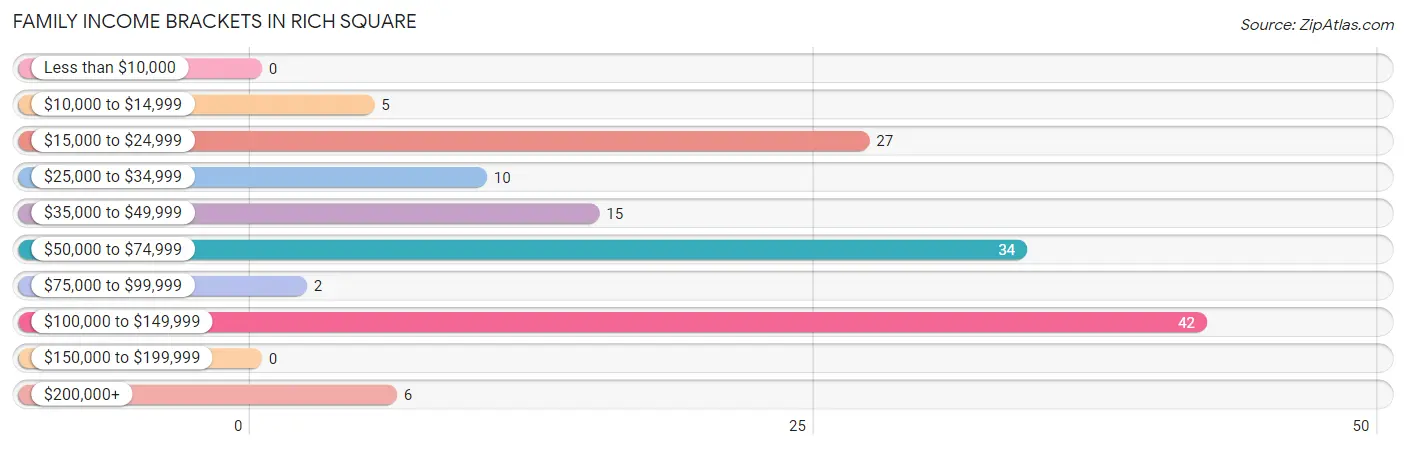
| Income Bracket | # Families | % Families |
| Less than $10,000 | 0 | 0.0% |
| $10,000 to $14,999 | 5 | 3.5% |
| $15,000 to $24,999 | 27 | 19.1% |
| $25,000 to $34,999 | 10 | 7.1% |
| $35,000 to $49,999 | 15 | 10.6% |
| $50,000 to $74,999 | 34 | 24.1% |
| $75,000 to $99,999 | 2 | 1.4% |
| $100,000 to $149,999 | 42 | 29.8% |
| $150,000 to $199,999 | 0 | 0.0% |
| $200,000+ | 6 | 4.3% |
Family Income by Famaliy Size in Rich Square
3-person families (47 | 33.3%) account for the highest median family income in Rich Square with $118,350 per family, while 3-person families (47 | 33.3%) have the highest median income of $39,450 per family member.
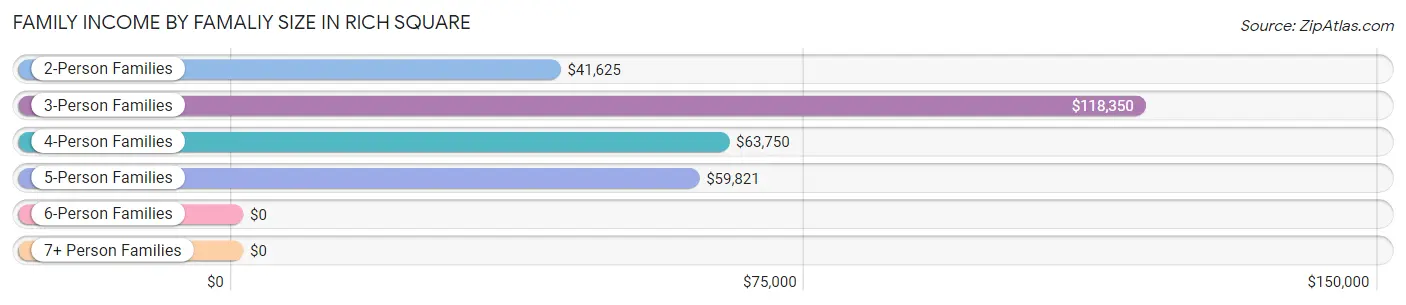
| Income Bracket | # Families | Median Income |
| 2-Person Families | 67 (47.5%) | $41,625 |
| 3-Person Families | 47 (33.3%) | $118,350 |
| 4-Person Families | 7 (5.0%) | $63,750 |
| 5-Person Families | 13 (9.2%) | $59,821 |
| 6-Person Families | 7 (5.0%) | $0 |
| 7+ Person Families | 0 (0.0%) | $0 |
| Total | 141 (100.0%) | $59,712 |
Family Income by Number of Earners in Rich Square
The median family income in Rich Square is $59,712, with families comprising 3+ earners (49) having the highest median family income of $118,350, while families with no earners (17) have the lowest median family income of $29,583, accounting for 34.7% and 12.1% of families, respectively.
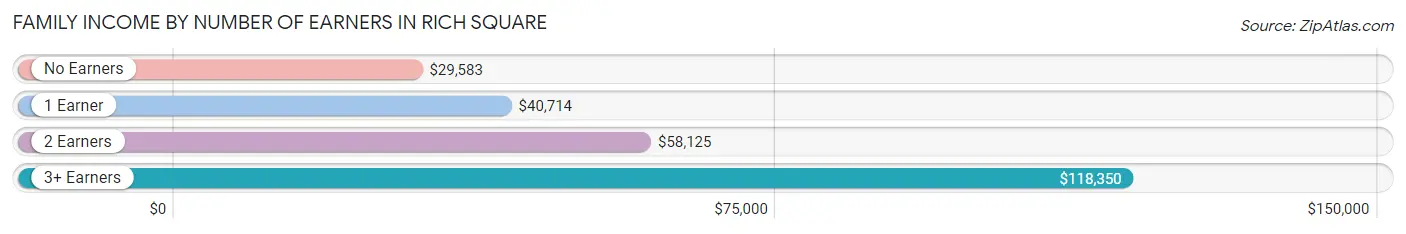
| Number of Earners | # Families | Median Income |
| No Earners | 17 (12.1%) | $29,583 |
| 1 Earner | 56 (39.7%) | $40,714 |
| 2 Earners | 19 (13.5%) | $58,125 |
| 3+ Earners | 49 (34.7%) | $118,350 |
| Total | 141 (100.0%) | $59,712 |
Household Income in Rich Square
Household Income Brackets in Rich Square
With 64 households falling in the category, the $50,000 to $74,999 income range is the most frequent in Rich Square, accounting for 20.2% of all households.
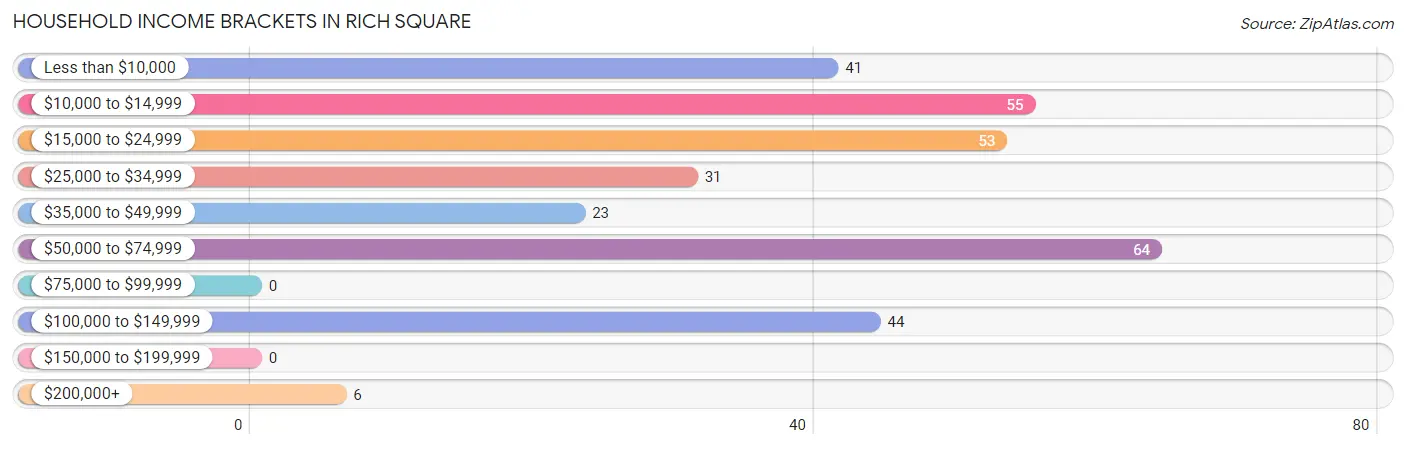
| Income Bracket | # Households | % Households |
| Less than $10,000 | 41 | 12.9% |
| $10,000 to $14,999 | 55 | 17.4% |
| $15,000 to $24,999 | 53 | 16.7% |
| $25,000 to $34,999 | 31 | 9.8% |
| $35,000 to $49,999 | 23 | 7.3% |
| $50,000 to $74,999 | 64 | 20.2% |
| $75,000 to $99,999 | 0 | 0.0% |
| $100,000 to $149,999 | 44 | 13.9% |
| $150,000 to $199,999 | 0 | 0.0% |
| $200,000+ | 6 | 1.9% |
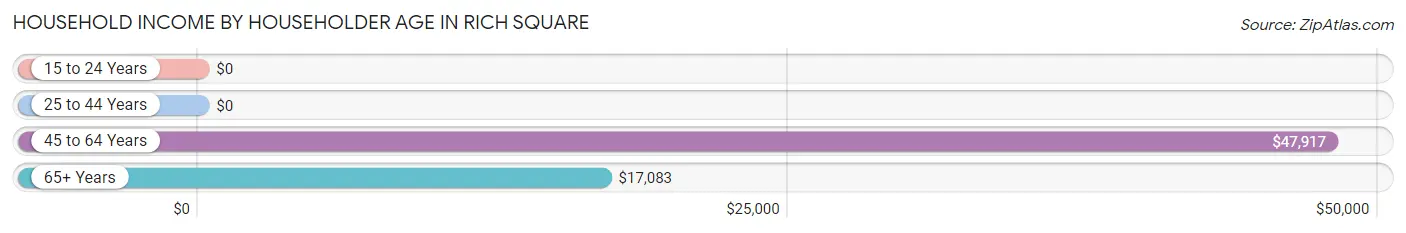
Household Income by Householder Age in Rich Square
The median household income in Rich Square is $30,972, with the highest median household income of $47,917 found in the 45 to 64 years age bracket for the primary householder. A total of 113 households (35.6%) fall into this category. Meanwhile, the 15 to 24 years age bracket for the primary householder has the lowest median household income of $0, with 2 households (0.6%) in this group.
| Income Bracket | # Households | Median Income |
| 15 to 24 Years | 2 (0.6%) | $0 |
| 25 to 44 Years | 32 (10.1%) | $0 |
| 45 to 64 Years | 113 (35.6%) | $47,917 |
| 65+ Years | 170 (53.6%) | $17,083 |
| Total | 317 (100.0%) | $30,972 |
Poverty in Rich Square
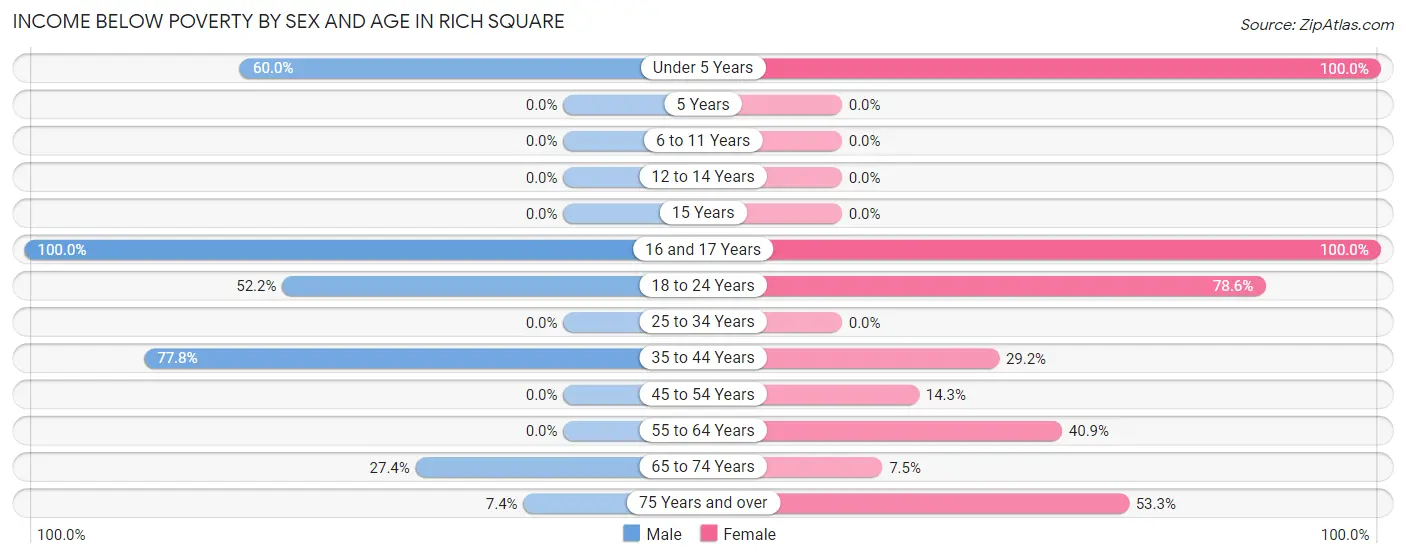
Income Below Poverty by Sex and Age in Rich Square
With 29.2% poverty level for males and 35.4% for females among the residents of Rich Square, 16 and 17 year old males and under 5 year old females are the most vulnerable to poverty, with 22 males (100.0%) and 5 females (100.0%) in their respective age groups living below the poverty level.
| Age Bracket | Male | Female |
| Under 5 Years | 9 (60.0%) | 5 (100.0%) |
| 5 Years | 0 (0.0%) | 0 (0.0%) |
| 6 to 11 Years | 0 (0.0%) | 0 (0.0%) |
| 12 to 14 Years | 0 (0.0%) | 0 (0.0%) |
| 15 Years | 0 (0.0%) | 0 (0.0%) |
| 16 and 17 Years | 22 (100.0%) | 5 (100.0%) |
| 18 to 24 Years | 12 (52.2%) | 22 (78.6%) |
| 25 to 34 Years | 0 (0.0%) | 0 (0.0%) |
| 35 to 44 Years | 14 (77.8%) | 7 (29.2%) |
| 45 to 54 Years | 0 (0.0%) | 9 (14.3%) |
| 55 to 64 Years | 0 (0.0%) | 29 (40.8%) |
| 65 to 74 Years | 17 (27.4%) | 3 (7.5%) |
| 75 Years and over | 2 (7.4%) | 49 (53.3%) |
| Total | 76 (29.2%) | 129 (35.4%) |
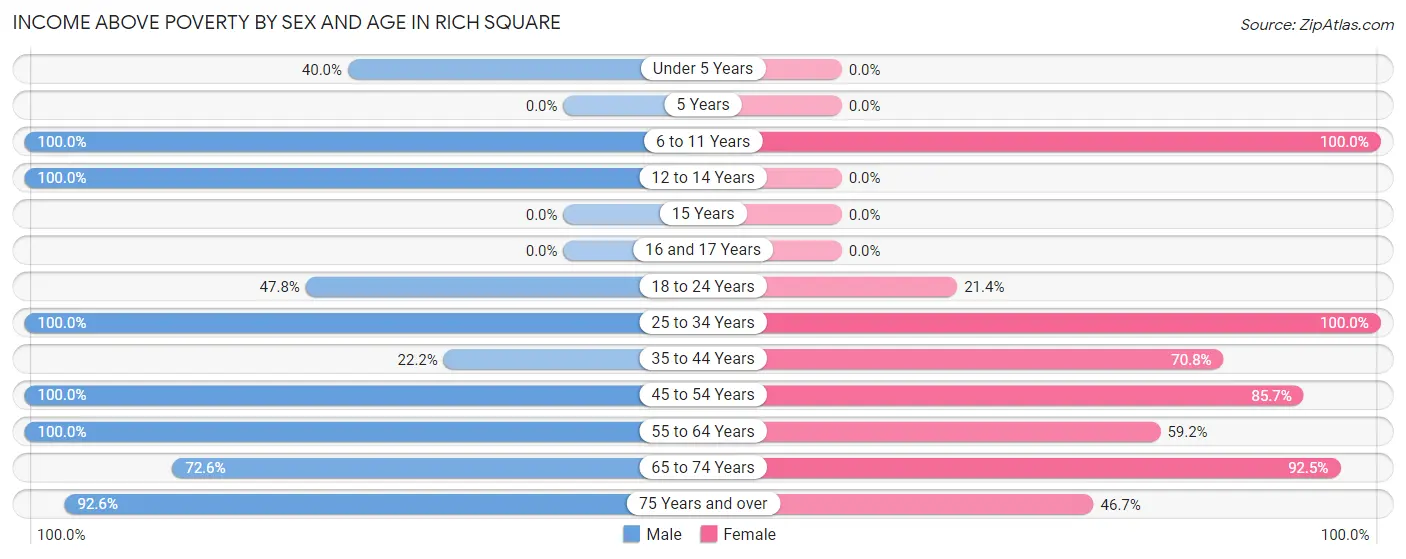
Income Above Poverty by Sex and Age in Rich Square
According to the poverty statistics in Rich Square, males aged 6 to 11 years and females aged 6 to 11 years are the age groups that are most secure financially, with 100.0% of males and 100.0% of females in these age groups living above the poverty line.
| Age Bracket | Male | Female |
| Under 5 Years | 6 (40.0%) | 0 (0.0%) |
| 5 Years | 0 (0.0%) | 0 (0.0%) |
| 6 to 11 Years | 3 (100.0%) | 3 (100.0%) |
| 12 to 14 Years | 8 (100.0%) | 0 (0.0%) |
| 15 Years | 0 (0.0%) | 0 (0.0%) |
| 16 and 17 Years | 0 (0.0%) | 0 (0.0%) |
| 18 to 24 Years | 11 (47.8%) | 6 (21.4%) |
| 25 to 34 Years | 4 (100.0%) | 33 (100.0%) |
| 35 to 44 Years | 4 (22.2%) | 17 (70.8%) |
| 45 to 54 Years | 37 (100.0%) | 54 (85.7%) |
| 55 to 64 Years | 41 (100.0%) | 42 (59.2%) |
| 65 to 74 Years | 45 (72.6%) | 37 (92.5%) |
| 75 Years and over | 25 (92.6%) | 43 (46.7%) |
| Total | 184 (70.8%) | 235 (64.6%) |
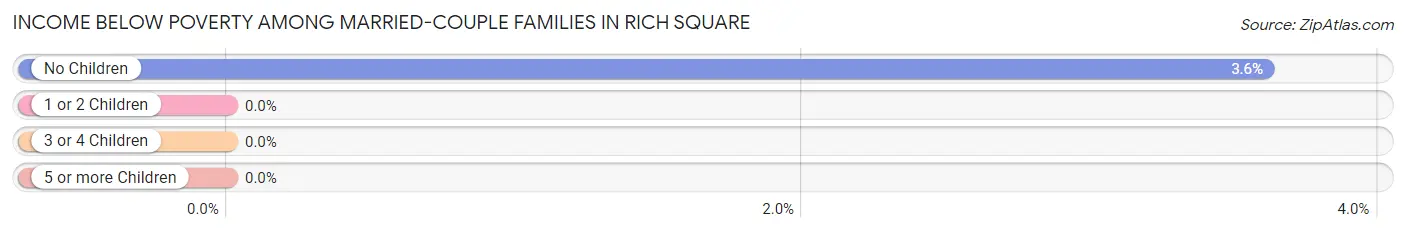
Income Below Poverty Among Married-Couple Families in Rich Square
The poverty statistics for married-couple families in Rich Square show that 3.0% or 3 of the total 100 families live below the poverty line. Families with no children have the highest poverty rate of 3.6%, comprising of 3 families. On the other hand, families with 1 or 2 children have the lowest poverty rate of 0.0%, which includes 0 families.
| Children | Above Poverty | Below Poverty |
| No Children | 80 (96.4%) | 3 (3.6%) |
| 1 or 2 Children | 17 (100.0%) | 0 (0.0%) |
| 3 or 4 Children | 0 (0.0%) | 0 (0.0%) |
| 5 or more Children | 0 (0.0%) | 0 (0.0%) |
| Total | 97 (97.0%) | 3 (3.0%) |
Income Below Poverty Among Single-Parent Households in Rich Square
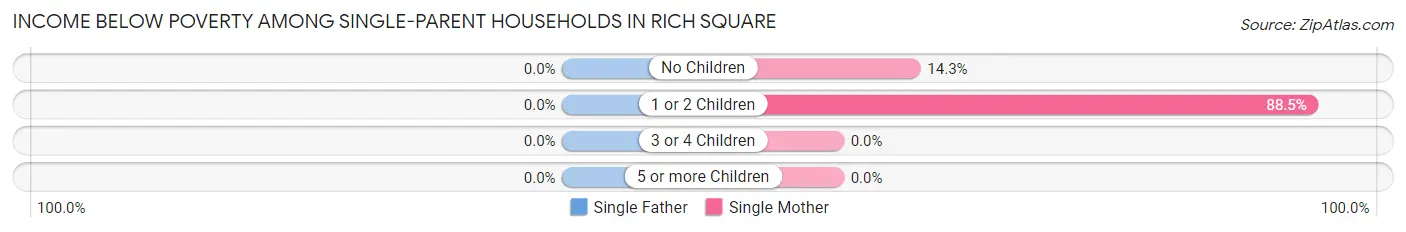
| Children | Single Father | Single Mother |
| No Children | 0 (0.0%) | 2 (14.3%) |
| 1 or 2 Children | 0 (0.0%) | 23 (88.5%) |
| 3 or 4 Children | 0 (0.0%) | 0 (0.0%) |
| 5 or more Children | 0 (0.0%) | 0 (0.0%) |
| Total | 0 (0.0%) | 25 (62.5%) |
Income Below Poverty Among Married-Couple vs Single-Parent Households in Rich Square
The poverty data for Rich Square shows that 3 of the married-couple family households (3.0%) and 25 of the single-parent households (61.0%) are living below the poverty level. Within the married-couple family households, those with no children have the highest poverty rate, with 3 households (3.6%) falling below the poverty line. Among the single-parent households, those with 1 or 2 children have the highest poverty rate, with 23 household (88.5%) living below poverty.
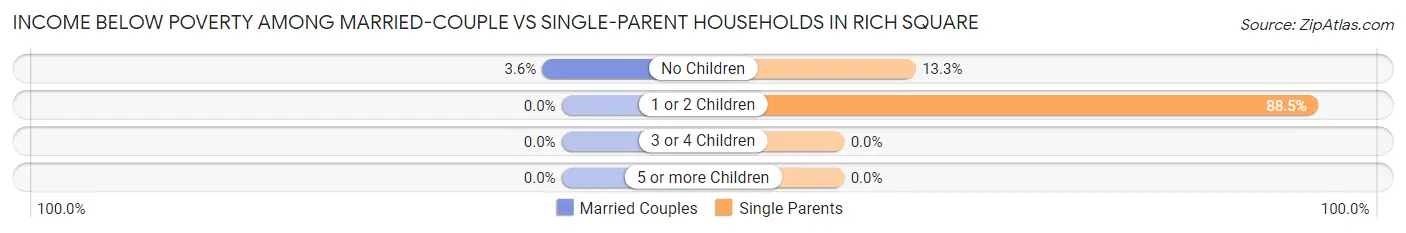
| Children | Married-Couple Families | Single-Parent Households |
| No Children | 3 (3.6%) | 2 (13.3%) |
| 1 or 2 Children | 0 (0.0%) | 23 (88.5%) |
| 3 or 4 Children | 0 (0.0%) | 0 (0.0%) |
| 5 or more Children | 0 (0.0%) | 0 (0.0%) |
| Total | 3 (3.0%) | 25 (61.0%) |
Race in Rich Square
The most populous races in Rich Square are Black / African American (449 | 60.2%), White / Caucasian (276 | 37.0%), and Asian (9 | 1.2%).
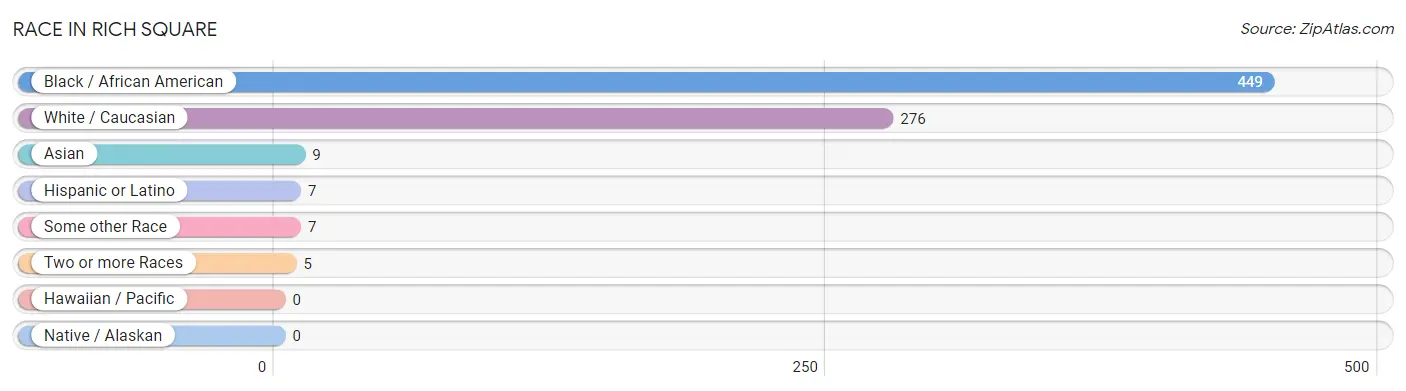
| Race | # Population | % Population |
| Asian | 9 | 1.2% |
| Black / African American | 449 | 60.2% |
| Hawaiian / Pacific | 0 | 0.0% |
| Hispanic or Latino | 7 | 0.9% |
| Native / Alaskan | 0 | 0.0% |
| White / Caucasian | 276 | 37.0% |
| Two or more Races | 5 | 0.7% |
| Some other Race | 7 | 0.9% |
| Total | 746 | 100.0% |
Ancestry in Rich Square
The most populous ancestries reported in Rich Square are American (131 | 17.6%), Irish (27 | 3.6%), English (23 | 3.1%), Greek (16 | 2.1%), and German (13 | 1.7%), together accounting for 28.1% of all Rich Square residents.
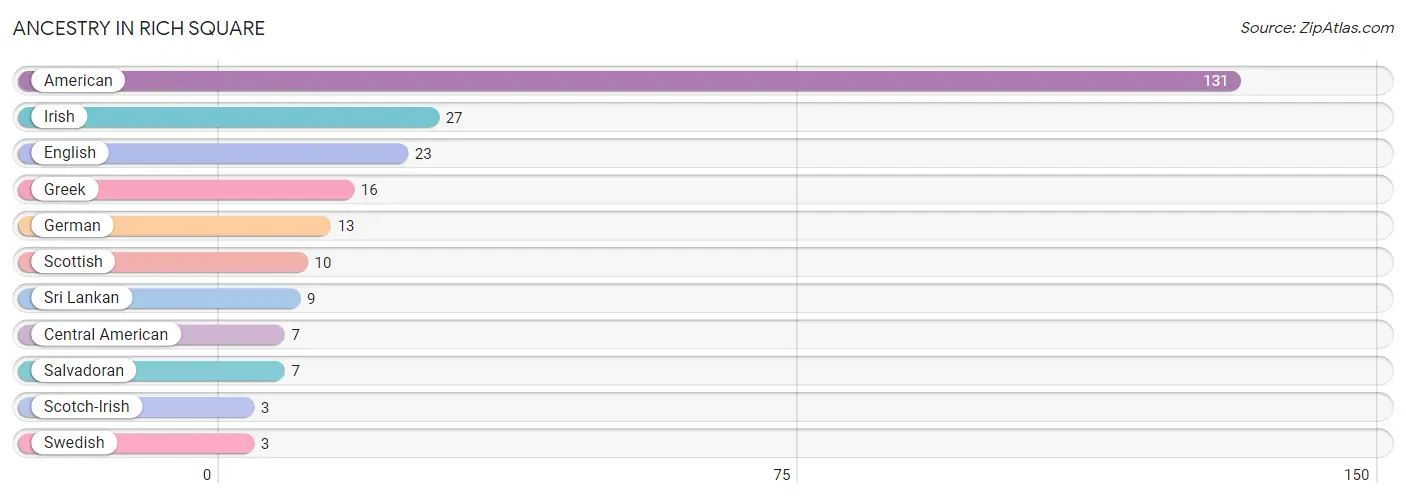
| Ancestry | # Population | % Population |
| American | 131 | 17.6% |
| Central American | 7 | 0.9% |
| English | 23 | 3.1% |
| German | 13 | 1.7% |
| Greek | 16 | 2.1% |
| Irish | 27 | 3.6% |
| Salvadoran | 7 | 0.9% |
| Scotch-Irish | 3 | 0.4% |
| Scottish | 10 | 1.3% |
| Sri Lankan | 9 | 1.2% |
| Swedish | 3 | 0.4% | View All 11 Rows |
Immigrants in Rich Square
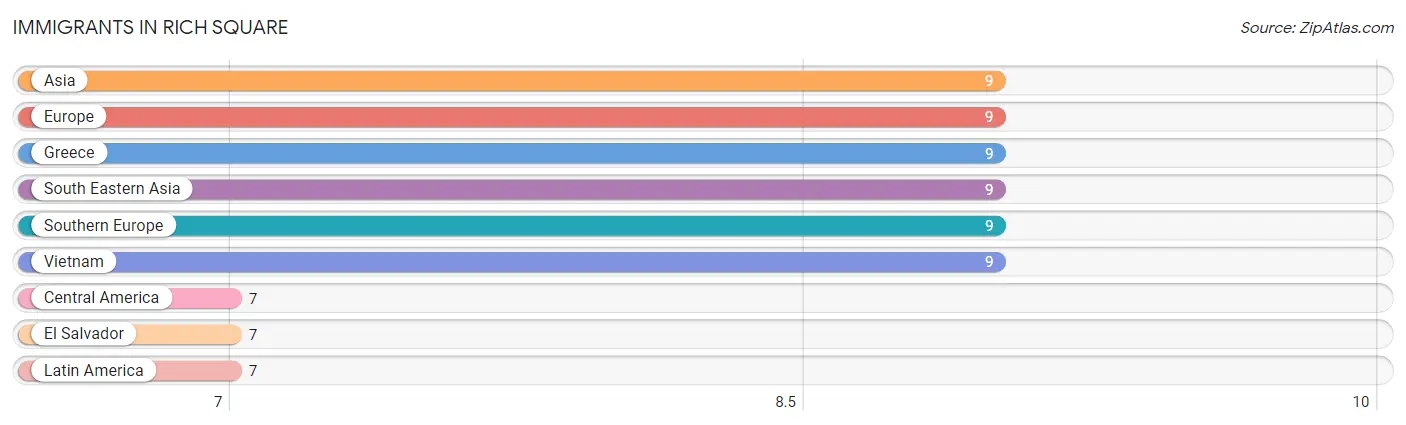
The most numerous immigrant groups reported in Rich Square came from Asia (9 | 1.2%), Europe (9 | 1.2%), Greece (9 | 1.2%), South Eastern Asia (9 | 1.2%), and Southern Europe (9 | 1.2%), together accounting for 6.0% of all Rich Square residents.
| Immigration Origin | # Population | % Population |
| Asia | 9 | 1.2% |
| Central America | 7 | 0.9% |
| El Salvador | 7 | 0.9% |
| Europe | 9 | 1.2% |
| Greece | 9 | 1.2% |
| Latin America | 7 | 0.9% |
| South Eastern Asia | 9 | 1.2% |
| Southern Europe | 9 | 1.2% |
| Vietnam | 9 | 1.2% | View All 9 Rows |
Sex and Age in Rich Square
Sex and Age in Rich Square
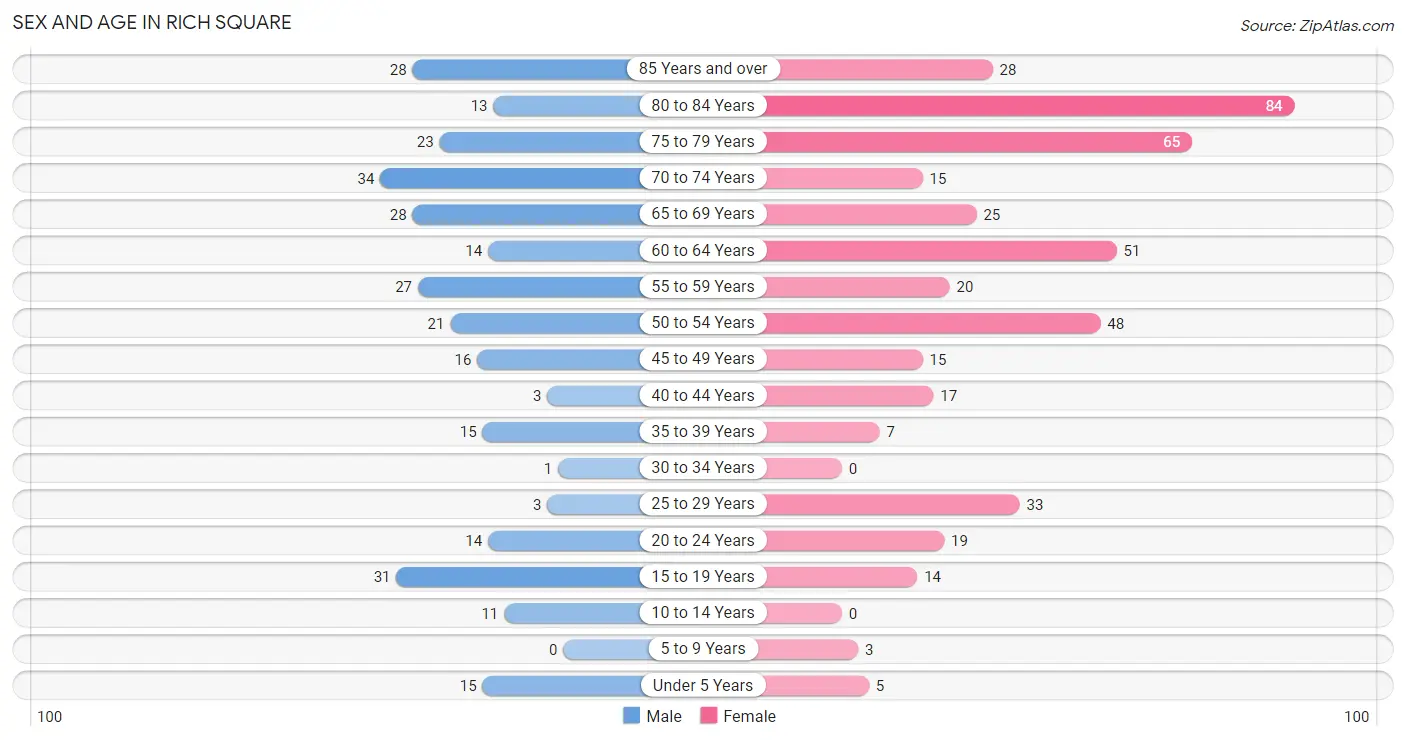
The most populous age groups in Rich Square are 70 to 74 Years (34 | 11.5%) for men and 80 to 84 Years (84 | 18.7%) for women.
| Age Bracket | Male | Female |
| Under 5 Years | 15 (5.1%) | 5 (1.1%) |
| 5 to 9 Years | 0 (0.0%) | 3 (0.7%) |
| 10 to 14 Years | 11 (3.7%) | 0 (0.0%) |
| 15 to 19 Years | 31 (10.4%) | 14 (3.1%) |
| 20 to 24 Years | 14 (4.7%) | 19 (4.2%) |
| 25 to 29 Years | 3 (1.0%) | 33 (7.3%) |
| 30 to 34 Years | 1 (0.3%) | 0 (0.0%) |
| 35 to 39 Years | 15 (5.1%) | 7 (1.6%) |
| 40 to 44 Years | 3 (1.0%) | 17 (3.8%) |
| 45 to 49 Years | 16 (5.4%) | 15 (3.3%) |
| 50 to 54 Years | 21 (7.1%) | 48 (10.7%) |
| 55 to 59 Years | 27 (9.1%) | 20 (4.4%) |
| 60 to 64 Years | 14 (4.7%) | 51 (11.4%) |
| 65 to 69 Years | 28 (9.4%) | 25 (5.6%) |
| 70 to 74 Years | 34 (11.5%) | 15 (3.3%) |
| 75 to 79 Years | 23 (7.7%) | 65 (14.5%) |
| 80 to 84 Years | 13 (4.4%) | 84 (18.7%) |
| 85 Years and over | 28 (9.4%) | 28 (6.2%) |
| Total | 297 (100.0%) | 449 (100.0%) |
Families and Households in Rich Square
Median Family Size in Rich Square
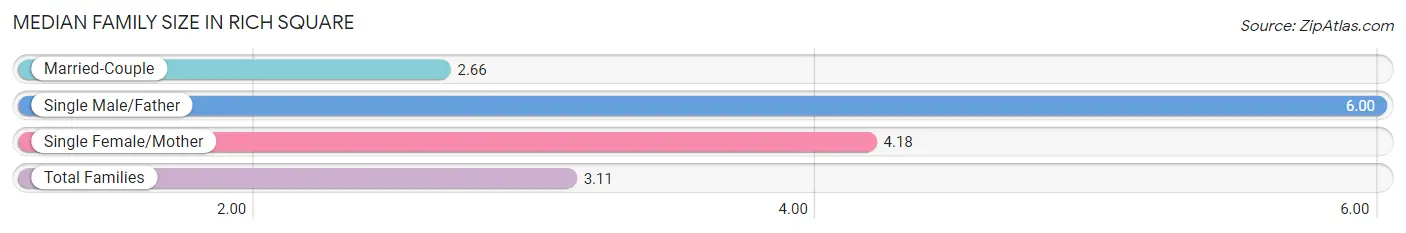
The median family size in Rich Square is 3.11 persons per family, with single male/father families (1 | 0.7%) accounting for the largest median family size of 6 persons per family. On the other hand, married-couple families (100 | 70.9%) represent the smallest median family size with 2.66 persons per family.
| Family Type | # Families | Family Size |
| Married-Couple | 100 (70.9%) | 2.66 |
| Single Male/Father | 1 (0.7%) | 6.00 |
| Single Female/Mother | 40 (28.4%) | 4.18 |
| Total Families | 141 (100.0%) | 3.11 |
Median Household Size in Rich Square
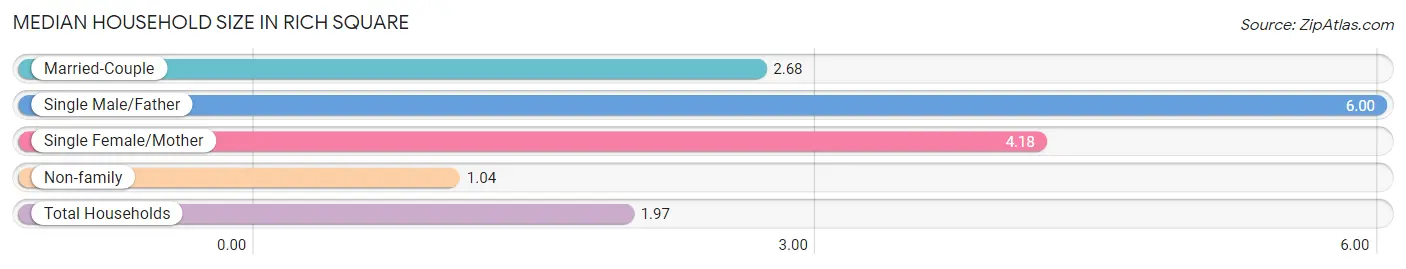
The median household size in Rich Square is 1.97 persons per household, with single male/father households (1 | 0.3%) accounting for the largest median household size of 6 persons per household. non-family households (176 | 55.5%) represent the smallest median household size with 1.04 persons per household.
| Household Type | # Households | Household Size |
| Married-Couple | 100 (31.6%) | 2.68 |
| Single Male/Father | 1 (0.3%) | 6.00 |
| Single Female/Mother | 40 (12.6%) | 4.18 |
| Non-family | 176 (55.5%) | 1.04 |
| Total Households | 317 (100.0%) | 1.97 |
Household Size by Marriage Status in Rich Square
Out of a total of 317 households in Rich Square, 141 (44.5%) are family households, while 176 (55.5%) are nonfamily households. The most numerous type of family households are 2-person households, comprising 67, and the most common type of nonfamily households are 1-person households, comprising 170.
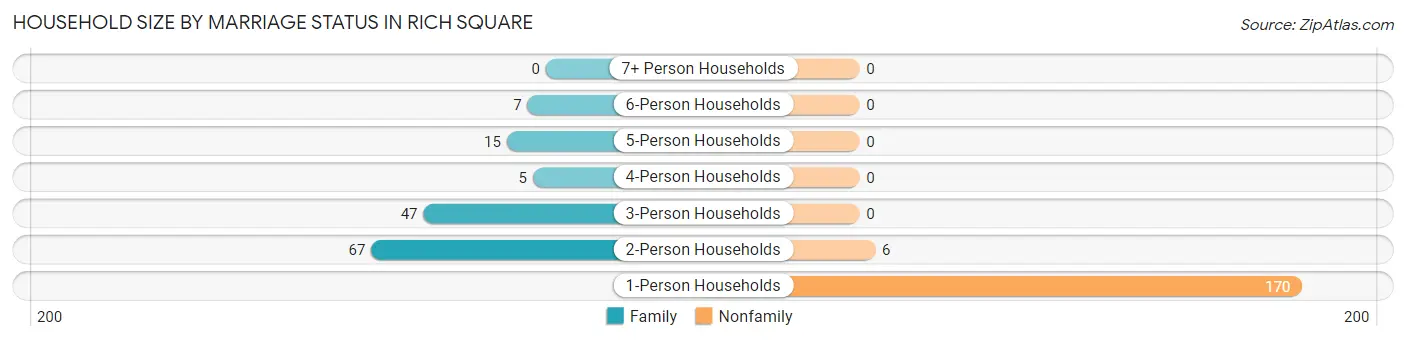
| Household Size | Family Households | Nonfamily Households |
| 1-Person Households | - | 170 (53.6%) |
| 2-Person Households | 67 (21.1%) | 6 (1.9%) |
| 3-Person Households | 47 (14.8%) | 0 (0.0%) |
| 4-Person Households | 5 (1.6%) | 0 (0.0%) |
| 5-Person Households | 15 (4.7%) | 0 (0.0%) |
| 6-Person Households | 7 (2.2%) | 0 (0.0%) |
| 7+ Person Households | 0 (0.0%) | 0 (0.0%) |
| Total | 141 (44.5%) | 176 (55.5%) |
Female Fertility in Rich Square
Fertility by Age in Rich Square
| Age Bracket | Women with Births | Births / 1,000 Women |
| 15 to 19 years | 0 (0.0%) | 0.0 |
| 20 to 34 years | 0 (0.0%) | 0.0 |
| 35 to 50 years | 0 (0.0%) | 0.0 |
| Total | 0 (0.0%) | 0.0 |
Fertility by Age by Marriage Status in Rich Square
| Age Bracket | Married | Unmarried |
| 15 to 19 years | 0 (0.0%) | 0 (0.0%) |
| 20 to 34 years | 0 (0.0%) | 0 (0.0%) |
| 35 to 50 years | 0 (0.0%) | 0 (0.0%) |
| Total | 0 (0.0%) | 0 (0.0%) |
Fertility by Education in Rich Square
| Educational Attainment | Women with Births | Births / 1,000 Women |
| Less than High School | 0 (0.0%) | 0.0 |
| High School Diploma | 0 (0.0%) | 0.0 |
| College or Associate's Degree | 0 (0.0%) | 0.0 |
| Bachelor's Degree | 0 (0.0%) | 0.0 |
| Graduate Degree | 0 (0.0%) | 0.0 |
| Total | 0 (0.0%) | 0.0 |
Fertility by Education by Marriage Status in Rich Square
| Educational Attainment | Married | Unmarried |
| Less than High School | 0 (0.0%) | 0 (0.0%) |
| High School Diploma | 0 (0.0%) | 0 (0.0%) |
| College or Associate's Degree | 0 (0.0%) | 0 (0.0%) |
| Bachelor's Degree | 0 (0.0%) | 0 (0.0%) |
| Graduate Degree | 0 (0.0%) | 0 (0.0%) |
| Total | 0 (0.0%) | 0 (0.0%) |
Employment Characteristics in Rich Square
Employment by Class of Employer in Rich Square
Among the 252 employed individuals in Rich Square, private company employees (181 | 71.8%), self-employed (not incorporated) (39 | 15.5%), and local government employees (14 | 5.6%) make up the most common classes of employment.
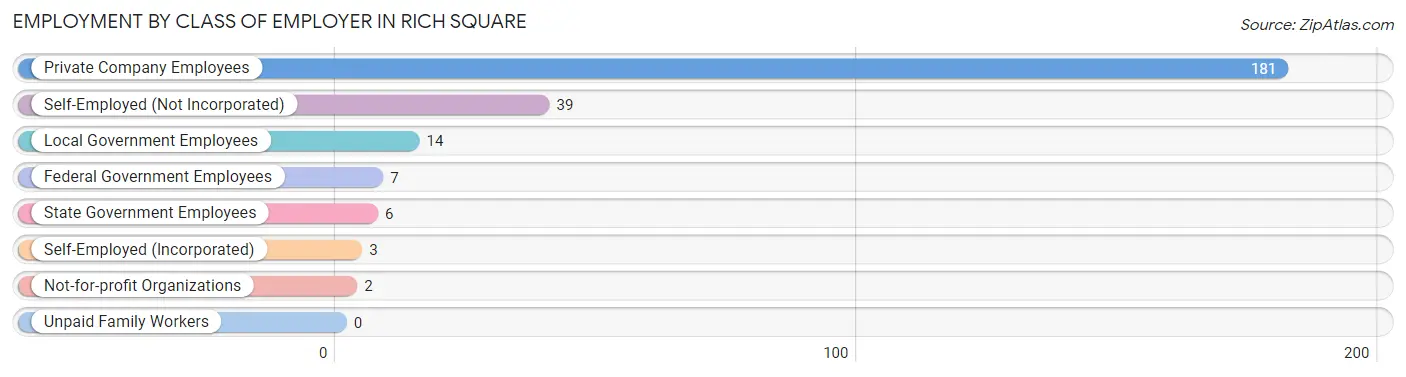
| Employer Class | # Employees | % Employees |
| Private Company Employees | 181 | 71.8% |
| Self-Employed (Incorporated) | 3 | 1.2% |
| Self-Employed (Not Incorporated) | 39 | 15.5% |
| Not-for-profit Organizations | 2 | 0.8% |
| Local Government Employees | 14 | 5.6% |
| State Government Employees | 6 | 2.4% |
| Federal Government Employees | 7 | 2.8% |
| Unpaid Family Workers | 0 | 0.0% |
| Total | 252 | 100.0% |
Employment Status by Age in Rich Square
According to the labor force statistics for Rich Square, out of the total population over 16 years of age (712), 40.9% or 291 individuals are in the labor force, with 10.0% or 29 of them unemployed. The age group with the highest labor force participation rate is 25 to 29 years, with 100.0% or 36 individuals in the labor force. Within the labor force, the 35 to 44 years age range has the highest percentage of unemployed individuals, with 62.9% or 22 of them being unemployed.
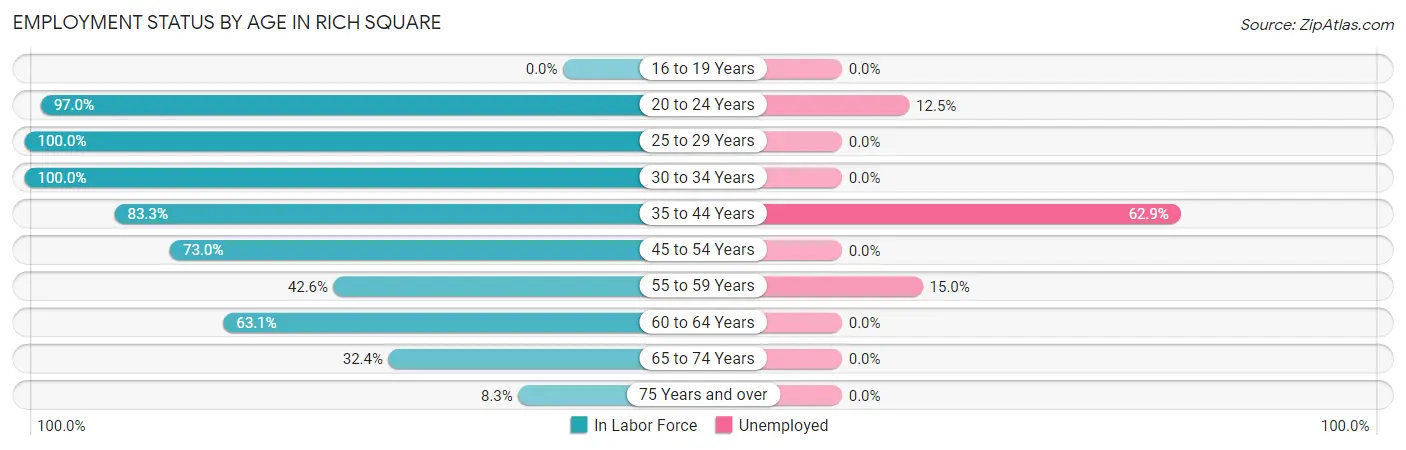
| Age Bracket | In Labor Force | Unemployed |
| 16 to 19 Years | 0 (0.0%) | 0 (0.0%) |
| 20 to 24 Years | 32 (97.0%) | 4 (12.5%) |
| 25 to 29 Years | 36 (100.0%) | 0 (0.0%) |
| 30 to 34 Years | 1 (100.0%) | 0 (0.0%) |
| 35 to 44 Years | 35 (83.3%) | 22 (62.9%) |
| 45 to 54 Years | 73 (73.0%) | 0 (0.0%) |
| 55 to 59 Years | 20 (42.6%) | 3 (15.0%) |
| 60 to 64 Years | 41 (63.1%) | 0 (0.0%) |
| 65 to 74 Years | 33 (32.4%) | 0 (0.0%) |
| 75 Years and over | 20 (8.3%) | 0 (0.0%) |
| Total | 291 (40.9%) | 29 (10.0%) |
Employment Status by Educational Attainment in Rich Square
According to labor force statistics for Rich Square, 70.8% of individuals (206) out of the total population between 25 and 64 years of age (291) are in the labor force, with 12.1% or 25 of them being unemployed. The group with the highest labor force participation rate are those with the educational attainment of bachelor's degree or higher, with 76.6% or 36 individuals in the labor force. Within the labor force, individuals with high school diploma education have the highest percentage of unemployment, with 23.2% or 22 of them being unemployed.
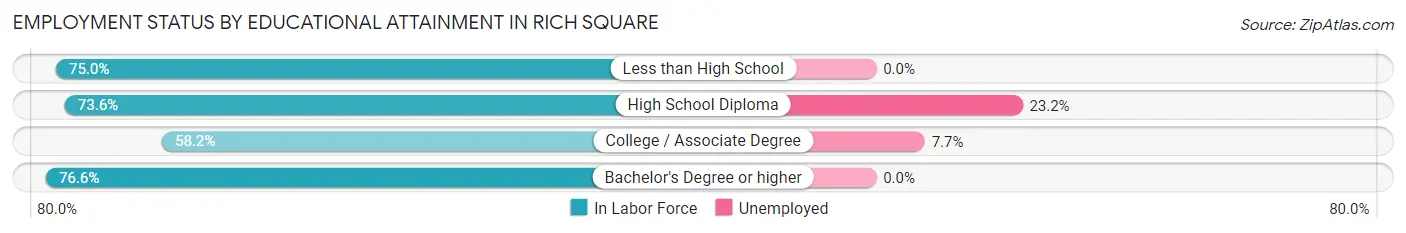
| Educational Attainment | In Labor Force | Unemployed |
| Less than High School | 36 (75.0%) | 0 (0.0%) |
| High School Diploma | 95 (73.6%) | 30 (23.2%) |
| College / Associate Degree | 39 (58.2%) | 5 (7.7%) |
| Bachelor's Degree or higher | 36 (76.6%) | 0 (0.0%) |
| Total | 206 (70.8%) | 35 (12.1%) |
Employment Occupations by Sex in Rich Square
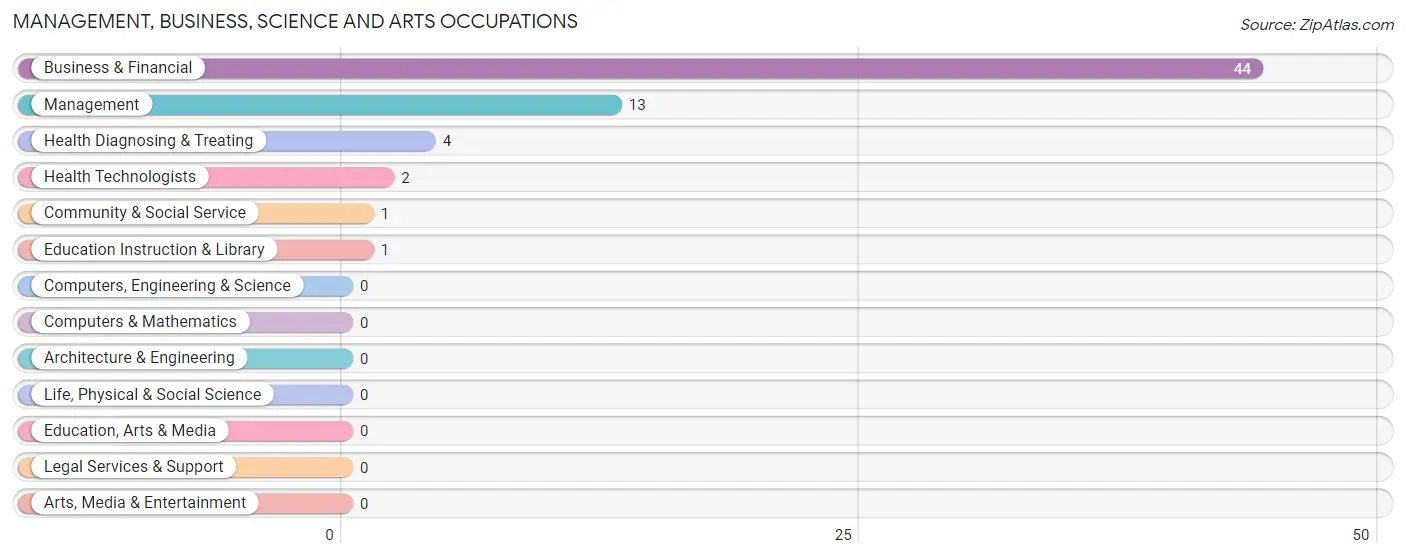
Management, Business, Science and Arts Occupations
The most common Management, Business, Science and Arts occupations in Rich Square are Business & Financial (44 | 16.8%), Management (13 | 5.0%), Health Diagnosing & Treating (4 | 1.5%), Health Technologists (2 | 0.8%), and Community & Social Service (1 | 0.4%).
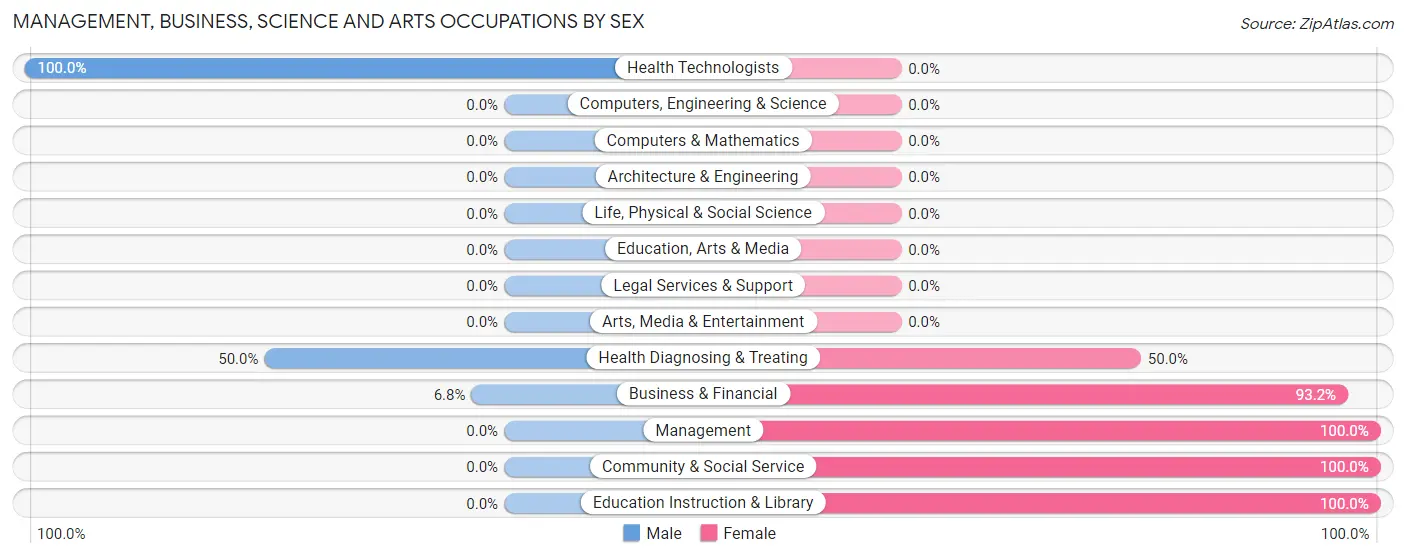
Management, Business, Science and Arts Occupations by Sex
Within the Management, Business, Science and Arts occupations in Rich Square, the most male-oriented occupations are Health Technologists (100.0%), Health Diagnosing & Treating (50.0%), and Business & Financial (6.8%), while the most female-oriented occupations are Management (100.0%), Community & Social Service (100.0%), and Education Instruction & Library (100.0%).
| Occupation | Male | Female |
| Management | 0 (0.0%) | 13 (100.0%) |
| Business & Financial | 3 (6.8%) | 41 (93.2%) |
| Computers, Engineering & Science | 0 (0.0%) | 0 (0.0%) |
| Computers & Mathematics | 0 (0.0%) | 0 (0.0%) |
| Architecture & Engineering | 0 (0.0%) | 0 (0.0%) |
| Life, Physical & Social Science | 0 (0.0%) | 0 (0.0%) |
| Community & Social Service | 0 (0.0%) | 1 (100.0%) |
| Education, Arts & Media | 0 (0.0%) | 0 (0.0%) |
| Legal Services & Support | 0 (0.0%) | 0 (0.0%) |
| Education Instruction & Library | 0 (0.0%) | 1 (100.0%) |
| Arts, Media & Entertainment | 0 (0.0%) | 0 (0.0%) |
| Health Diagnosing & Treating | 2 (50.0%) | 2 (50.0%) |
| Health Technologists | 2 (100.0%) | 0 (0.0%) |
| Total (Category) | 5 (8.1%) | 57 (91.9%) |
| Total (Overall) | 106 (40.5%) | 156 (59.5%) |
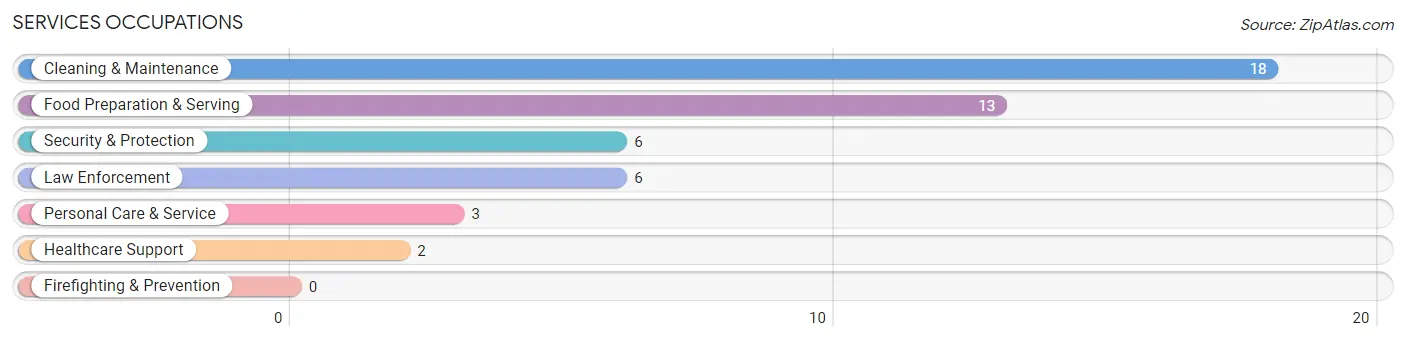
Services Occupations
The most common Services occupations in Rich Square are Cleaning & Maintenance (18 | 6.9%), Food Preparation & Serving (13 | 5.0%), Security & Protection (6 | 2.3%), Law Enforcement (6 | 2.3%), and Personal Care & Service (3 | 1.1%).
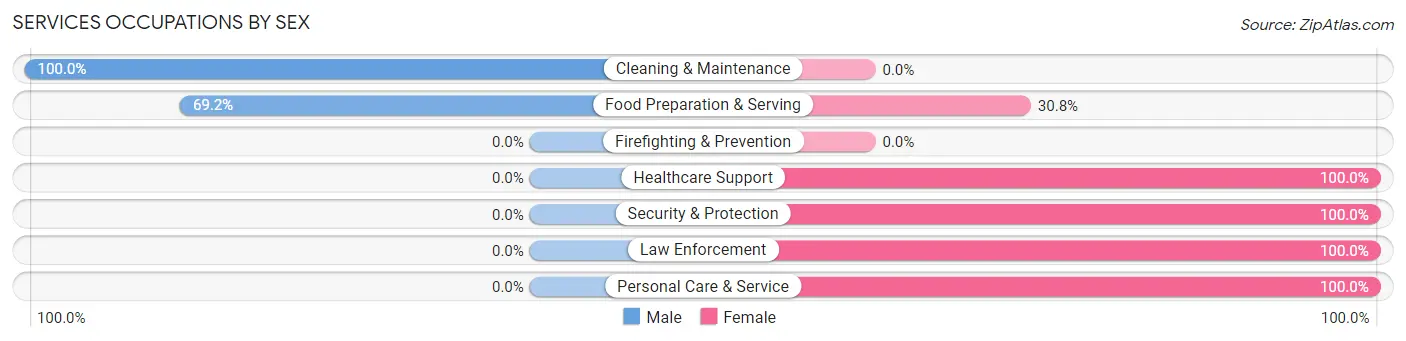
Services Occupations by Sex
Within the Services occupations in Rich Square, the most male-oriented occupations are Cleaning & Maintenance (100.0%), and Food Preparation & Serving (69.2%), while the most female-oriented occupations are Healthcare Support (100.0%), Security & Protection (100.0%), and Law Enforcement (100.0%).
| Occupation | Male | Female |
| Healthcare Support | 0 (0.0%) | 2 (100.0%) |
| Security & Protection | 0 (0.0%) | 6 (100.0%) |
| Firefighting & Prevention | 0 (0.0%) | 0 (0.0%) |
| Law Enforcement | 0 (0.0%) | 6 (100.0%) |
| Food Preparation & Serving | 9 (69.2%) | 4 (30.8%) |
| Cleaning & Maintenance | 18 (100.0%) | 0 (0.0%) |
| Personal Care & Service | 0 (0.0%) | 3 (100.0%) |
| Total (Category) | 27 (64.3%) | 15 (35.7%) |
| Total (Overall) | 106 (40.5%) | 156 (59.5%) |
Sales and Office Occupations
The most common Sales and Office occupations in Rich Square are Sales & Related (49 | 18.7%), and Office & Administration (10 | 3.8%).
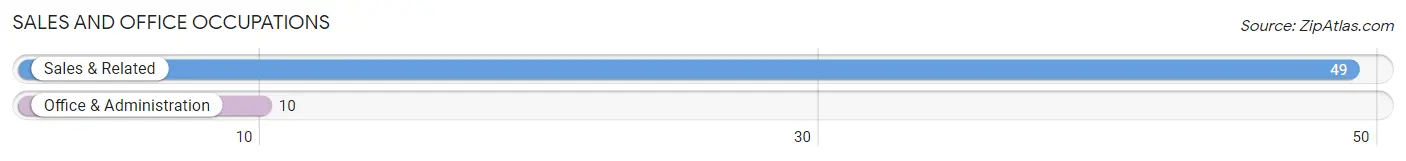
Sales and Office Occupations by Sex
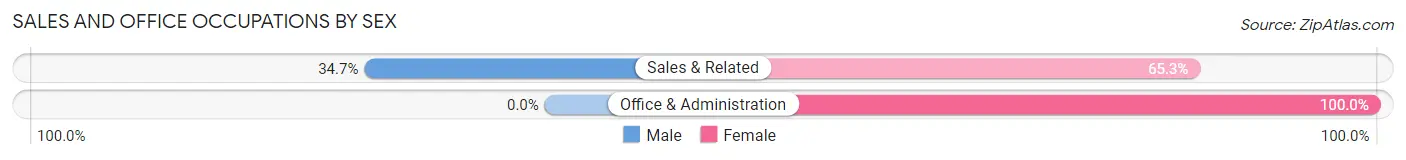
| Occupation | Male | Female |
| Sales & Related | 17 (34.7%) | 32 (65.3%) |
| Office & Administration | 0 (0.0%) | 10 (100.0%) |
| Total (Category) | 17 (28.8%) | 42 (71.2%) |
| Total (Overall) | 106 (40.5%) | 156 (59.5%) |
Natural Resources, Construction and Maintenance Occupations
The most common Natural Resources, Construction and Maintenance occupations in Rich Square are Installation, Maintenance & Repair (20 | 7.6%), Construction & Extraction (10 | 3.8%), and Farming, Fishing & Forestry (9 | 3.4%).
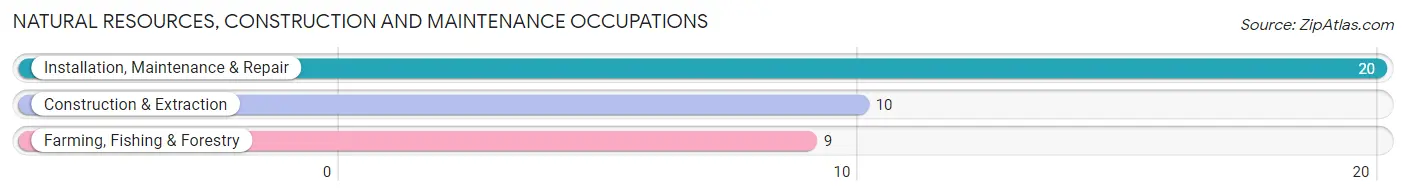
Natural Resources, Construction and Maintenance Occupations by Sex
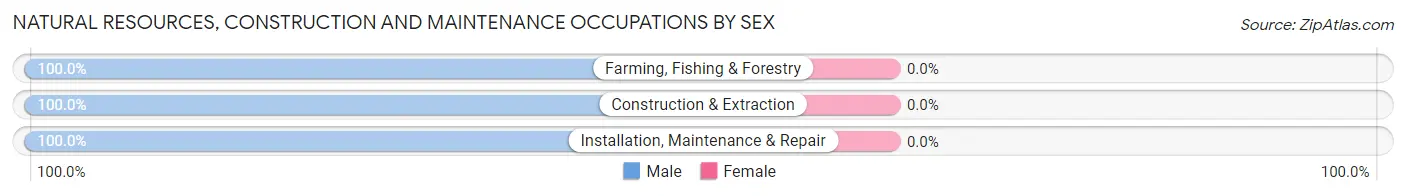
| Occupation | Male | Female |
| Farming, Fishing & Forestry | 9 (100.0%) | 0 (0.0%) |
| Construction & Extraction | 10 (100.0%) | 0 (0.0%) |
| Installation, Maintenance & Repair | 20 (100.0%) | 0 (0.0%) |
| Total (Category) | 39 (100.0%) | 0 (0.0%) |
| Total (Overall) | 106 (40.5%) | 156 (59.5%) |
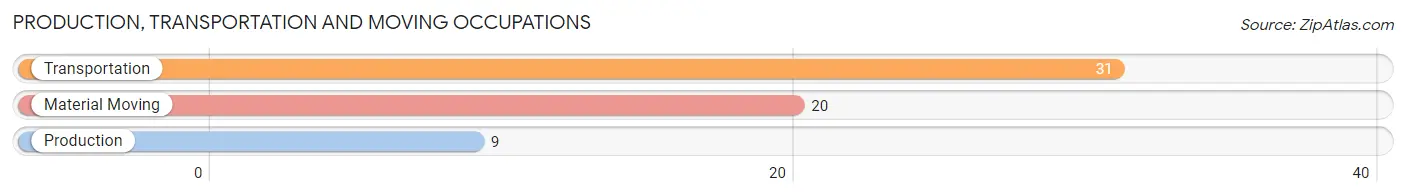
Production, Transportation and Moving Occupations
The most common Production, Transportation and Moving occupations in Rich Square are Transportation (31 | 11.8%), Material Moving (20 | 7.6%), and Production (9 | 3.4%).
Production, Transportation and Moving Occupations by Sex
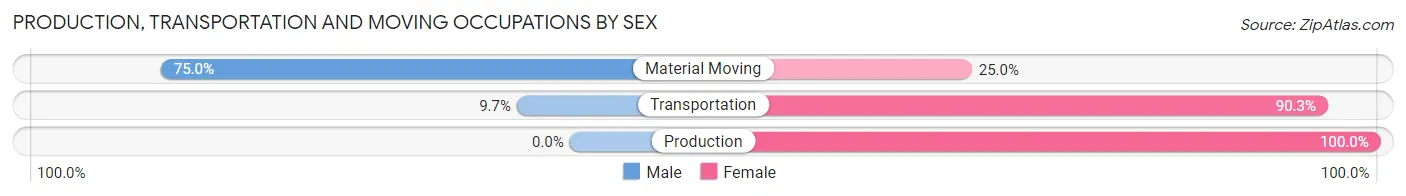
| Occupation | Male | Female |
| Production | 0 (0.0%) | 9 (100.0%) |
| Transportation | 3 (9.7%) | 28 (90.3%) |
| Material Moving | 15 (75.0%) | 5 (25.0%) |
| Total (Category) | 18 (30.0%) | 42 (70.0%) |
| Total (Overall) | 106 (40.5%) | 156 (59.5%) |
Employment Industries by Sex in Rich Square
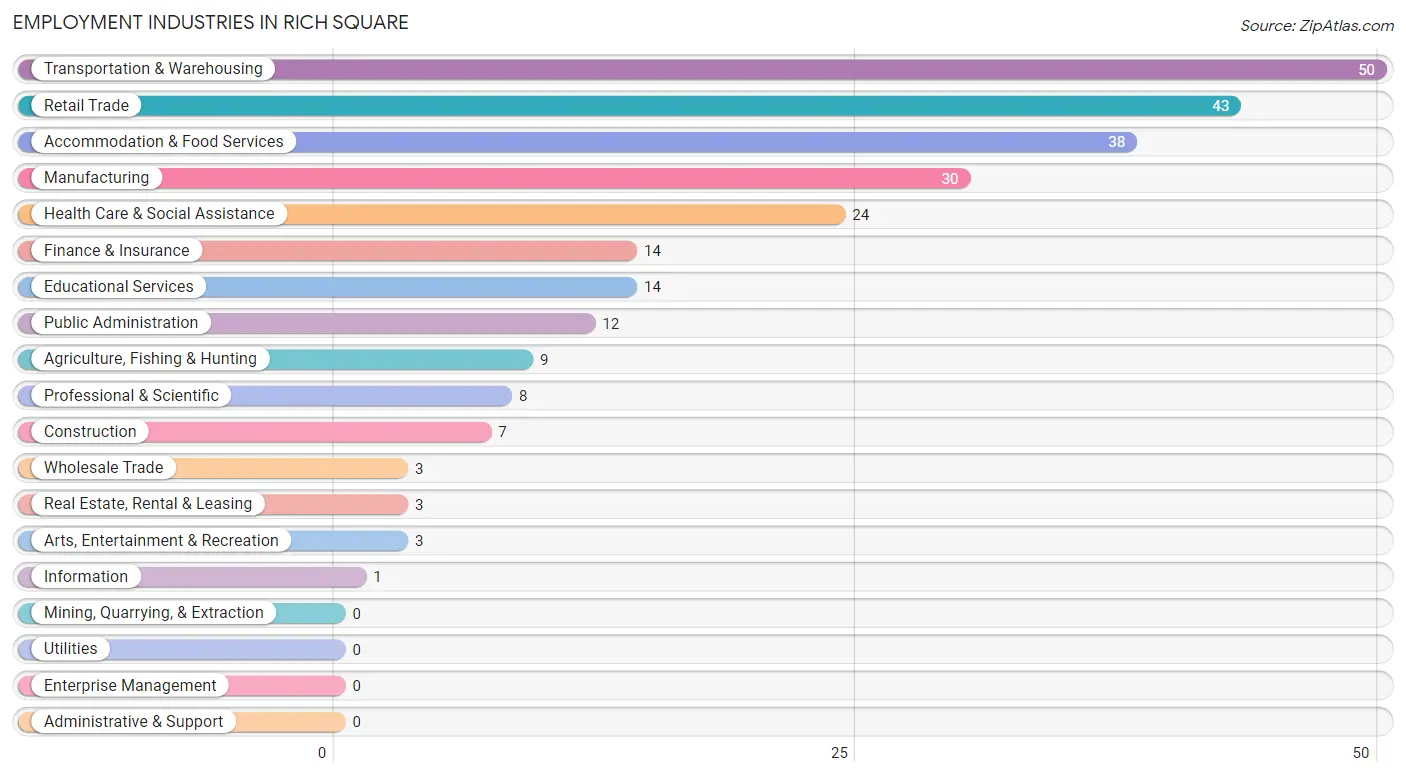
Employment Industries in Rich Square
The major employment industries in Rich Square include Transportation & Warehousing (50 | 19.1%), Retail Trade (43 | 16.4%), Accommodation & Food Services (38 | 14.5%), Manufacturing (30 | 11.5%), and Health Care & Social Assistance (24 | 9.2%).
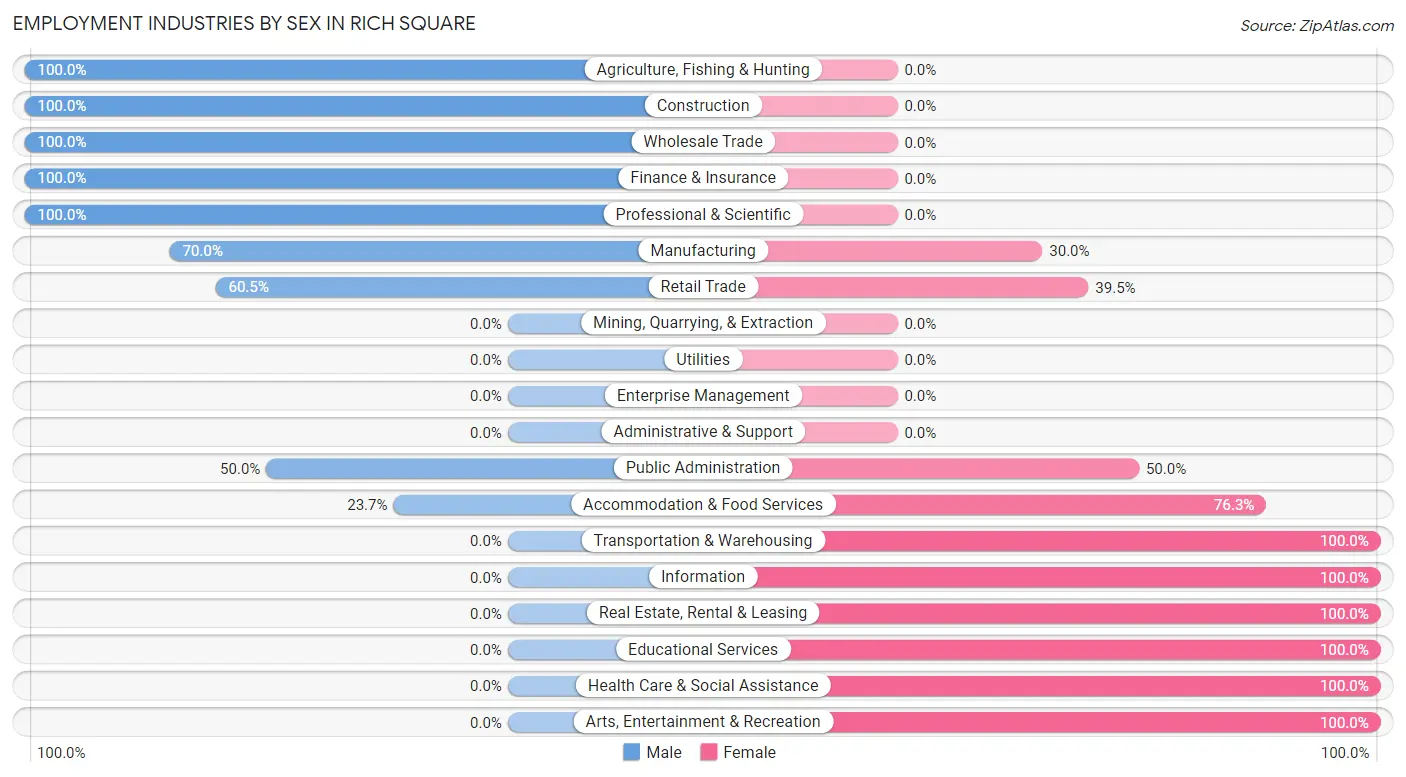
Employment Industries by Sex in Rich Square
The Rich Square industries that see more men than women are Agriculture, Fishing & Hunting (100.0%), Construction (100.0%), and Wholesale Trade (100.0%), whereas the industries that tend to have a higher number of women are Transportation & Warehousing (100.0%), Information (100.0%), and Real Estate, Rental & Leasing (100.0%).
| Industry | Male | Female |
| Agriculture, Fishing & Hunting | 9 (100.0%) | 0 (0.0%) |
| Mining, Quarrying, & Extraction | 0 (0.0%) | 0 (0.0%) |
| Construction | 7 (100.0%) | 0 (0.0%) |
| Manufacturing | 21 (70.0%) | 9 (30.0%) |
| Wholesale Trade | 3 (100.0%) | 0 (0.0%) |
| Retail Trade | 26 (60.5%) | 17 (39.5%) |
| Transportation & Warehousing | 0 (0.0%) | 50 (100.0%) |
| Utilities | 0 (0.0%) | 0 (0.0%) |
| Information | 0 (0.0%) | 1 (100.0%) |
| Finance & Insurance | 14 (100.0%) | 0 (0.0%) |
| Real Estate, Rental & Leasing | 0 (0.0%) | 3 (100.0%) |
| Professional & Scientific | 8 (100.0%) | 0 (0.0%) |
| Enterprise Management | 0 (0.0%) | 0 (0.0%) |
| Administrative & Support | 0 (0.0%) | 0 (0.0%) |
| Educational Services | 0 (0.0%) | 14 (100.0%) |
| Health Care & Social Assistance | 0 (0.0%) | 24 (100.0%) |
| Arts, Entertainment & Recreation | 0 (0.0%) | 3 (100.0%) |
| Accommodation & Food Services | 9 (23.7%) | 29 (76.3%) |
| Public Administration | 6 (50.0%) | 6 (50.0%) |
| Total | 106 (40.5%) | 156 (59.5%) |
Education in Rich Square
School Enrollment in Rich Square
The most common levels of schooling among the 71 students in Rich Square are high school (40 | 56.3%), middle school (13 | 18.3%), and college / undergraduate (12 | 16.9%).
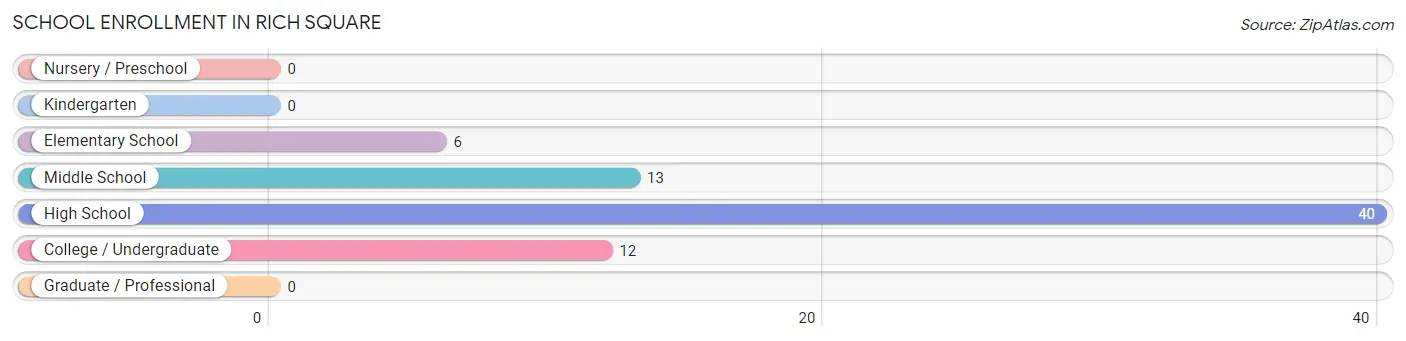
| School Level | # Students | % Students |
| Nursery / Preschool | 0 | 0.0% |
| Kindergarten | 0 | 0.0% |
| Elementary School | 6 | 8.5% |
| Middle School | 13 | 18.3% |
| High School | 40 | 56.3% |
| College / Undergraduate | 12 | 16.9% |
| Graduate / Professional | 0 | 0.0% |
| Total | 71 | 100.0% |
School Enrollment by Age by Funding Source in Rich Square
Out of a total of 71 students who are enrolled in schools in Rich Square, 11 (15.5%) attend a private institution, while the remaining 60 (84.5%) are enrolled in public schools. The age group of 25 to 34 year olds has the highest likelihood of being enrolled in private schools, with 9 (100.0% in the age bracket) enrolled. Conversely, the age group of 5 to 9 year old has the lowest likelihood of being enrolled in a private school, with 3 (100.0% in the age bracket) attending a public institution.
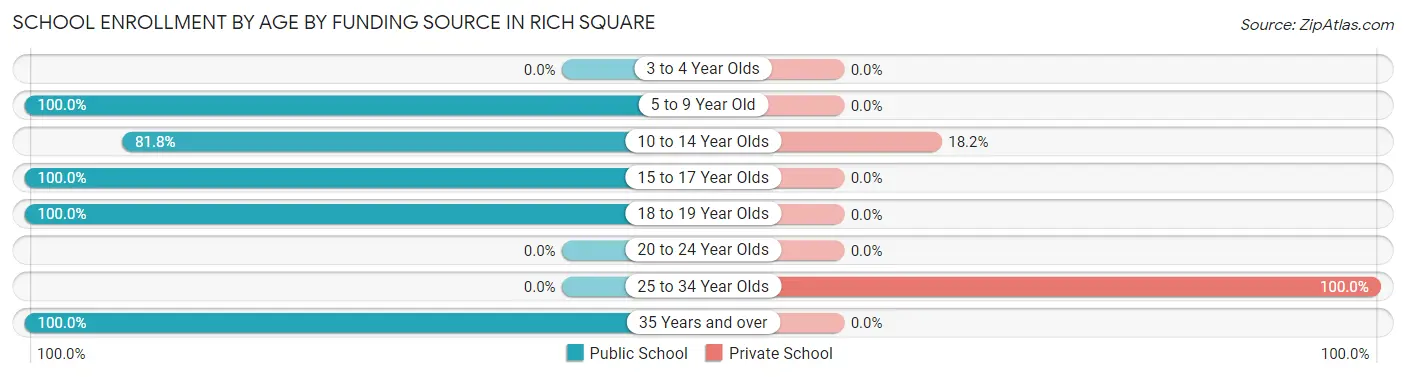
| Age Bracket | Public School | Private School |
| 3 to 4 Year Olds | 0 (0.0%) | 0 (0.0%) |
| 5 to 9 Year Old | 3 (100.0%) | 0 (0.0%) |
| 10 to 14 Year Olds | 9 (81.8%) | 2 (18.2%) |
| 15 to 17 Year Olds | 27 (100.0%) | 0 (0.0%) |
| 18 to 19 Year Olds | 18 (100.0%) | 0 (0.0%) |
| 20 to 24 Year Olds | 0 (0.0%) | 0 (0.0%) |
| 25 to 34 Year Olds | 0 (0.0%) | 9 (100.0%) |
| 35 Years and over | 3 (100.0%) | 0 (0.0%) |
| Total | 60 (84.5%) | 11 (15.5%) |
Educational Attainment by Field of Study in Rich Square
Psychology (48 | 39.7%), education (26 | 21.5%), social sciences (23 | 19.0%), business (15 | 12.4%), and liberal arts & history (4 | 3.3%) are the most common fields of study among 121 individuals in Rich Square who have obtained a bachelor's degree or higher.
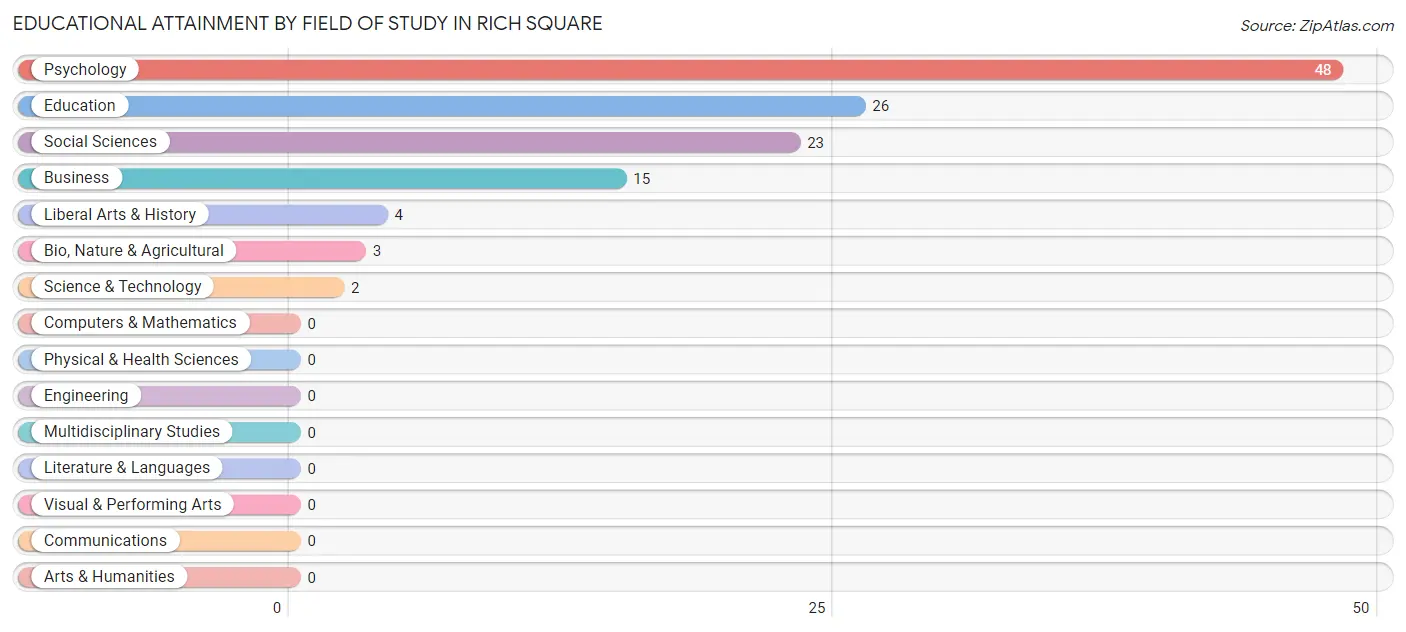
| Field of Study | # Graduates | % Graduates |
| Computers & Mathematics | 0 | 0.0% |
| Bio, Nature & Agricultural | 3 | 2.5% |
| Physical & Health Sciences | 0 | 0.0% |
| Psychology | 48 | 39.7% |
| Social Sciences | 23 | 19.0% |
| Engineering | 0 | 0.0% |
| Multidisciplinary Studies | 0 | 0.0% |
| Science & Technology | 2 | 1.7% |
| Business | 15 | 12.4% |
| Education | 26 | 21.5% |
| Literature & Languages | 0 | 0.0% |
| Liberal Arts & History | 4 | 3.3% |
| Visual & Performing Arts | 0 | 0.0% |
| Communications | 0 | 0.0% |
| Arts & Humanities | 0 | 0.0% |
| Total | 121 | 100.0% |
Transportation & Commute in Rich Square
Vehicle Availability by Sex in Rich Square
The most prevalent vehicle ownership categories in Rich Square are males with 3 vehicles (43, accounting for 40.6%) and females with 3 vehicles (27, making up 29.4%).
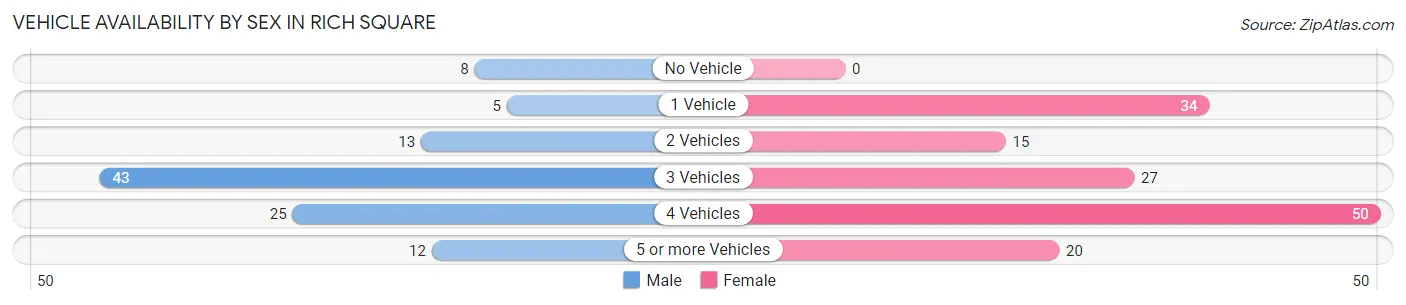
| Vehicles Available | Male | Female |
| No Vehicle | 8 (7.5%) | 0 (0.0%) |
| 1 Vehicle | 5 (4.7%) | 34 (23.3%) |
| 2 Vehicles | 13 (12.3%) | 15 (10.3%) |
| 3 Vehicles | 43 (40.6%) | 27 (18.5%) |
| 4 Vehicles | 25 (23.6%) | 50 (34.3%) |
| 5 or more Vehicles | 12 (11.3%) | 20 (13.7%) |
| Total | 106 (100.0%) | 146 (100.0%) |
Commute Time in Rich Square
The most frequently occuring commute durations in Rich Square are 40 to 44 minutes (59 commuters, 23.4%), 20 to 24 minutes (48 commuters, 19.1%), and less than 5 minutes (29 commuters, 11.5%).
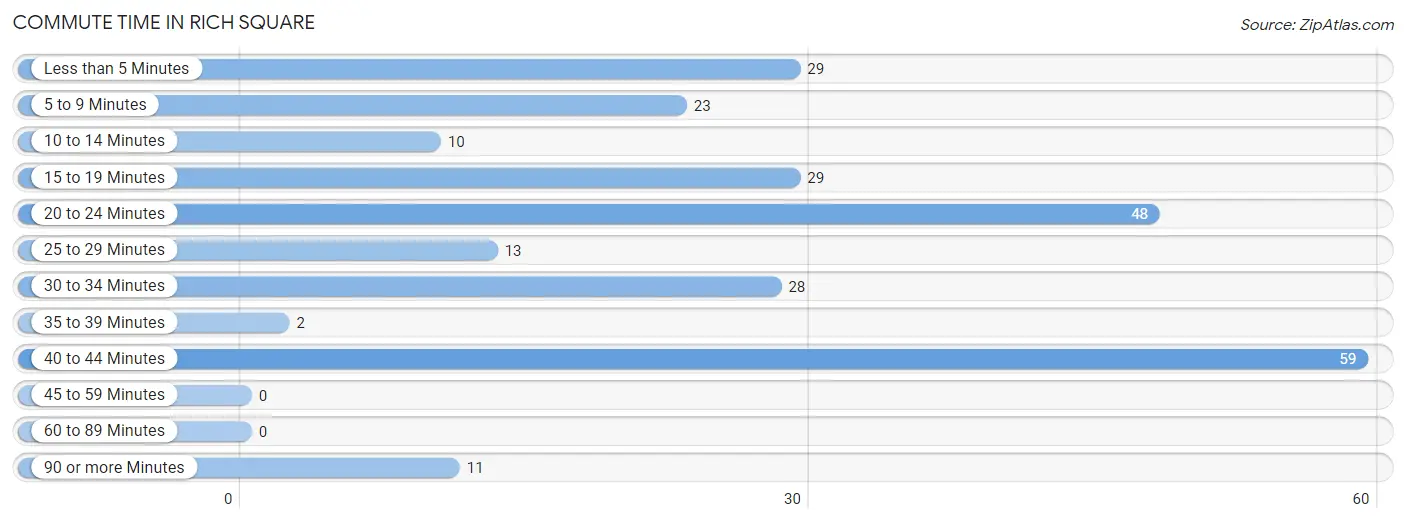
| Commute Time | # Commuters | % Commuters |
| Less than 5 Minutes | 29 | 11.5% |
| 5 to 9 Minutes | 23 | 9.1% |
| 10 to 14 Minutes | 10 | 4.0% |
| 15 to 19 Minutes | 29 | 11.5% |
| 20 to 24 Minutes | 48 | 19.1% |
| 25 to 29 Minutes | 13 | 5.2% |
| 30 to 34 Minutes | 28 | 11.1% |
| 35 to 39 Minutes | 2 | 0.8% |
| 40 to 44 Minutes | 59 | 23.4% |
| 45 to 59 Minutes | 0 | 0.0% |
| 60 to 89 Minutes | 0 | 0.0% |
| 90 or more Minutes | 11 | 4.4% |
Commute Time by Sex in Rich Square
The most common commute times in Rich Square are 20 to 24 minutes (30 commuters, 28.3%) for males and 40 to 44 minutes (43 commuters, 29.4%) for females.
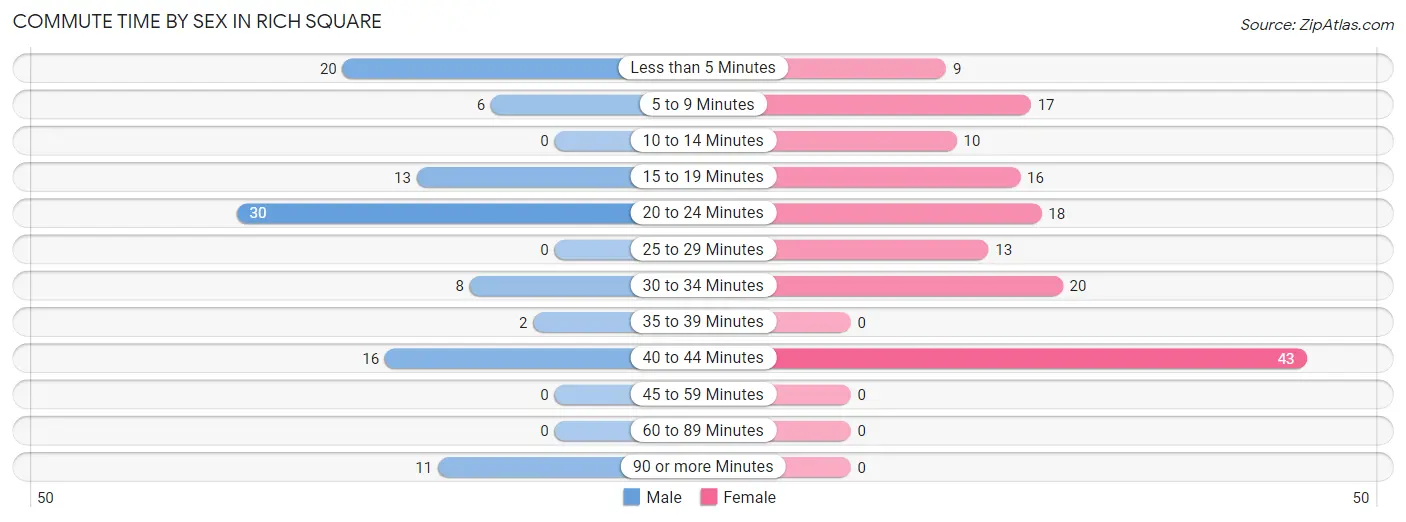
| Commute Time | Male | Female |
| Less than 5 Minutes | 20 (18.9%) | 9 (6.2%) |
| 5 to 9 Minutes | 6 (5.7%) | 17 (11.6%) |
| 10 to 14 Minutes | 0 (0.0%) | 10 (6.9%) |
| 15 to 19 Minutes | 13 (12.3%) | 16 (11.0%) |
| 20 to 24 Minutes | 30 (28.3%) | 18 (12.3%) |
| 25 to 29 Minutes | 0 (0.0%) | 13 (8.9%) |
| 30 to 34 Minutes | 8 (7.5%) | 20 (13.7%) |
| 35 to 39 Minutes | 2 (1.9%) | 0 (0.0%) |
| 40 to 44 Minutes | 16 (15.1%) | 43 (29.4%) |
| 45 to 59 Minutes | 0 (0.0%) | 0 (0.0%) |
| 60 to 89 Minutes | 0 (0.0%) | 0 (0.0%) |
| 90 or more Minutes | 11 (10.4%) | 0 (0.0%) |
Time of Departure to Work by Sex in Rich Square
The most frequent times of departure to work in Rich Square are 8:00 AM to 8:29 AM (24, 22.6%) for males and 5:00 AM to 5:29 AM (43, 29.4%) for females.
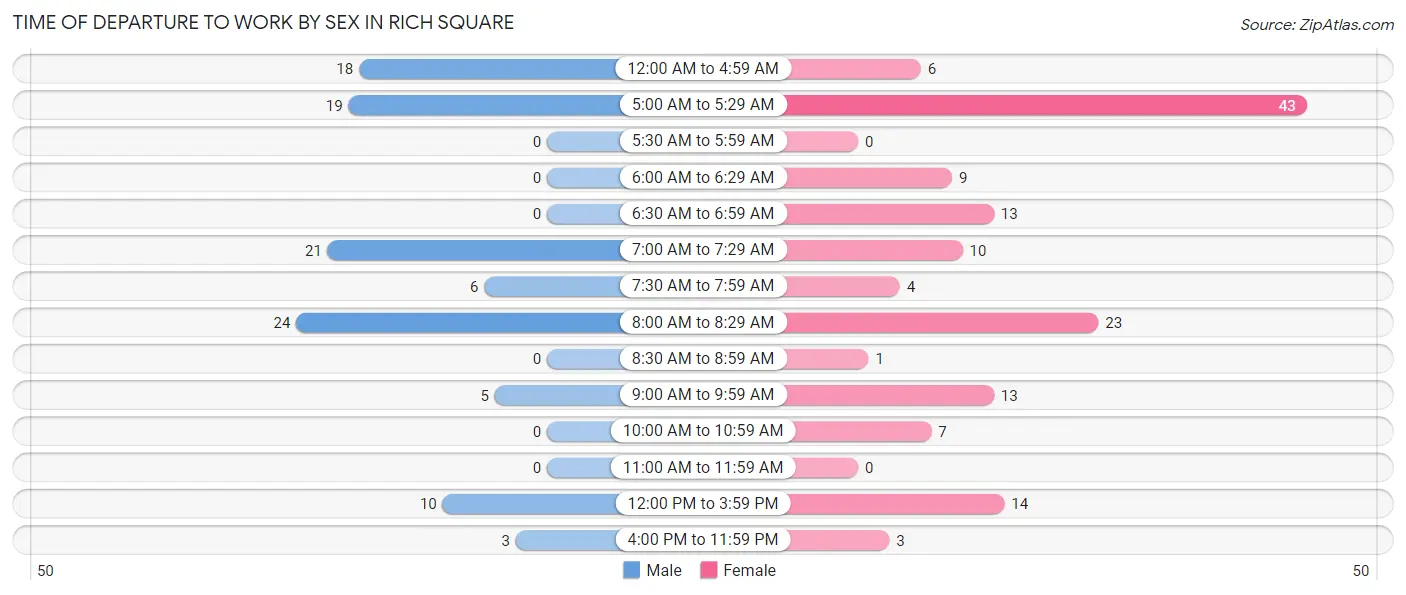
| Time of Departure | Male | Female |
| 12:00 AM to 4:59 AM | 18 (17.0%) | 6 (4.1%) |
| 5:00 AM to 5:29 AM | 19 (17.9%) | 43 (29.4%) |
| 5:30 AM to 5:59 AM | 0 (0.0%) | 0 (0.0%) |
| 6:00 AM to 6:29 AM | 0 (0.0%) | 9 (6.2%) |
| 6:30 AM to 6:59 AM | 0 (0.0%) | 13 (8.9%) |
| 7:00 AM to 7:29 AM | 21 (19.8%) | 10 (6.9%) |
| 7:30 AM to 7:59 AM | 6 (5.7%) | 4 (2.7%) |
| 8:00 AM to 8:29 AM | 24 (22.6%) | 23 (15.8%) |
| 8:30 AM to 8:59 AM | 0 (0.0%) | 1 (0.7%) |
| 9:00 AM to 9:59 AM | 5 (4.7%) | 13 (8.9%) |
| 10:00 AM to 10:59 AM | 0 (0.0%) | 7 (4.8%) |
| 11:00 AM to 11:59 AM | 0 (0.0%) | 0 (0.0%) |
| 12:00 PM to 3:59 PM | 10 (9.4%) | 14 (9.6%) |
| 4:00 PM to 11:59 PM | 3 (2.8%) | 3 (2.1%) |
| Total | 106 (100.0%) | 146 (100.0%) |
Housing Occupancy in Rich Square
Occupancy by Ownership in Rich Square
Of the total 317 dwellings in Rich Square, owner-occupied units account for 220 (69.4%), while renter-occupied units make up 97 (30.6%).
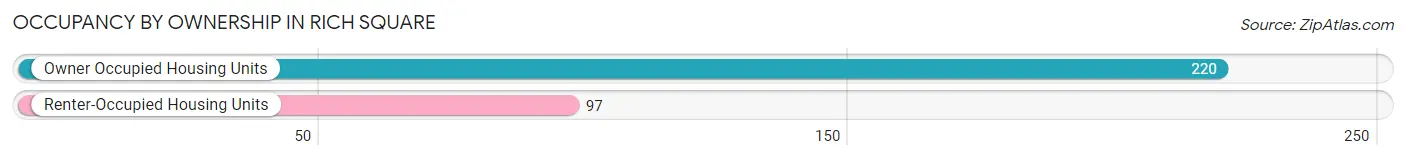
| Occupancy | # Housing Units | % Housing Units |
| Owner Occupied Housing Units | 220 | 69.4% |
| Renter-Occupied Housing Units | 97 | 30.6% |
| Total Occupied Housing Units | 317 | 100.0% |
Occupancy by Household Size in Rich Square
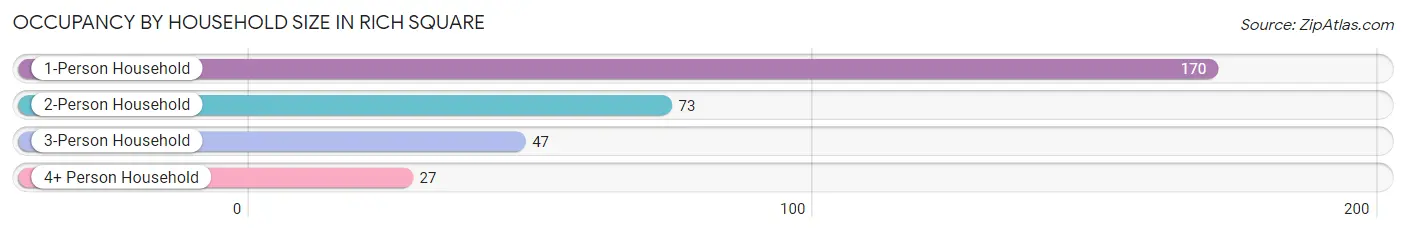
| Household Size | # Housing Units | % Housing Units |
| 1-Person Household | 170 | 53.6% |
| 2-Person Household | 73 | 23.0% |
| 3-Person Household | 47 | 14.8% |
| 4+ Person Household | 27 | 8.5% |
| Total Housing Units | 317 | 100.0% |
Occupancy by Ownership by Household Size in Rich Square
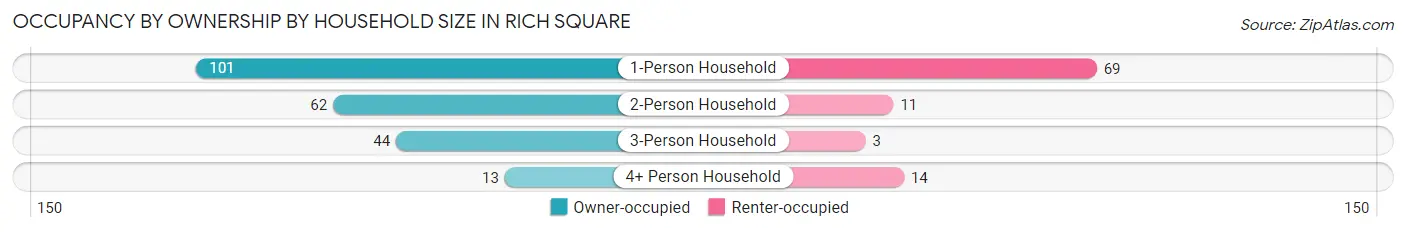
| Household Size | Owner-occupied | Renter-occupied |
| 1-Person Household | 101 (59.4%) | 69 (40.6%) |
| 2-Person Household | 62 (84.9%) | 11 (15.1%) |
| 3-Person Household | 44 (93.6%) | 3 (6.4%) |
| 4+ Person Household | 13 (48.1%) | 14 (51.8%) |
| Total Housing Units | 220 (69.4%) | 97 (30.6%) |
Occupancy by Educational Attainment in Rich Square
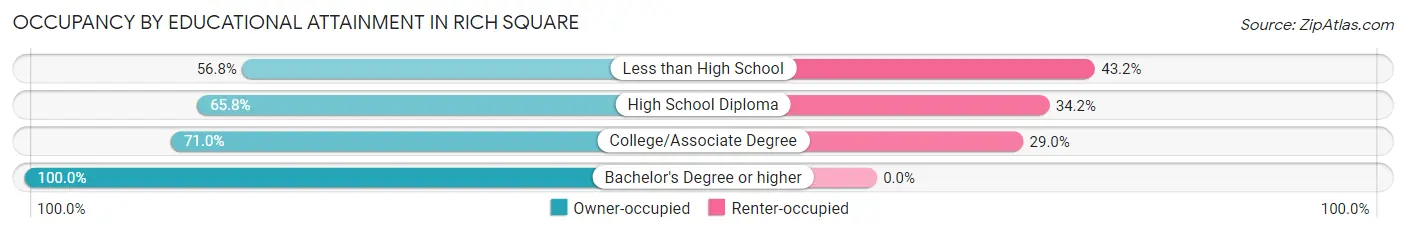
| Household Size | Owner-occupied | Renter-occupied |
| Less than High School | 42 (56.8%) | 32 (43.2%) |
| High School Diploma | 73 (65.8%) | 38 (34.2%) |
| College/Associate Degree | 66 (71.0%) | 27 (29.0%) |
| Bachelor's Degree or higher | 39 (100.0%) | 0 (0.0%) |
Occupancy by Age of Householder in Rich Square
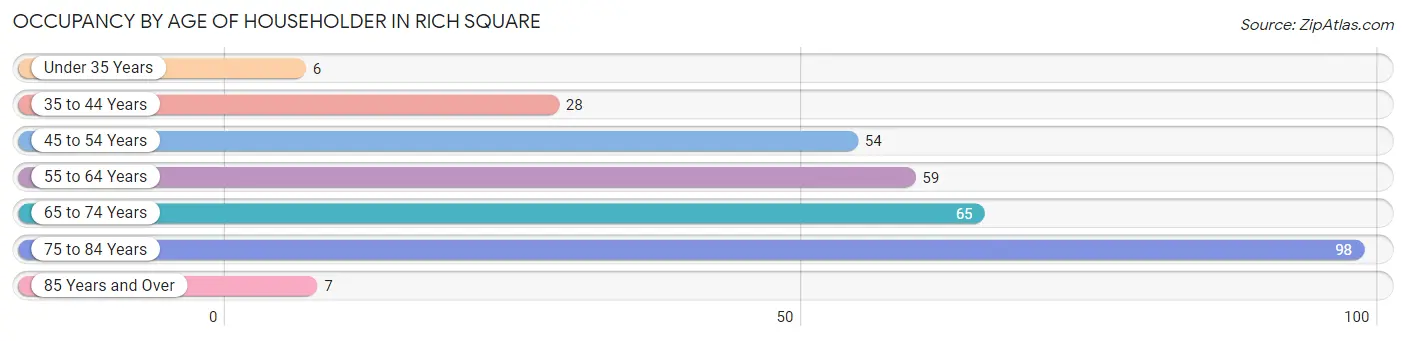
| Age Bracket | # Households | % Households |
| Under 35 Years | 6 | 1.9% |
| 35 to 44 Years | 28 | 8.8% |
| 45 to 54 Years | 54 | 17.0% |
| 55 to 64 Years | 59 | 18.6% |
| 65 to 74 Years | 65 | 20.5% |
| 75 to 84 Years | 98 | 30.9% |
| 85 Years and Over | 7 | 2.2% |
| Total | 317 | 100.0% |
Housing Finances in Rich Square
Median Income by Occupancy in Rich Square
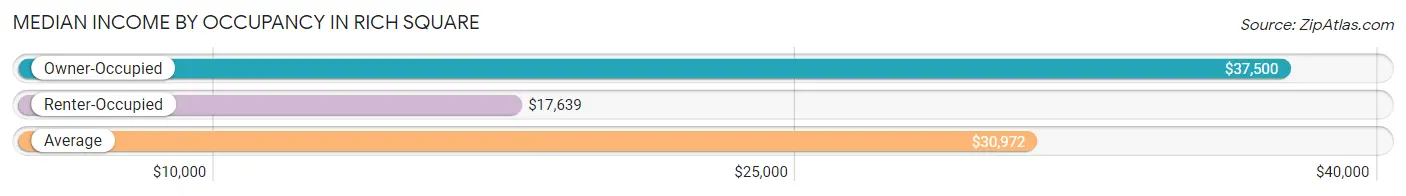
| Occupancy Type | # Households | Median Income |
| Owner-Occupied | 220 (69.4%) | $37,500 |
| Renter-Occupied | 97 (30.6%) | $17,639 |
| Average | 317 (100.0%) | $30,972 |
Occupancy by Householder Income Bracket in Rich Square
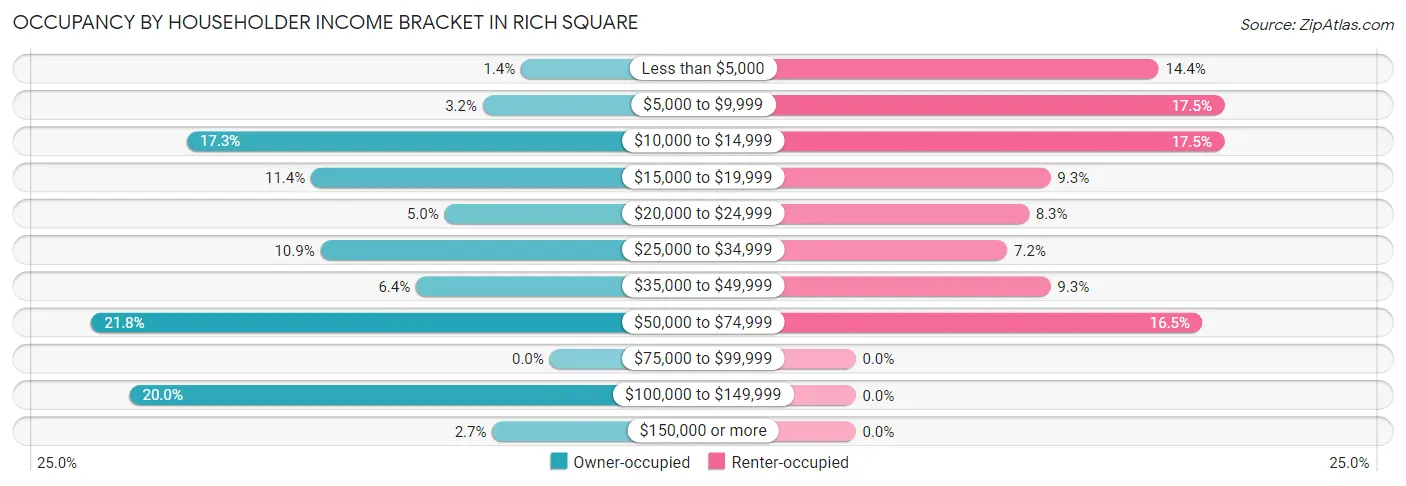
| Income Bracket | Owner-occupied | Renter-occupied |
| Less than $5,000 | 3 (1.4%) | 14 (14.4%) |
| $5,000 to $9,999 | 7 (3.2%) | 17 (17.5%) |
| $10,000 to $14,999 | 38 (17.3%) | 17 (17.5%) |
| $15,000 to $19,999 | 25 (11.4%) | 9 (9.3%) |
| $20,000 to $24,999 | 11 (5.0%) | 8 (8.3%) |
| $25,000 to $34,999 | 24 (10.9%) | 7 (7.2%) |
| $35,000 to $49,999 | 14 (6.4%) | 9 (9.3%) |
| $50,000 to $74,999 | 48 (21.8%) | 16 (16.5%) |
| $75,000 to $99,999 | 0 (0.0%) | 0 (0.0%) |
| $100,000 to $149,999 | 44 (20.0%) | 0 (0.0%) |
| $150,000 or more | 6 (2.7%) | 0 (0.0%) |
| Total | 220 (100.0%) | 97 (100.0%) |
Monthly Housing Cost Tiers in Rich Square
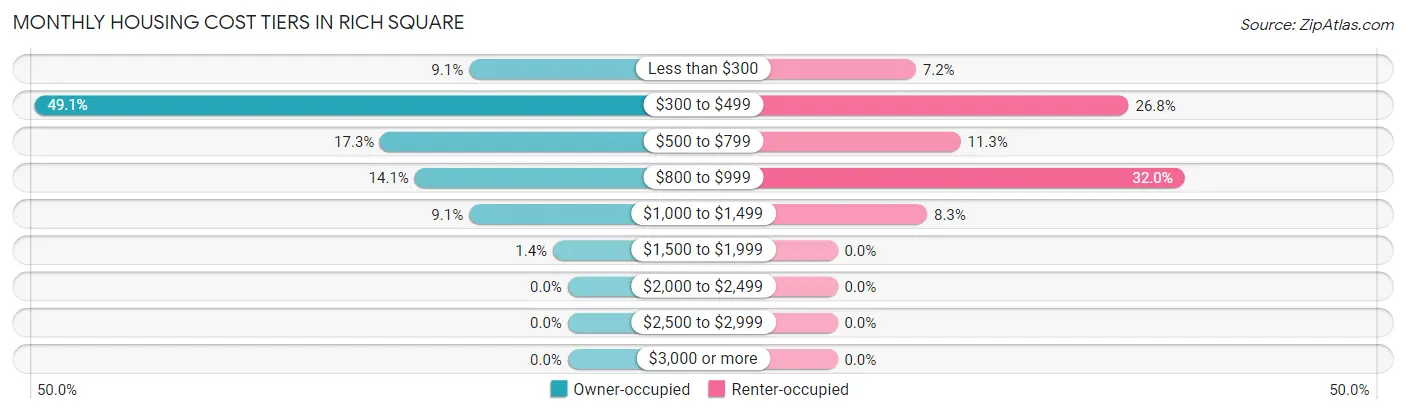
| Monthly Cost | Owner-occupied | Renter-occupied |
| Less than $300 | 20 (9.1%) | 7 (7.2%) |
| $300 to $499 | 108 (49.1%) | 26 (26.8%) |
| $500 to $799 | 38 (17.3%) | 11 (11.3%) |
| $800 to $999 | 31 (14.1%) | 31 (32.0%) |
| $1,000 to $1,499 | 20 (9.1%) | 8 (8.3%) |
| $1,500 to $1,999 | 3 (1.4%) | 0 (0.0%) |
| $2,000 to $2,499 | 0 (0.0%) | 0 (0.0%) |
| $2,500 to $2,999 | 0 (0.0%) | 0 (0.0%) |
| $3,000 or more | 0 (0.0%) | 0 (0.0%) |
| Total | 220 (100.0%) | 97 (100.0%) |
Physical Housing Characteristics in Rich Square
Housing Structures in Rich Square
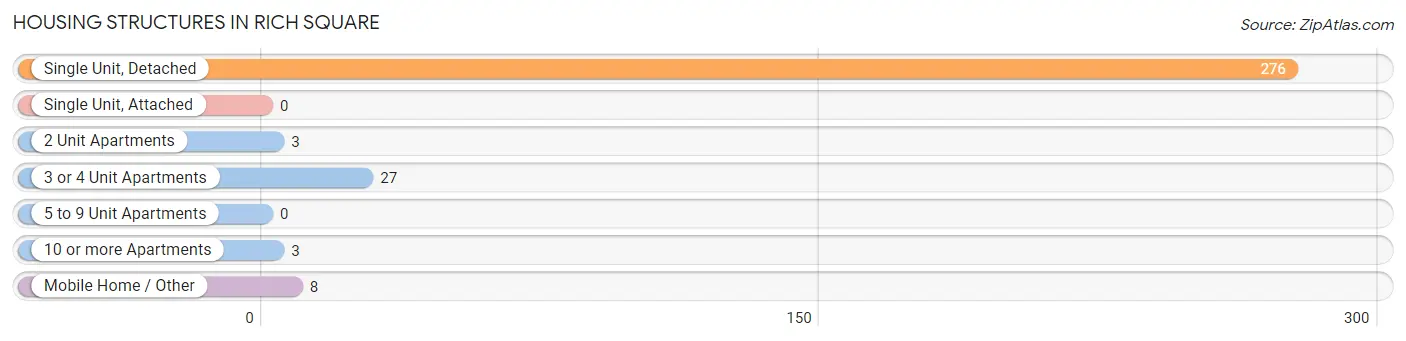
| Structure Type | # Housing Units | % Housing Units |
| Single Unit, Detached | 276 | 87.1% |
| Single Unit, Attached | 0 | 0.0% |
| 2 Unit Apartments | 3 | 0.9% |
| 3 or 4 Unit Apartments | 27 | 8.5% |
| 5 to 9 Unit Apartments | 0 | 0.0% |
| 10 or more Apartments | 3 | 0.9% |
| Mobile Home / Other | 8 | 2.5% |
| Total | 317 | 100.0% |
Housing Structures by Occupancy in Rich Square
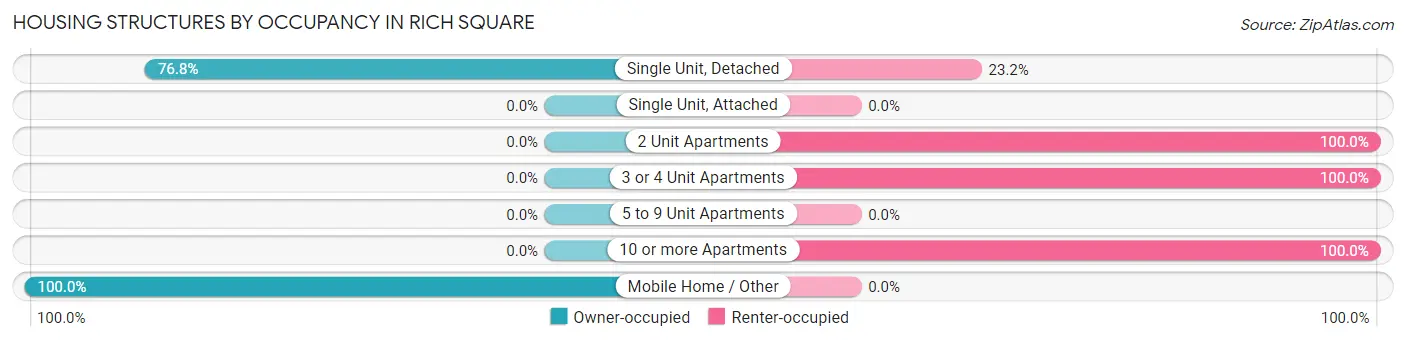
| Structure Type | Owner-occupied | Renter-occupied |
| Single Unit, Detached | 212 (76.8%) | 64 (23.2%) |
| Single Unit, Attached | 0 (0.0%) | 0 (0.0%) |
| 2 Unit Apartments | 0 (0.0%) | 3 (100.0%) |
| 3 or 4 Unit Apartments | 0 (0.0%) | 27 (100.0%) |
| 5 to 9 Unit Apartments | 0 (0.0%) | 0 (0.0%) |
| 10 or more Apartments | 0 (0.0%) | 3 (100.0%) |
| Mobile Home / Other | 8 (100.0%) | 0 (0.0%) |
| Total | 220 (69.4%) | 97 (30.6%) |
Housing Structures by Number of Rooms in Rich Square
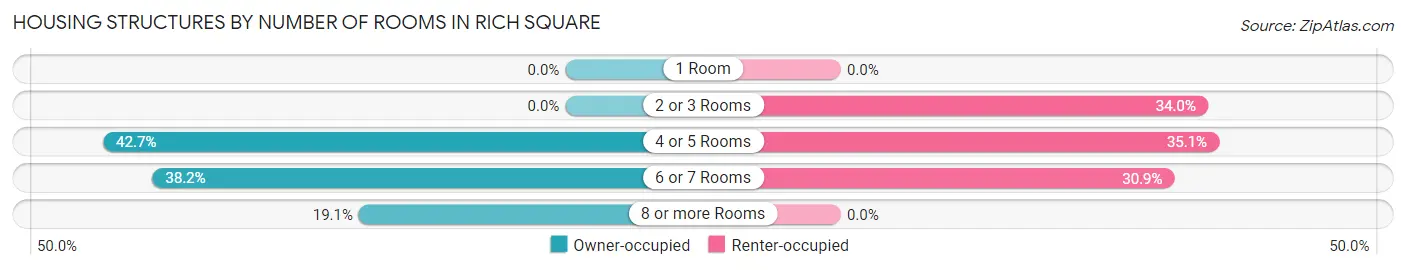
| Number of Rooms | Owner-occupied | Renter-occupied |
| 1 Room | 0 (0.0%) | 0 (0.0%) |
| 2 or 3 Rooms | 0 (0.0%) | 33 (34.0%) |
| 4 or 5 Rooms | 94 (42.7%) | 34 (35.0%) |
| 6 or 7 Rooms | 84 (38.2%) | 30 (30.9%) |
| 8 or more Rooms | 42 (19.1%) | 0 (0.0%) |
| Total | 220 (100.0%) | 97 (100.0%) |
Housing Structure by Heating Type in Rich Square
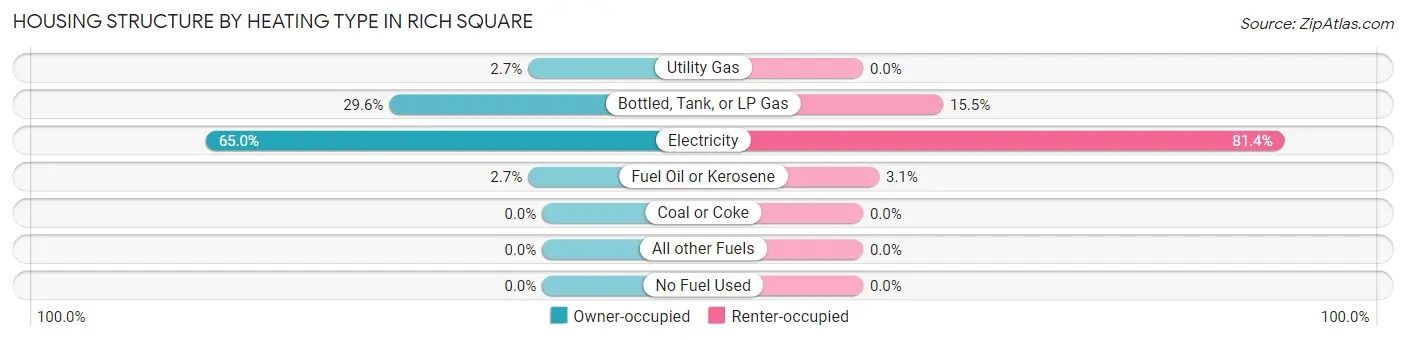
| Heating Type | Owner-occupied | Renter-occupied |
| Utility Gas | 6 (2.7%) | 0 (0.0%) |
| Bottled, Tank, or LP Gas | 65 (29.5%) | 15 (15.5%) |
| Electricity | 143 (65.0%) | 79 (81.4%) |
| Fuel Oil or Kerosene | 6 (2.7%) | 3 (3.1%) |
| Coal or Coke | 0 (0.0%) | 0 (0.0%) |
| All other Fuels | 0 (0.0%) | 0 (0.0%) |
| No Fuel Used | 0 (0.0%) | 0 (0.0%) |
| Total | 220 (100.0%) | 97 (100.0%) |
Household Vehicle Usage in Rich Square
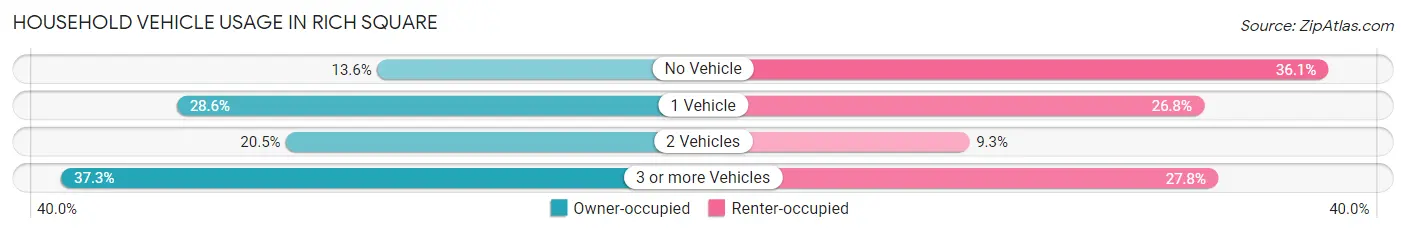
| Vehicles per Household | Owner-occupied | Renter-occupied |
| No Vehicle | 30 (13.6%) | 35 (36.1%) |
| 1 Vehicle | 63 (28.6%) | 26 (26.8%) |
| 2 Vehicles | 45 (20.4%) | 9 (9.3%) |
| 3 or more Vehicles | 82 (37.3%) | 27 (27.8%) |
| Total | 220 (100.0%) | 97 (100.0%) |
Real Estate & Mortgages in Rich Square
Real Estate and Mortgage Overview in Rich Square
| Characteristic | Without Mortgage | With Mortgage |
| Housing Units | 158 | 62 |
| Median Property Value | $84,200 | $76,300 |
| Median Household Income | $25,000 | $0 |
| Monthly Housing Costs | $426 | $0 |
| Real Estate Taxes | $907 | $0 |
Property Value by Mortgage Status in Rich Square
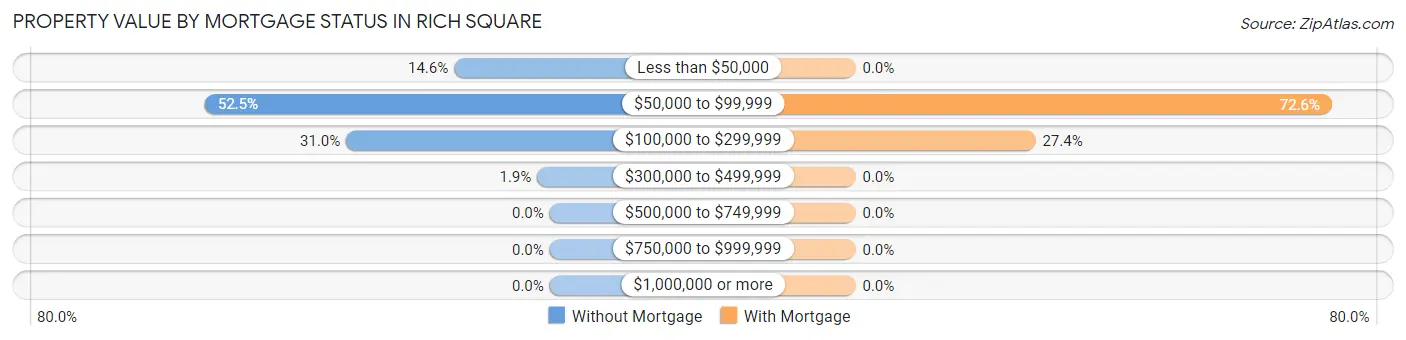
| Property Value | Without Mortgage | With Mortgage |
| Less than $50,000 | 23 (14.6%) | 0 (0.0%) |
| $50,000 to $99,999 | 83 (52.5%) | 45 (72.6%) |
| $100,000 to $299,999 | 49 (31.0%) | 17 (27.4%) |
| $300,000 to $499,999 | 3 (1.9%) | 0 (0.0%) |
| $500,000 to $749,999 | 0 (0.0%) | 0 (0.0%) |
| $750,000 to $999,999 | 0 (0.0%) | 0 (0.0%) |
| $1,000,000 or more | 0 (0.0%) | 0 (0.0%) |
| Total | 158 (100.0%) | 62 (100.0%) |
Household Income by Mortgage Status in Rich Square
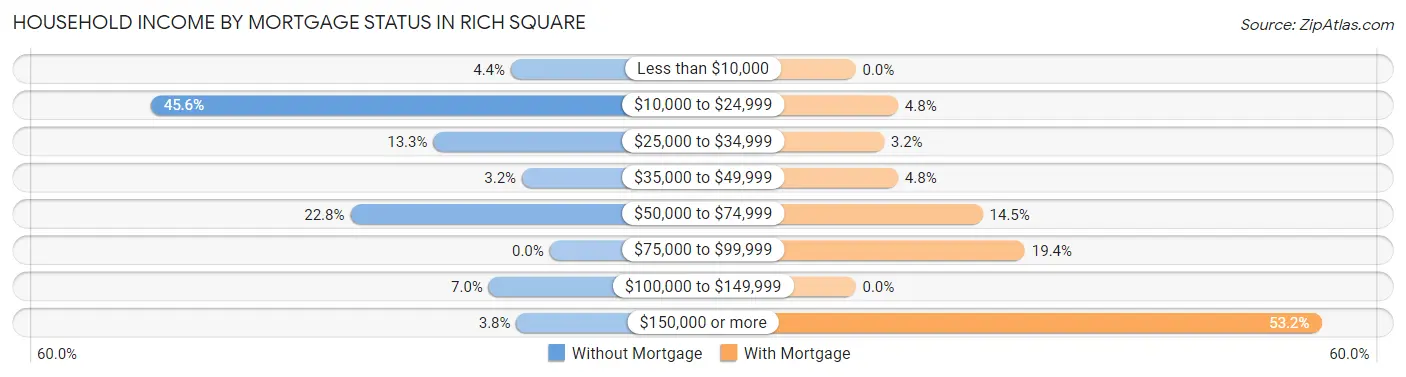
| Household Income | Without Mortgage | With Mortgage |
| Less than $10,000 | 7 (4.4%) | 0 (0.0%) |
| $10,000 to $24,999 | 72 (45.6%) | 3 (4.8%) |
| $25,000 to $34,999 | 21 (13.3%) | 2 (3.2%) |
| $35,000 to $49,999 | 5 (3.2%) | 3 (4.8%) |
| $50,000 to $74,999 | 36 (22.8%) | 9 (14.5%) |
| $75,000 to $99,999 | 0 (0.0%) | 12 (19.4%) |
| $100,000 to $149,999 | 11 (7.0%) | 0 (0.0%) |
| $150,000 or more | 6 (3.8%) | 33 (53.2%) |
| Total | 158 (100.0%) | 62 (100.0%) |
Property Value to Household Income Ratio in Rich Square
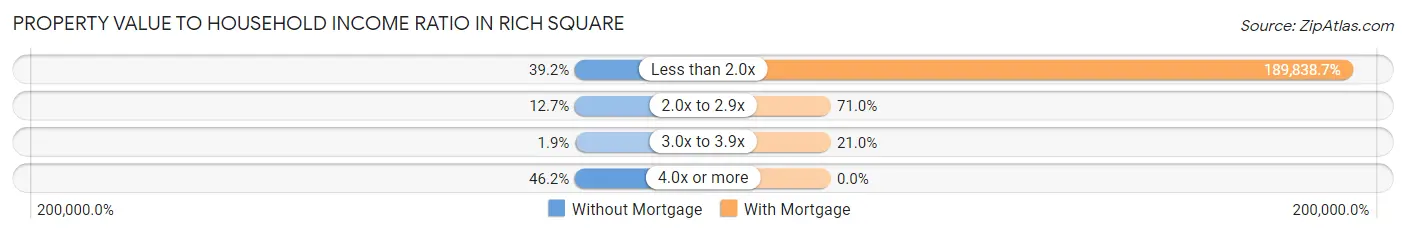
| Value-to-Income Ratio | Without Mortgage | With Mortgage |
| Less than 2.0x | 62 (39.2%) | 117,700 (189,838.7%) |
| 2.0x to 2.9x | 20 (12.7%) | 44 (71.0%) |
| 3.0x to 3.9x | 3 (1.9%) | 13 (21.0%) |
| 4.0x or more | 73 (46.2%) | 0 (0.0%) |
| Total | 158 (100.0%) | 62 (100.0%) |
Real Estate Taxes by Mortgage Status in Rich Square
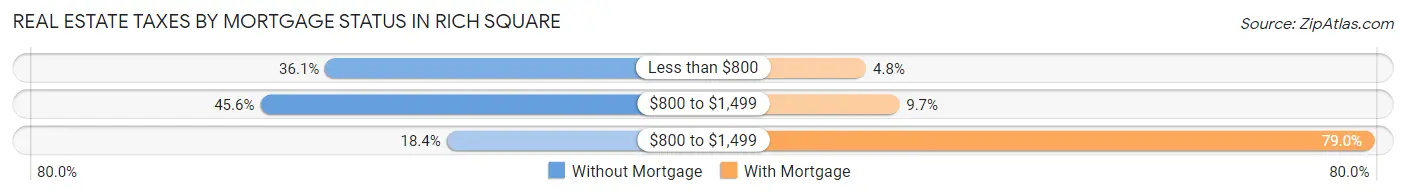
| Property Taxes | Without Mortgage | With Mortgage |
| Less than $800 | 57 (36.1%) | 3 (4.8%) |
| $800 to $1,499 | 72 (45.6%) | 6 (9.7%) |
| $800 to $1,499 | 29 (18.3%) | 49 (79.0%) |
| Total | 158 (100.0%) | 62 (100.0%) |
Health & Disability in Rich Square
Health Insurance Coverage by Age in Rich Square
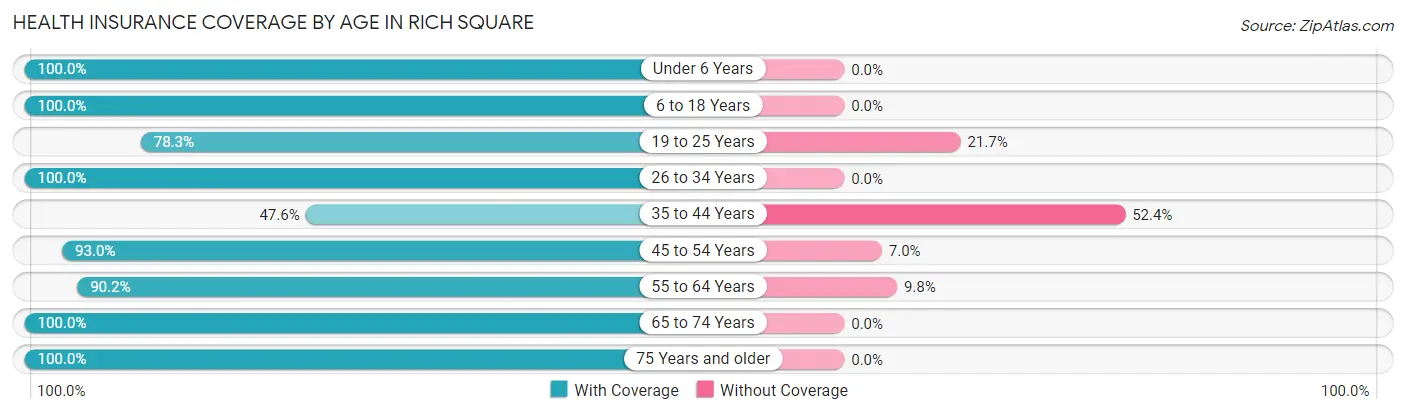
| Age Bracket | With Coverage | Without Coverage |
| Under 6 Years | 20 (100.0%) | 0 (0.0%) |
| 6 to 18 Years | 41 (100.0%) | 0 (0.0%) |
| 19 to 25 Years | 47 (78.3%) | 13 (21.7%) |
| 26 to 34 Years | 28 (100.0%) | 0 (0.0%) |
| 35 to 44 Years | 20 (47.6%) | 22 (52.4%) |
| 45 to 54 Years | 93 (93.0%) | 7 (7.0%) |
| 55 to 64 Years | 101 (90.2%) | 11 (9.8%) |
| 65 to 74 Years | 102 (100.0%) | 0 (0.0%) |
| 75 Years and older | 119 (100.0%) | 0 (0.0%) |
| Total | 571 (91.5%) | 53 (8.5%) |
Health Insurance Coverage by Citizenship Status in Rich Square
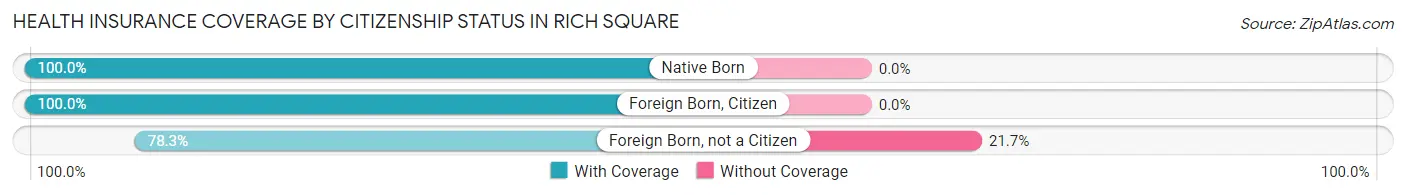
| Citizenship Status | With Coverage | Without Coverage |
| Native Born | 20 (100.0%) | 0 (0.0%) |
| Foreign Born, Citizen | 41 (100.0%) | 0 (0.0%) |
| Foreign Born, not a Citizen | 47 (78.3%) | 13 (21.7%) |
Health Insurance Coverage by Household Income in Rich Square
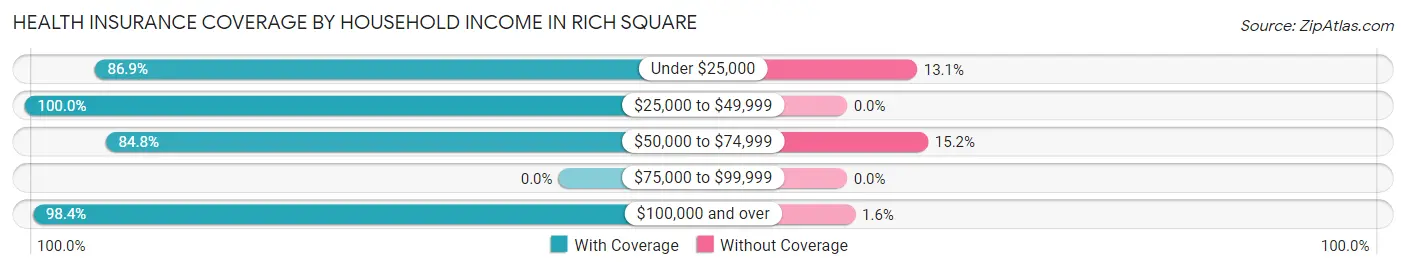
| Household Income | With Coverage | Without Coverage |
| Under $25,000 | 179 (86.9%) | 27 (13.1%) |
| $25,000 to $49,999 | 132 (100.0%) | 0 (0.0%) |
| $50,000 to $74,999 | 134 (84.8%) | 24 (15.2%) |
| $75,000 to $99,999 | 0 (0.0%) | 0 (0.0%) |
| $100,000 and over | 126 (98.4%) | 2 (1.6%) |
Public vs Private Health Insurance Coverage by Age in Rich Square
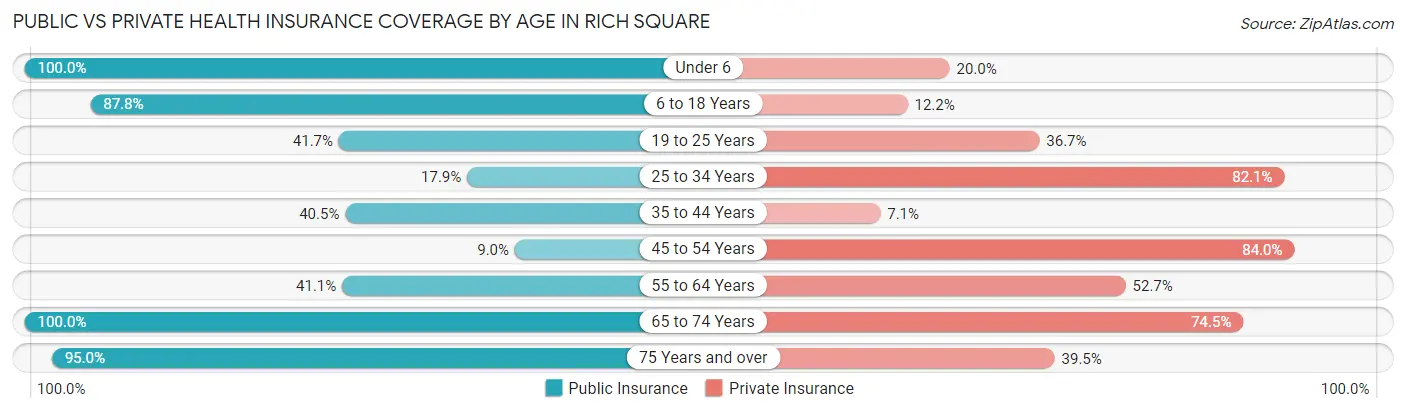
| Age Bracket | Public Insurance | Private Insurance |
| Under 6 | 20 (100.0%) | 4 (20.0%) |
| 6 to 18 Years | 36 (87.8%) | 5 (12.2%) |
| 19 to 25 Years | 25 (41.7%) | 22 (36.7%) |
| 25 to 34 Years | 5 (17.9%) | 23 (82.1%) |
| 35 to 44 Years | 17 (40.5%) | 3 (7.1%) |
| 45 to 54 Years | 9 (9.0%) | 84 (84.0%) |
| 55 to 64 Years | 46 (41.1%) | 59 (52.7%) |
| 65 to 74 Years | 102 (100.0%) | 76 (74.5%) |
| 75 Years and over | 113 (95.0%) | 47 (39.5%) |
| Total | 373 (59.8%) | 323 (51.8%) |
Disability Status by Sex by Age in Rich Square
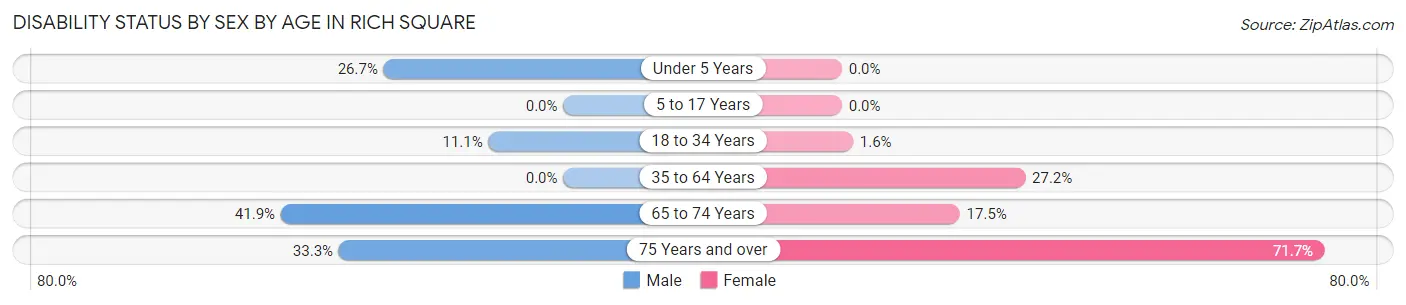
| Age Bracket | Male | Female |
| Under 5 Years | 4 (26.7%) | 0 (0.0%) |
| 5 to 17 Years | 0 (0.0%) | 0 (0.0%) |
| 18 to 34 Years | 3 (11.1%) | 1 (1.6%) |
| 35 to 64 Years | 0 (0.0%) | 43 (27.2%) |
| 65 to 74 Years | 26 (41.9%) | 7 (17.5%) |
| 75 Years and over | 9 (33.3%) | 66 (71.7%) |
Disability Class by Sex by Age in Rich Square
Disability Class: Hearing Difficulty
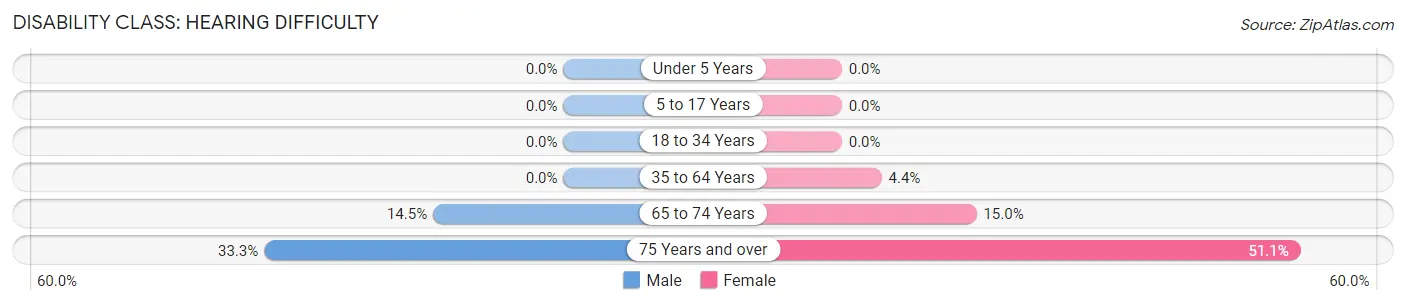
| Age Bracket | Male | Female |
| Under 5 Years | 0 (0.0%) | 0 (0.0%) |
| 5 to 17 Years | 0 (0.0%) | 0 (0.0%) |
| 18 to 34 Years | 0 (0.0%) | 0 (0.0%) |
| 35 to 64 Years | 0 (0.0%) | 7 (4.4%) |
| 65 to 74 Years | 9 (14.5%) | 6 (15.0%) |
| 75 Years and over | 9 (33.3%) | 47 (51.1%) |
Disability Class: Vision Difficulty
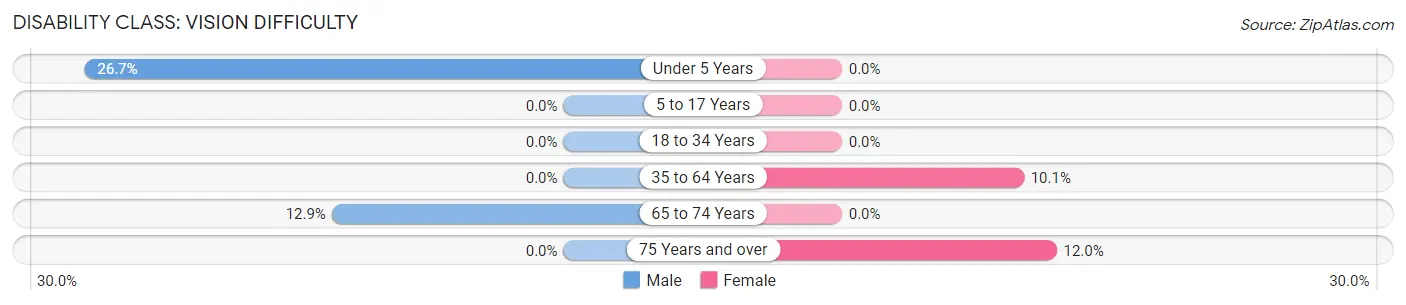
| Age Bracket | Male | Female |
| Under 5 Years | 4 (26.7%) | 0 (0.0%) |
| 5 to 17 Years | 0 (0.0%) | 0 (0.0%) |
| 18 to 34 Years | 0 (0.0%) | 0 (0.0%) |
| 35 to 64 Years | 0 (0.0%) | 16 (10.1%) |
| 65 to 74 Years | 8 (12.9%) | 0 (0.0%) |
| 75 Years and over | 0 (0.0%) | 11 (12.0%) |
Disability Class: Cognitive Difficulty
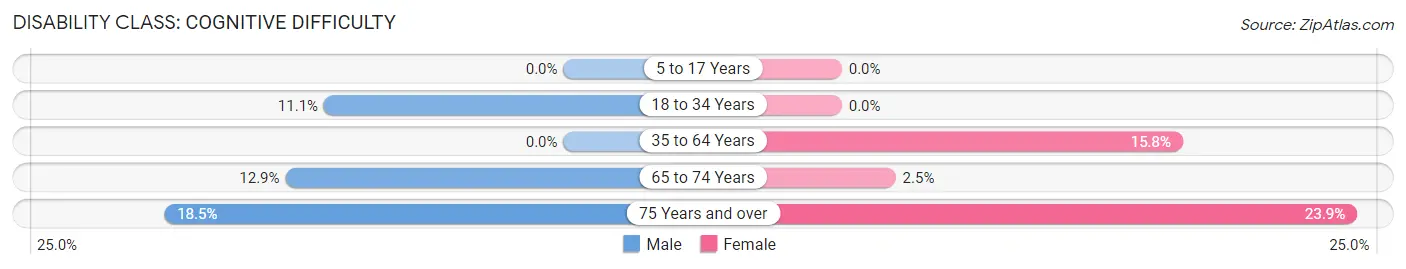
| Age Bracket | Male | Female |
| 5 to 17 Years | 0 (0.0%) | 0 (0.0%) |
| 18 to 34 Years | 3 (11.1%) | 0 (0.0%) |
| 35 to 64 Years | 0 (0.0%) | 25 (15.8%) |
| 65 to 74 Years | 8 (12.9%) | 1 (2.5%) |
| 75 Years and over | 5 (18.5%) | 22 (23.9%) |
Disability Class: Ambulatory Difficulty
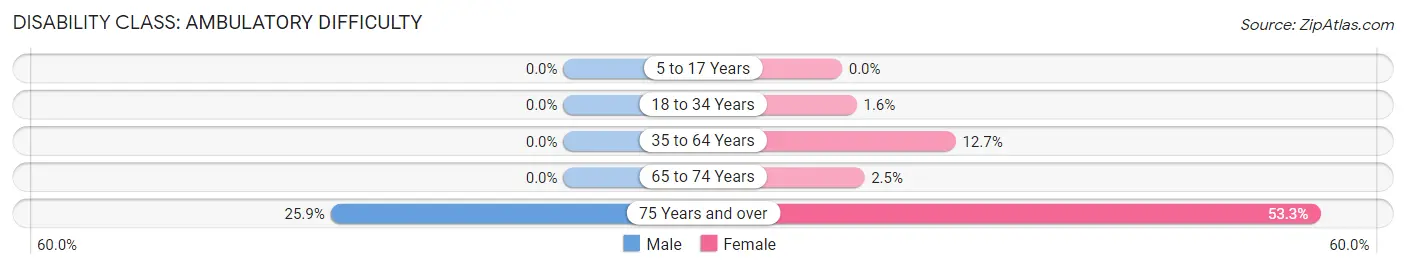
| Age Bracket | Male | Female |
| 5 to 17 Years | 0 (0.0%) | 0 (0.0%) |
| 18 to 34 Years | 0 (0.0%) | 1 (1.6%) |
| 35 to 64 Years | 0 (0.0%) | 20 (12.7%) |
| 65 to 74 Years | 0 (0.0%) | 1 (2.5%) |
| 75 Years and over | 7 (25.9%) | 49 (53.3%) |
Disability Class: Self-Care Difficulty
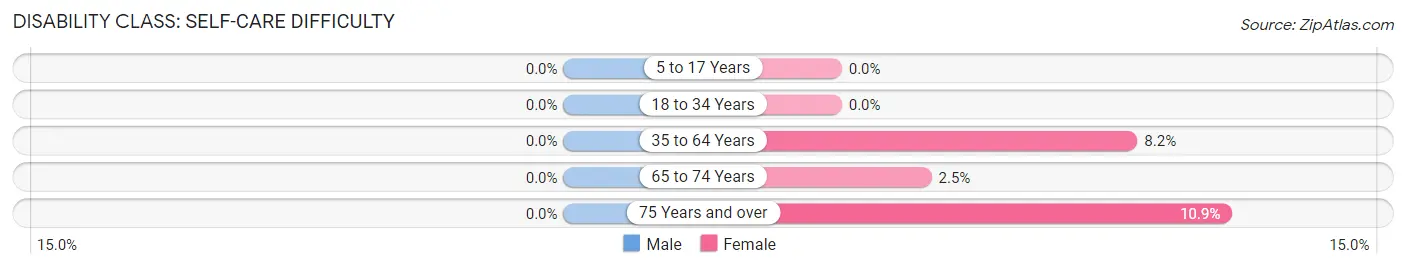
| Age Bracket | Male | Female |
| 5 to 17 Years | 0 (0.0%) | 0 (0.0%) |
| 18 to 34 Years | 0 (0.0%) | 0 (0.0%) |
| 35 to 64 Years | 0 (0.0%) | 13 (8.2%) |
| 65 to 74 Years | 0 (0.0%) | 1 (2.5%) |
| 75 Years and over | 0 (0.0%) | 10 (10.9%) |
Technology Access in Rich Square
Computing Device Access in Rich Square
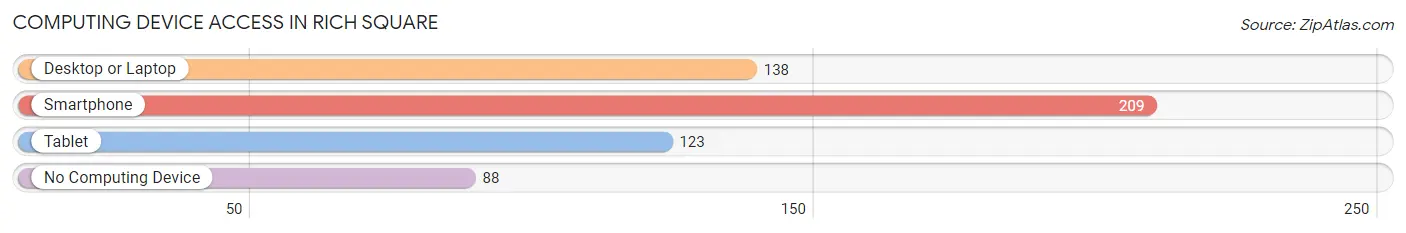
| Device Type | # Households | % Households |
| Desktop or Laptop | 138 | 43.5% |
| Smartphone | 209 | 65.9% |
| Tablet | 123 | 38.8% |
| No Computing Device | 88 | 27.8% |
| Total | 317 | 100.0% |
Internet Access in Rich Square
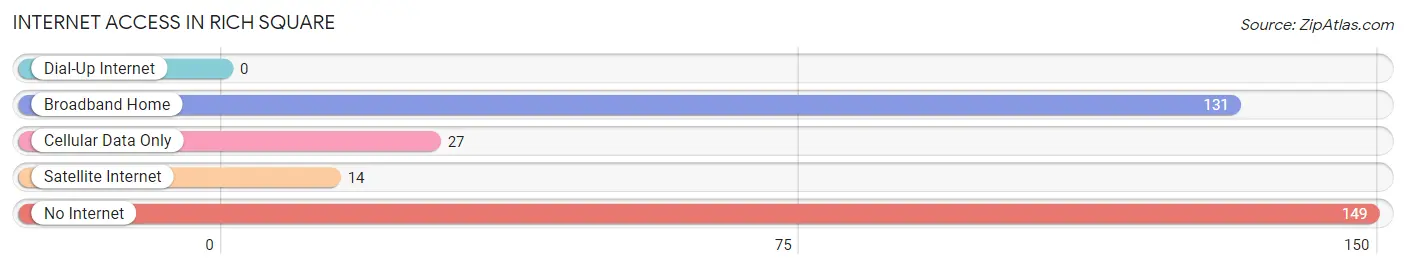
| Internet Type | # Households | % Households |
| Dial-Up Internet | 0 | 0.0% |
| Broadband Home | 131 | 41.3% |
| Cellular Data Only | 27 | 8.5% |
| Satellite Internet | 14 | 4.4% |
| No Internet | 149 | 47.0% |
| Total | 317 | 100.0% |
Rich Square Summary
Rich Square is a small town located in Northampton County, North Carolina. It is situated in the northeastern part of the state, about halfway between the cities of Rocky Mount and Elizabeth City. The town has a population of approximately 1,000 people and is part of the Roanoke-Chowan statistical area.
Geography
Rich Square is located in the Coastal Plain region of North Carolina, which is characterized by flat terrain and sandy soils. The town is situated on the banks of the Meherrin River, which flows through the area and provides a source of recreation for the local population. The town is surrounded by farmland and is located near the Great Dismal Swamp National Wildlife Refuge.
The climate in Rich Square is humid subtropical, with hot, humid summers and mild winters. The average annual temperature is around 70 degrees Fahrenheit, with average highs in the summer reaching the mid-80s and lows in the winter dipping into the mid-30s. The area receives an average of 48 inches of precipitation per year, with most of it falling in the summer months.
Economy
The economy of Rich Square is largely based on agriculture, with the town being home to several farms and agricultural businesses. The town is also home to a number of small businesses, including a grocery store, a hardware store, and a few restaurants.
The town is also home to a number of manufacturing businesses, including a furniture factory and a textile mill. These businesses provide employment for many of the town’s residents.
Demographics
As of the 2010 census, the population of Rich Square was 1,039. The racial makeup of the town was 57.3% White, 37.2% African American, 0.7% Native American, 0.3% Asian, and 4.5% from other races. Hispanic or Latino of any race were 1.7% of the population.
The median household income in Rich Square was $30,938, and the median family income was $37,813. The per capita income was $15,945. About 22.2% of the population was below the poverty line.
Education
Rich Square is served by the Northampton County Schools system. The town is home to Rich Square Elementary School, which serves students in grades K-5. The town is also home to Northampton County High School, which serves students in grades 9-12.
Conclusion
Rich Square is a small town located in Northampton County, North Carolina. It is situated in the northeastern part of the state, about halfway between the cities of Rocky Mount and Elizabeth City. The town has a population of approximately 1,000 people and is part of the Roanoke-Chowan statistical area. The economy of Rich Square is largely based on agriculture, with the town being home to several farms and agricultural businesses. The town is also home to a number of small businesses, including a grocery store, a hardware store, and a few restaurants. The town is served by the Northampton County Schools system. The racial makeup of the town was 57.3% White, 37.2% African American, 0.7% Native American, 0.3% Asian, and 4.5% from other races. The median household income in Rich Square was $30,938, and the median family income was $37,813. The per capita income was $15,945. About 22.2% of the population was below the poverty line. Rich Square is a small town with a rich history and a bright future.
Common Questions
What is Per Capita Income in Rich Square?
Per Capita income in Rich Square is $22,399.
What is the Median Family Income in Rich Square?
Median Family Income in Rich Square is $59,712.
What is the Median Household income in Rich Square?
Median Household Income in Rich Square is $30,972.
What is Income or Wage Gap in Rich Square?
Income or Wage Gap in Rich Square is 11.7%.
Women in Rich Square earn 88.3 cents for every dollar earned by a man.
What is Inequality or Gini Index in Rich Square?
Inequality or Gini Index in Rich Square is 0.50.
What is the Total Population of Rich Square?
Total Population of Rich Square is 746.
What is the Total Male Population of Rich Square?
Total Male Population of Rich Square is 297.
What is the Total Female Population of Rich Square?
Total Female Population of Rich Square is 449.
What is the Ratio of Males per 100 Females in Rich Square?
There are 66.15 Males per 100 Females in Rich Square.
What is the Ratio of Females per 100 Males in Rich Square?
There are 151.18 Females per 100 Males in Rich Square.
What is the Median Population Age in Rich Square?
Median Population Age in Rich Square is 62.9 Years.
What is the Average Family Size in Rich Square
Average Family Size in Rich Square is 3.1 People.
What is the Average Household Size in Rich Square
Average Household Size in Rich Square is 2.0 People.
How Large is the Labor Force in Rich Square?
There are 291 People in the Labor Forcein in Rich Square.
What is the Percentage of People in the Labor Force in Rich Square?
40.9% of People are in the Labor Force in Rich Square.
What is the Unemployment Rate in Rich Square?
Unemployment Rate in Rich Square is 10.0%.