Smithfield, NC Map & Demographics
Smithfield Map
Smithfield Overview
$26,778
PER CAPITA INCOME
$62,697
AVG FAMILY INCOME
$37,000
AVG HOUSEHOLD INCOME
31.2%
WAGE / INCOME GAP [ % ]
68.8¢/ $1
WAGE / INCOME GAP [ $ ]
0.57
INEQUALITY / GINI INDEX
11,527
TOTAL POPULATION
5,625
MALE POPULATION
5,902
FEMALE POPULATION
95.31
MALES / 100 FEMALES
104.92
FEMALES / 100 MALES
41.9
MEDIAN AGE
3.2
AVG FAMILY SIZE
2.4
AVG HOUSEHOLD SIZE
4,414
LABOR FORCE [ PEOPLE ]
48.6%
PERCENT IN LABOR FORCE
6.5%
UNEMPLOYMENT RATE
Smithfield Zip Codes
Smithfield Area Codes
Income in Smithfield
Income Overview in Smithfield
Per Capita Income in Smithfield is $26,778, while median incomes of families and households are $62,697 and $37,000 respectively.
| Characteristic | Number | Measure |
| Per Capita Income | 11,527 | $26,778 |
| Median Family Income | 2,470 | $62,697 |
| Mean Family Income | 2,470 | $84,503 |
| Median Household Income | 4,524 | $37,000 |
| Mean Household Income | 4,524 | $64,843 |
| Income Deficit | 2,470 | $0 |
| Wage / Income Gap (%) | 11,527 | 31.17% |
| Wage / Income Gap ($) | 11,527 | 68.83¢ per $1 |
| Gini / Inequality Index | 11,527 | 0.57 |
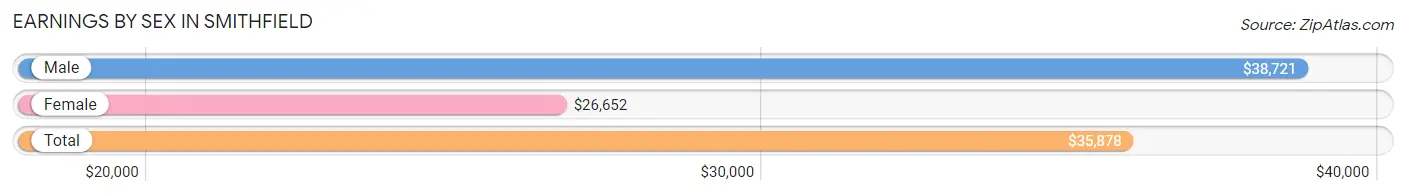
Earnings by Sex in Smithfield
Average Earnings in Smithfield are $35,878, $38,721 for men and $26,652 for women, a difference of 31.2%.
| Sex | Number | Average Earnings |
| Male | 2,622 (56.3%) | $38,721 |
| Female | 2,033 (43.7%) | $26,652 |
| Total | 4,655 (100.0%) | $35,878 |
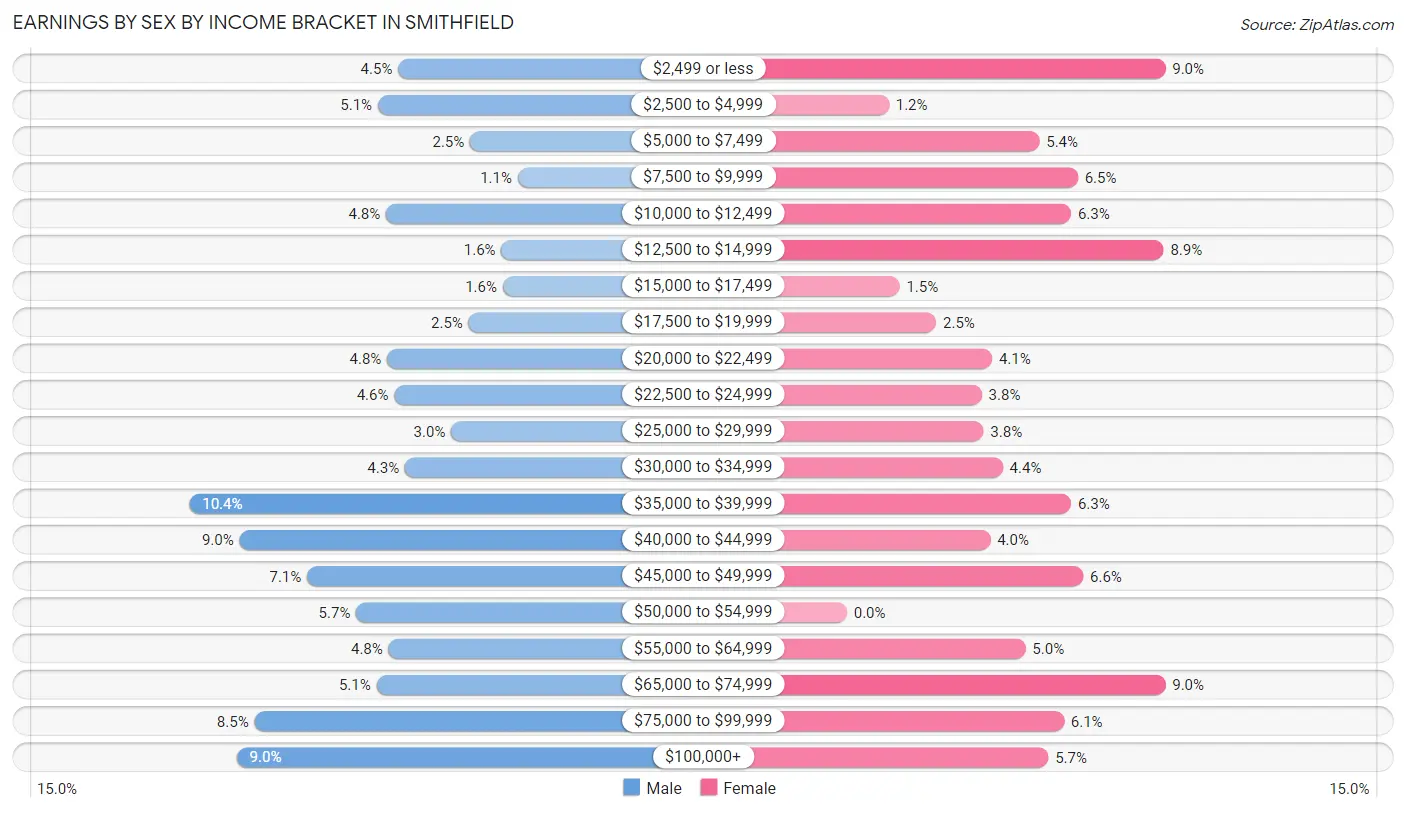
Earnings by Sex by Income Bracket in Smithfield
The most common earnings brackets in Smithfield are $35,000 to $39,999 for men (272 | 10.4%) and $2,499 or less for women (182 | 8.9%).
| Income | Male | Female |
| $2,499 or less | 118 (4.5%) | 182 (8.9%) |
| $2,500 to $4,999 | 133 (5.1%) | 24 (1.2%) |
| $5,000 to $7,499 | 65 (2.5%) | 110 (5.4%) |
| $7,500 to $9,999 | 30 (1.1%) | 132 (6.5%) |
| $10,000 to $12,499 | 127 (4.8%) | 128 (6.3%) |
| $12,500 to $14,999 | 42 (1.6%) | 181 (8.9%) |
| $15,000 to $17,499 | 41 (1.6%) | 30 (1.5%) |
| $17,500 to $19,999 | 66 (2.5%) | 51 (2.5%) |
| $20,000 to $22,499 | 126 (4.8%) | 83 (4.1%) |
| $22,500 to $24,999 | 121 (4.6%) | 77 (3.8%) |
| $25,000 to $29,999 | 79 (3.0%) | 78 (3.8%) |
| $30,000 to $34,999 | 113 (4.3%) | 89 (4.4%) |
| $35,000 to $39,999 | 272 (10.4%) | 128 (6.3%) |
| $40,000 to $44,999 | 235 (9.0%) | 82 (4.0%) |
| $45,000 to $49,999 | 185 (7.1%) | 135 (6.6%) |
| $50,000 to $54,999 | 149 (5.7%) | 0 (0.0%) |
| $55,000 to $64,999 | 125 (4.8%) | 102 (5.0%) |
| $65,000 to $74,999 | 134 (5.1%) | 182 (8.9%) |
| $75,000 to $99,999 | 224 (8.5%) | 124 (6.1%) |
| $100,000+ | 237 (9.0%) | 115 (5.7%) |
| Total | 2,622 (100.0%) | 2,033 (100.0%) |
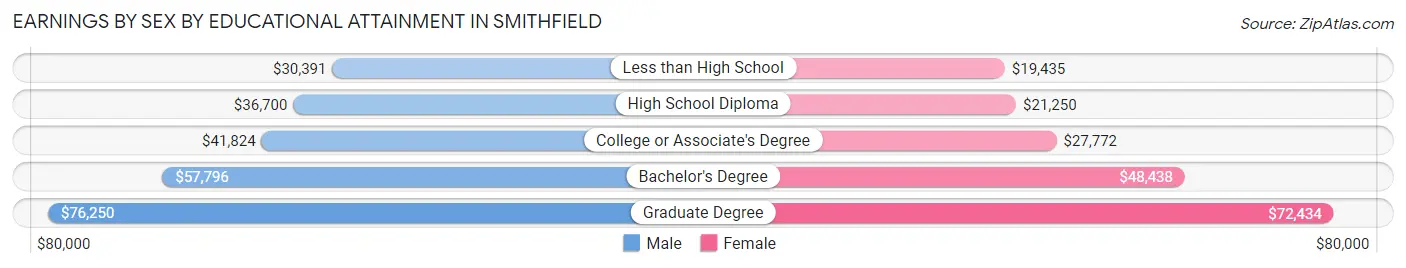
Earnings by Sex by Educational Attainment in Smithfield
Average earnings in Smithfield are $41,623 for men and $29,250 for women, a difference of 29.7%. Men with an educational attainment of graduate degree enjoy the highest average annual earnings of $76,250, while those with less than high school education earn the least with $30,391. Women with an educational attainment of graduate degree earn the most with the average annual earnings of $72,434, while those with less than high school education have the smallest earnings of $19,435.
| Educational Attainment | Male Income | Female Income |
| Less than High School | $30,391 | $19,435 |
| High School Diploma | $36,700 | $21,250 |
| College or Associate's Degree | $41,824 | $27,772 |
| Bachelor's Degree | $57,796 | $48,438 |
| Graduate Degree | $76,250 | $72,434 |
| Total | $41,623 | $29,250 |
Family Income in Smithfield
Family Income Brackets in Smithfield
According to the Smithfield family income data, there are 390 families falling into the $100,000 to $149,999 income range, which is the most common income bracket and makes up 15.8% of all families. Conversely, the less than $10,000 income bracket is the least frequent group with only 124 families (5.0%) belonging to this category.
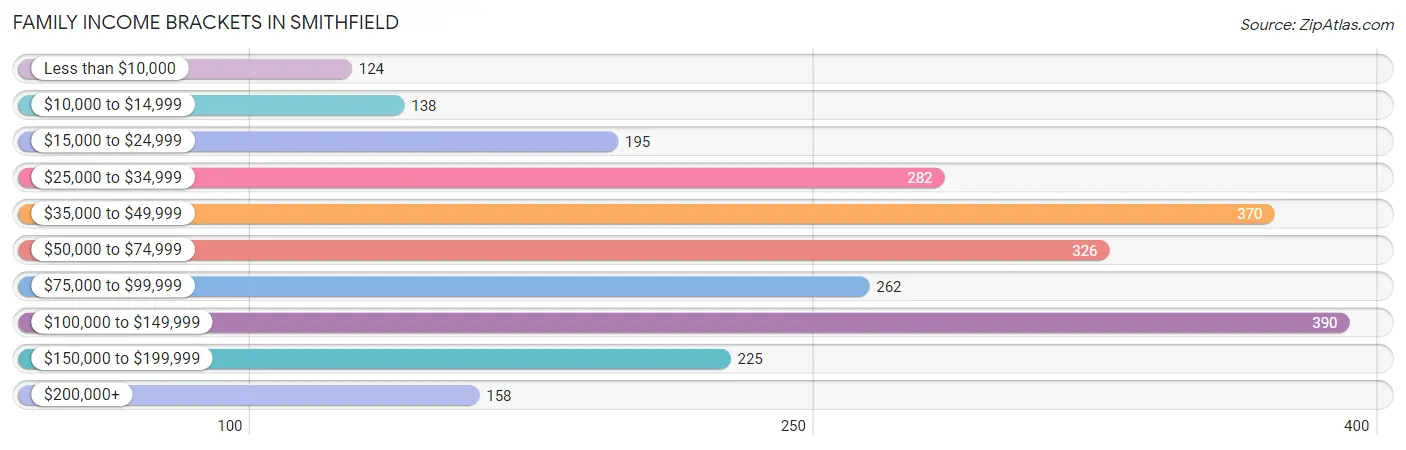
| Income Bracket | # Families | % Families |
| Less than $10,000 | 124 | 5.0% |
| $10,000 to $14,999 | 138 | 5.6% |
| $15,000 to $24,999 | 195 | 7.9% |
| $25,000 to $34,999 | 282 | 11.4% |
| $35,000 to $49,999 | 370 | 15.0% |
| $50,000 to $74,999 | 326 | 13.2% |
| $75,000 to $99,999 | 262 | 10.6% |
| $100,000 to $149,999 | 390 | 15.8% |
| $150,000 to $199,999 | 225 | 9.1% |
| $200,000+ | 158 | 6.4% |
Family Income by Famaliy Size in Smithfield
6-person families (71 | 2.9%) account for the highest median family income in Smithfield with $86,756 per family, while 2-person families (1,211 | 49.0%) have the highest median income of $33,791 per family member.
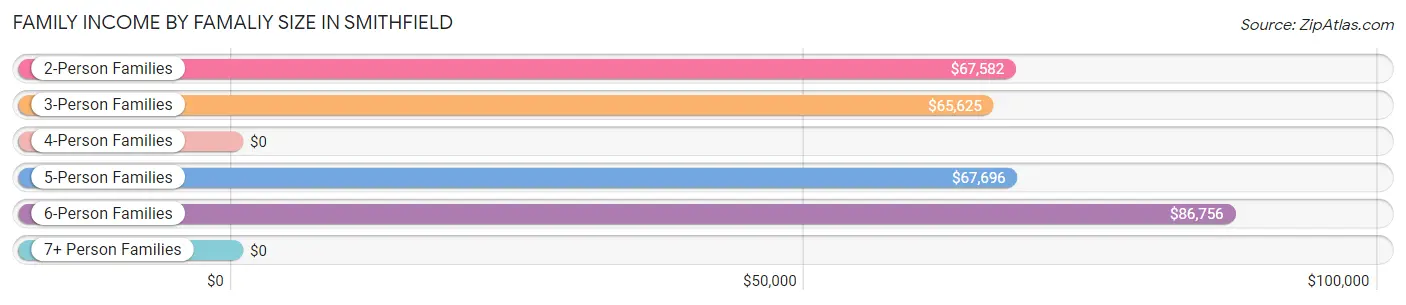
| Income Bracket | # Families | Median Income |
| 2-Person Families | 1,211 (49.0%) | $67,582 |
| 3-Person Families | 502 (20.3%) | $65,625 |
| 4-Person Families | 366 (14.8%) | $0 |
| 5-Person Families | 308 (12.5%) | $67,696 |
| 6-Person Families | 71 (2.9%) | $86,756 |
| 7+ Person Families | 12 (0.5%) | $0 |
| Total | 2,470 (100.0%) | $62,697 |
Family Income by Number of Earners in Smithfield
The median family income in Smithfield is $62,697, with families comprising 3+ earners (174) having the highest median family income of $162,963, while families with no earners (470) have the lowest median family income of $31,058, accounting for 7.0% and 19.0% of families, respectively.
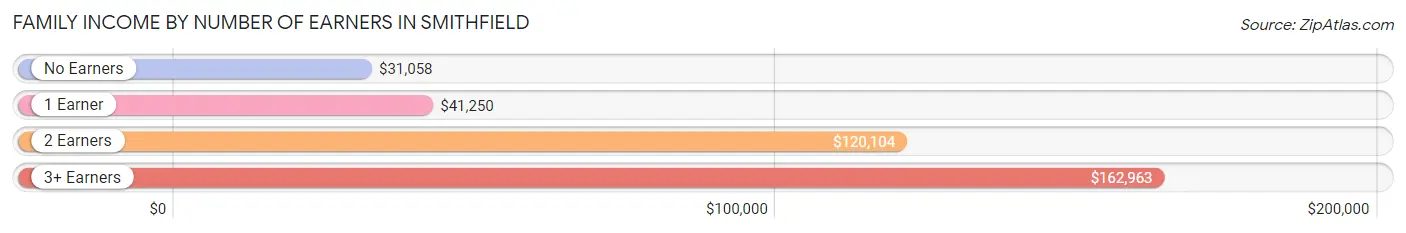
| Number of Earners | # Families | Median Income |
| No Earners | 470 (19.0%) | $31,058 |
| 1 Earner | 936 (37.9%) | $41,250 |
| 2 Earners | 890 (36.0%) | $120,104 |
| 3+ Earners | 174 (7.0%) | $162,963 |
| Total | 2,470 (100.0%) | $62,697 |
Household Income in Smithfield
Household Income Brackets in Smithfield
With 665 households falling in the category, the less than $10,000 income range is the most frequent in Smithfield, accounting for 14.7% of all households. In contrast, only 185 households (4.1%) fall into the $200,000+ income bracket, making it the least populous group.
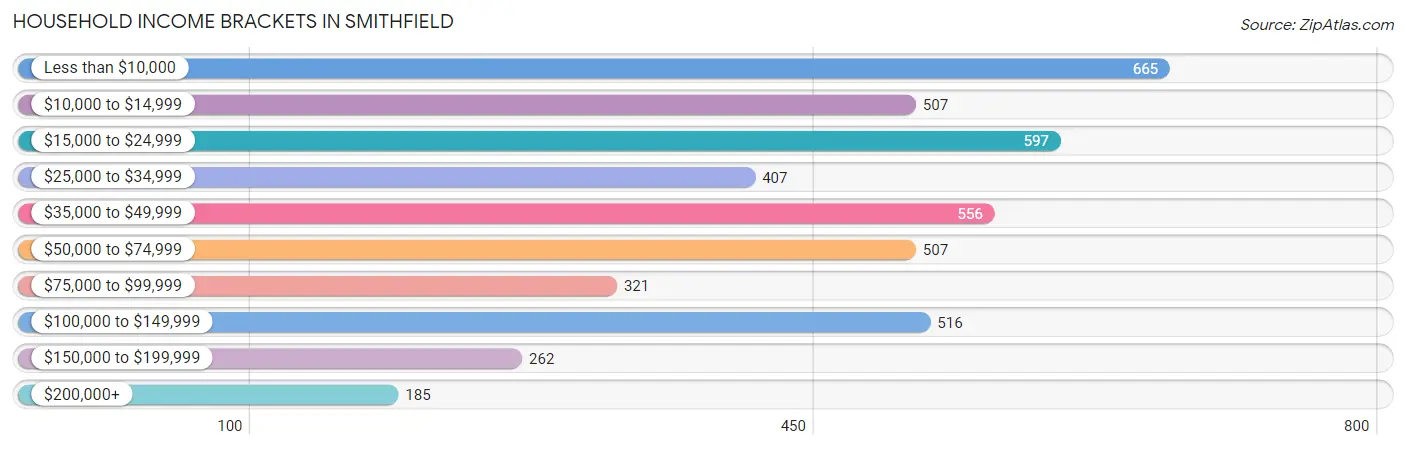
| Income Bracket | # Households | % Households |
| Less than $10,000 | 665 | 14.7% |
| $10,000 to $14,999 | 507 | 11.2% |
| $15,000 to $24,999 | 597 | 13.2% |
| $25,000 to $34,999 | 407 | 9.0% |
| $35,000 to $49,999 | 556 | 12.3% |
| $50,000 to $74,999 | 507 | 11.2% |
| $75,000 to $99,999 | 321 | 7.1% |
| $100,000 to $149,999 | 516 | 11.4% |
| $150,000 to $199,999 | 262 | 5.8% |
| $200,000+ | 185 | 4.1% |
Household Income by Householder Age in Smithfield
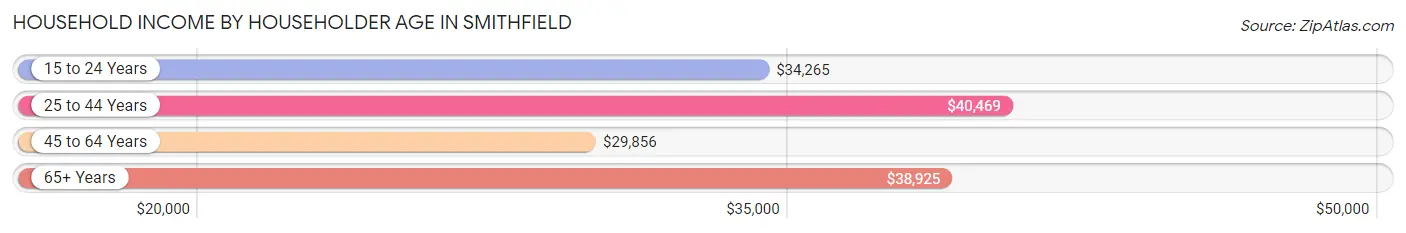
The median household income in Smithfield is $37,000, with the highest median household income of $40,469 found in the 25 to 44 years age bracket for the primary householder. A total of 1,064 households (23.5%) fall into this category. Meanwhile, the 45 to 64 years age bracket for the primary householder has the lowest median household income of $29,856, with 2,037 households (45.0%) in this group.
| Income Bracket | # Households | Median Income |
| 15 to 24 Years | 70 (1.5%) | $34,265 |
| 25 to 44 Years | 1,064 (23.5%) | $40,469 |
| 45 to 64 Years | 2,037 (45.0%) | $29,856 |
| 65+ Years | 1,353 (29.9%) | $38,925 |
| Total | 4,524 (100.0%) | $37,000 |
Poverty in Smithfield
Income Below Poverty by Sex and Age in Smithfield
With 27.1% poverty level for males and 28.5% for females among the residents of Smithfield, 55 to 64 year old males and 35 to 44 year old females are the most vulnerable to poverty, with 589 males (61.1%) and 245 females (46.9%) in their respective age groups living below the poverty level.
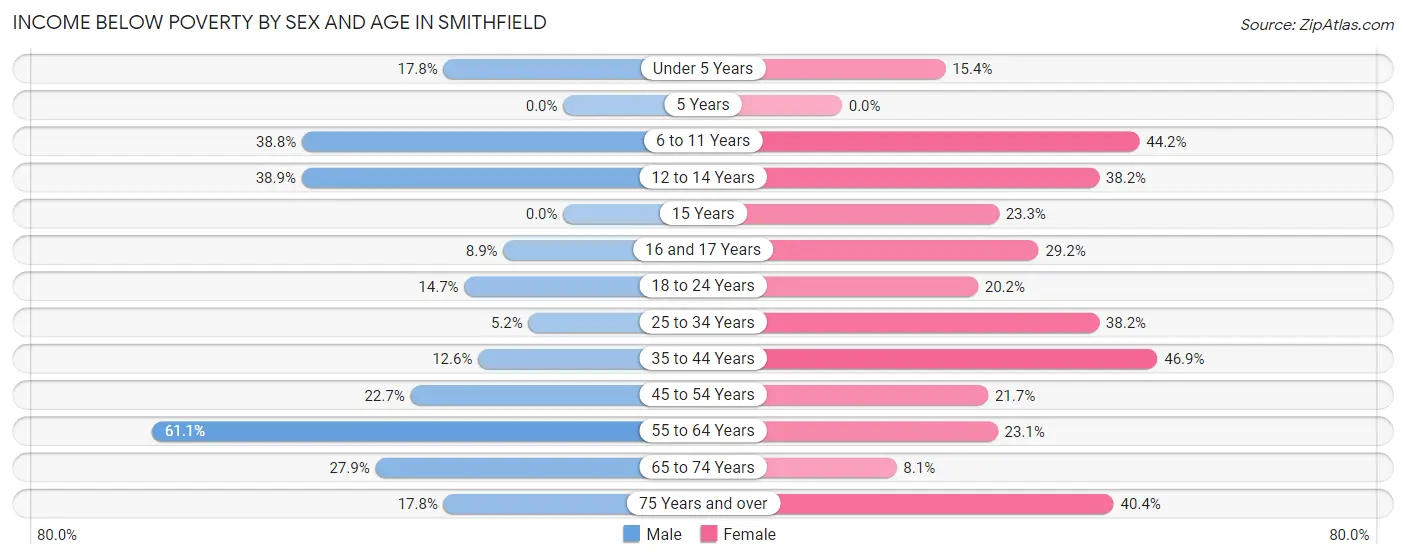
| Age Bracket | Male | Female |
| Under 5 Years | 29 (17.8%) | 45 (15.4%) |
| 5 Years | 0 (0.0%) | 0 (0.0%) |
| 6 to 11 Years | 161 (38.8%) | 194 (44.2%) |
| 12 to 14 Years | 54 (38.9%) | 147 (38.2%) |
| 15 Years | 0 (0.0%) | 24 (23.3%) |
| 16 and 17 Years | 13 (8.9%) | 52 (29.2%) |
| 18 to 24 Years | 72 (14.7%) | 40 (20.2%) |
| 25 to 34 Years | 28 (5.2%) | 265 (38.2%) |
| 35 to 44 Years | 88 (12.6%) | 245 (46.9%) |
| 45 to 54 Years | 158 (22.7%) | 170 (21.7%) |
| 55 to 64 Years | 589 (61.1%) | 180 (23.1%) |
| 65 to 74 Years | 149 (27.9%) | 54 (8.1%) |
| 75 Years and over | 54 (17.8%) | 130 (40.4%) |
| Total | 1,395 (27.1%) | 1,546 (28.5%) |
Income Above Poverty by Sex and Age in Smithfield
According to the poverty statistics in Smithfield, males aged 5 years and females aged 5 years are the age groups that are most secure financially, with 100.0% of males and 100.0% of females in these age groups living above the poverty line.
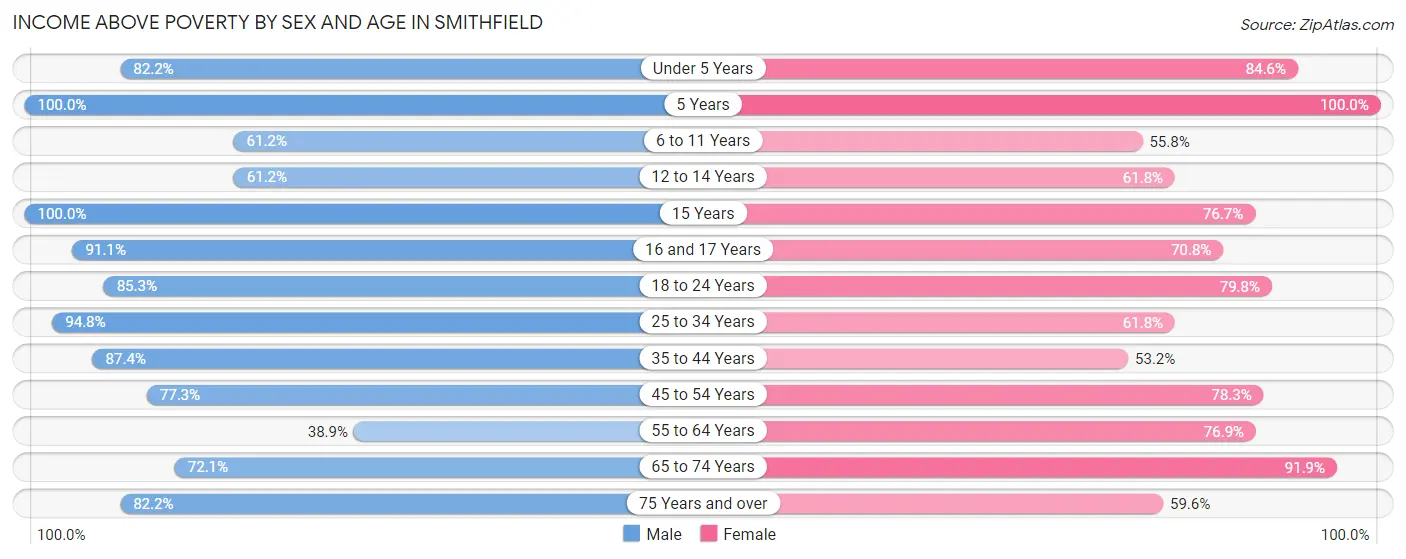
| Age Bracket | Male | Female |
| Under 5 Years | 134 (82.2%) | 248 (84.6%) |
| 5 Years | 53 (100.0%) | 64 (100.0%) |
| 6 to 11 Years | 254 (61.2%) | 245 (55.8%) |
| 12 to 14 Years | 85 (61.2%) | 238 (61.8%) |
| 15 Years | 11 (100.0%) | 79 (76.7%) |
| 16 and 17 Years | 133 (91.1%) | 126 (70.8%) |
| 18 to 24 Years | 418 (85.3%) | 158 (79.8%) |
| 25 to 34 Years | 515 (94.8%) | 429 (61.8%) |
| 35 to 44 Years | 608 (87.4%) | 278 (53.1%) |
| 45 to 54 Years | 538 (77.3%) | 613 (78.3%) |
| 55 to 64 Years | 375 (38.9%) | 598 (76.9%) |
| 65 to 74 Years | 385 (72.1%) | 612 (91.9%) |
| 75 Years and over | 250 (82.2%) | 192 (59.6%) |
| Total | 3,759 (72.9%) | 3,880 (71.5%) |
Income Below Poverty Among Married-Couple Families in Smithfield
The poverty statistics for married-couple families in Smithfield show that 14.2% or 220 of the total 1,547 families live below the poverty line. Families with 1 or 2 children have the highest poverty rate of 26.4%, comprising of 110 families. On the other hand, families with no children have the lowest poverty rate of 8.3%, which includes 73 families.
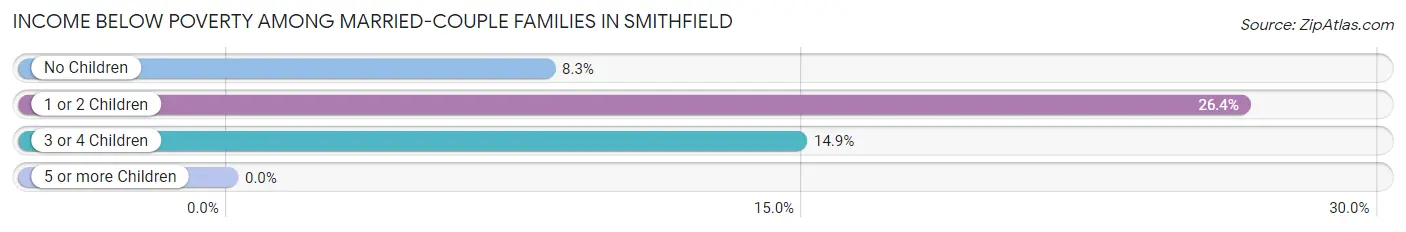
| Children | Above Poverty | Below Poverty |
| No Children | 809 (91.7%) | 73 (8.3%) |
| 1 or 2 Children | 306 (73.6%) | 110 (26.4%) |
| 3 or 4 Children | 212 (85.1%) | 37 (14.9%) |
| 5 or more Children | 0 (0.0%) | 0 (0.0%) |
| Total | 1,327 (85.8%) | 220 (14.2%) |
Income Below Poverty Among Single-Parent Households in Smithfield
According to the poverty data in Smithfield, 21.9% or 50 single-father households and 39.7% or 276 single-mother households are living below the poverty line. Among single-father households, those with no children have the highest poverty rate, with 50 households (67.6%) experiencing poverty. Likewise, among single-mother households, those with 1 or 2 children have the highest poverty rate, with 196 households (62.8%) falling below the poverty line.
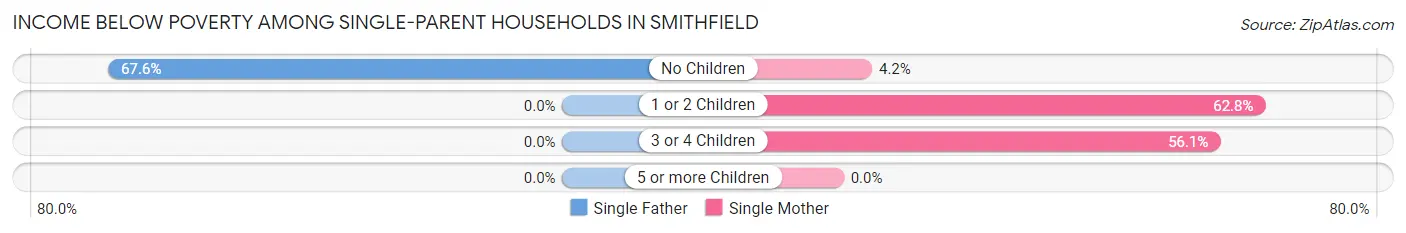
| Children | Single Father | Single Mother |
| No Children | 50 (67.6%) | 11 (4.2%) |
| 1 or 2 Children | 0 (0.0%) | 196 (62.8%) |
| 3 or 4 Children | 0 (0.0%) | 69 (56.1%) |
| 5 or more Children | 0 (0.0%) | 0 (0.0%) |
| Total | 50 (21.9%) | 276 (39.7%) |
Income Below Poverty Among Married-Couple vs Single-Parent Households in Smithfield
The poverty data for Smithfield shows that 220 of the married-couple family households (14.2%) and 326 of the single-parent households (35.3%) are living below the poverty level. Within the married-couple family households, those with 1 or 2 children have the highest poverty rate, with 110 households (26.4%) falling below the poverty line. Among the single-parent households, those with 3 or 4 children have the highest poverty rate, with 69 household (56.1%) living below poverty.
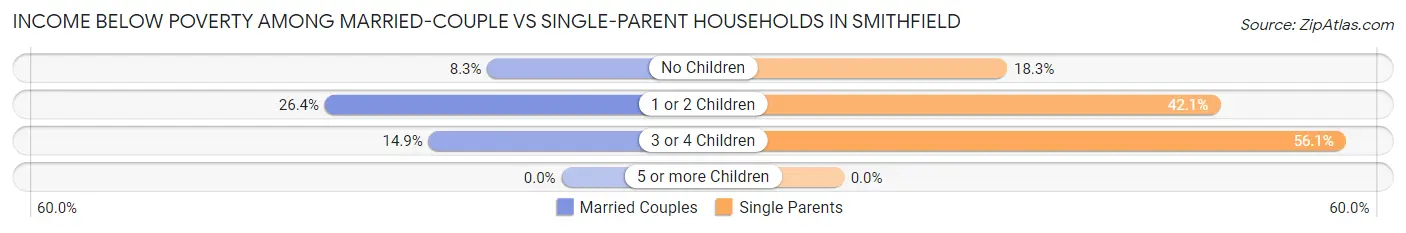
| Children | Married-Couple Families | Single-Parent Households |
| No Children | 73 (8.3%) | 61 (18.3%) |
| 1 or 2 Children | 110 (26.4%) | 196 (42.1%) |
| 3 or 4 Children | 37 (14.9%) | 69 (56.1%) |
| 5 or more Children | 0 (0.0%) | 0 (0.0%) |
| Total | 220 (14.2%) | 326 (35.3%) |
Race in Smithfield
The most populous races in Smithfield are White / Caucasian (6,755 | 58.6%), Black / African American (3,404 | 29.5%), and Hispanic or Latino (2,034 | 17.6%).
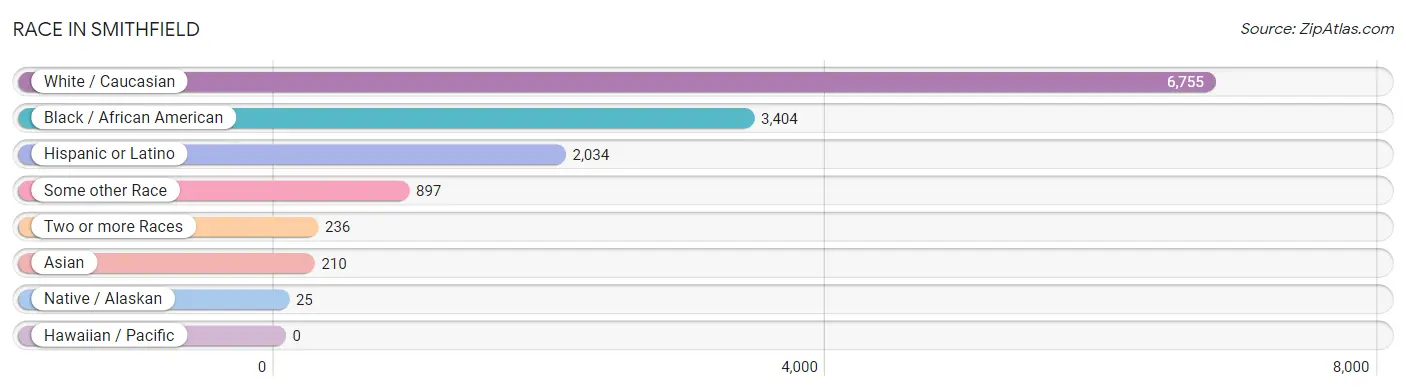
| Race | # Population | % Population |
| Asian | 210 | 1.8% |
| Black / African American | 3,404 | 29.5% |
| Hawaiian / Pacific | 0 | 0.0% |
| Hispanic or Latino | 2,034 | 17.6% |
| Native / Alaskan | 25 | 0.2% |
| White / Caucasian | 6,755 | 58.6% |
| Two or more Races | 236 | 2.1% |
| Some other Race | 897 | 7.8% |
| Total | 11,527 | 100.0% |
Ancestry in Smithfield
The most populous ancestries reported in Smithfield are English (1,685 | 14.6%), American (1,186 | 10.3%), Mexican (1,157 | 10.0%), Irish (908 | 7.9%), and German (737 | 6.4%), together accounting for 49.2% of all Smithfield residents.
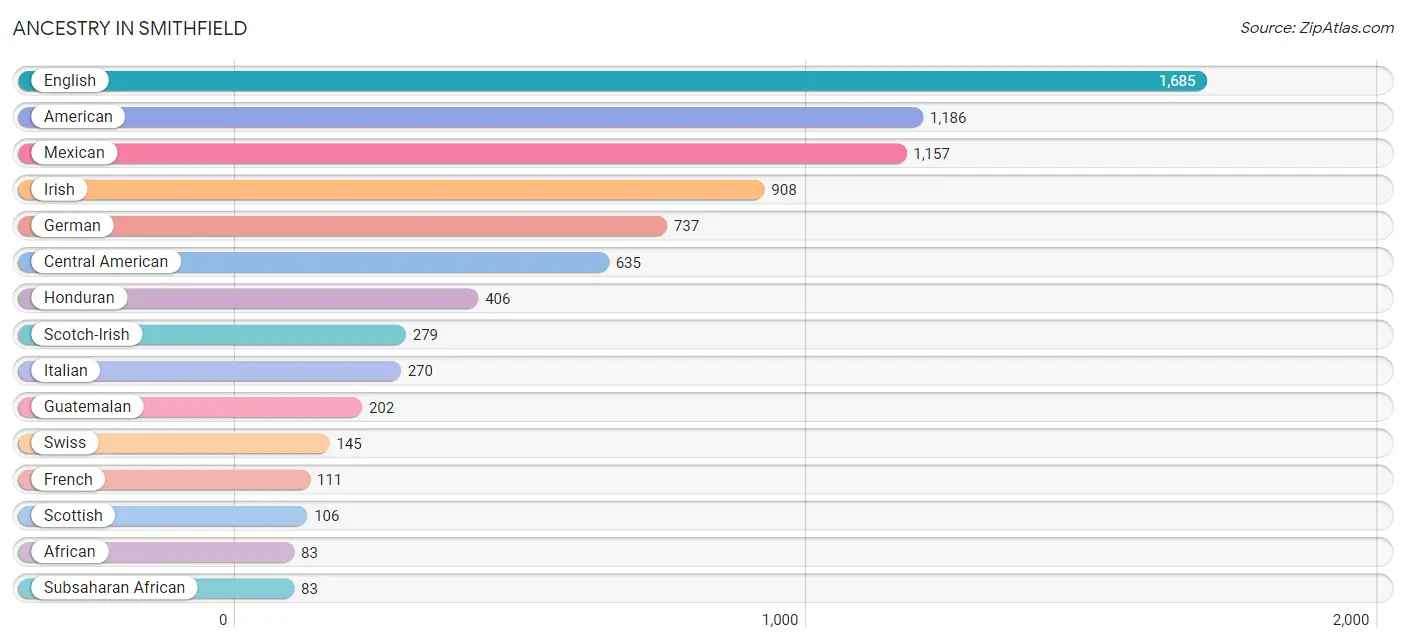
| Ancestry | # Population | % Population |
| African | 83 | 0.7% |
| American | 1,186 | 10.3% |
| Austrian | 53 | 0.5% |
| Barbadian | 5 | 0.0% |
| Belgian | 10 | 0.1% |
| British | 63 | 0.5% |
| Burmese | 54 | 0.5% |
| Canadian | 30 | 0.3% |
| Central American | 635 | 5.5% |
| Cherokee | 45 | 0.4% |
| Cuban | 63 | 0.5% |
| Danish | 17 | 0.2% |
| Dominican | 60 | 0.5% |
| Dutch | 6 | 0.1% |
| Eastern European | 41 | 0.4% |
| English | 1,685 | 14.6% |
| European | 51 | 0.4% |
| French | 111 | 1.0% |
| French Canadian | 11 | 0.1% |
| German | 737 | 6.4% |
| Guatemalan | 202 | 1.8% |
| Honduran | 406 | 3.5% |
| Hungarian | 32 | 0.3% |
| Indian (Asian) | 41 | 0.4% |
| Irish | 908 | 7.9% |
| Israeli | 1 | 0.0% |
| Italian | 270 | 2.3% |
| Korean | 59 | 0.5% |
| Mexican | 1,157 | 10.0% |
| Norwegian | 17 | 0.2% |
| Polish | 7 | 0.1% |
| Puerto Rican | 27 | 0.2% |
| Salvadoran | 27 | 0.2% |
| Scotch-Irish | 279 | 2.4% |
| Scottish | 106 | 0.9% |
| Slovak | 32 | 0.3% |
| South American | 22 | 0.2% |
| Spaniard | 11 | 0.1% |
| Sri Lankan | 5 | 0.0% |
| Subsaharan African | 83 | 0.7% |
| Swedish | 19 | 0.2% |
| Swiss | 145 | 1.3% |
| Uruguayan | 22 | 0.2% | View All 43 Rows |
Immigrants in Smithfield
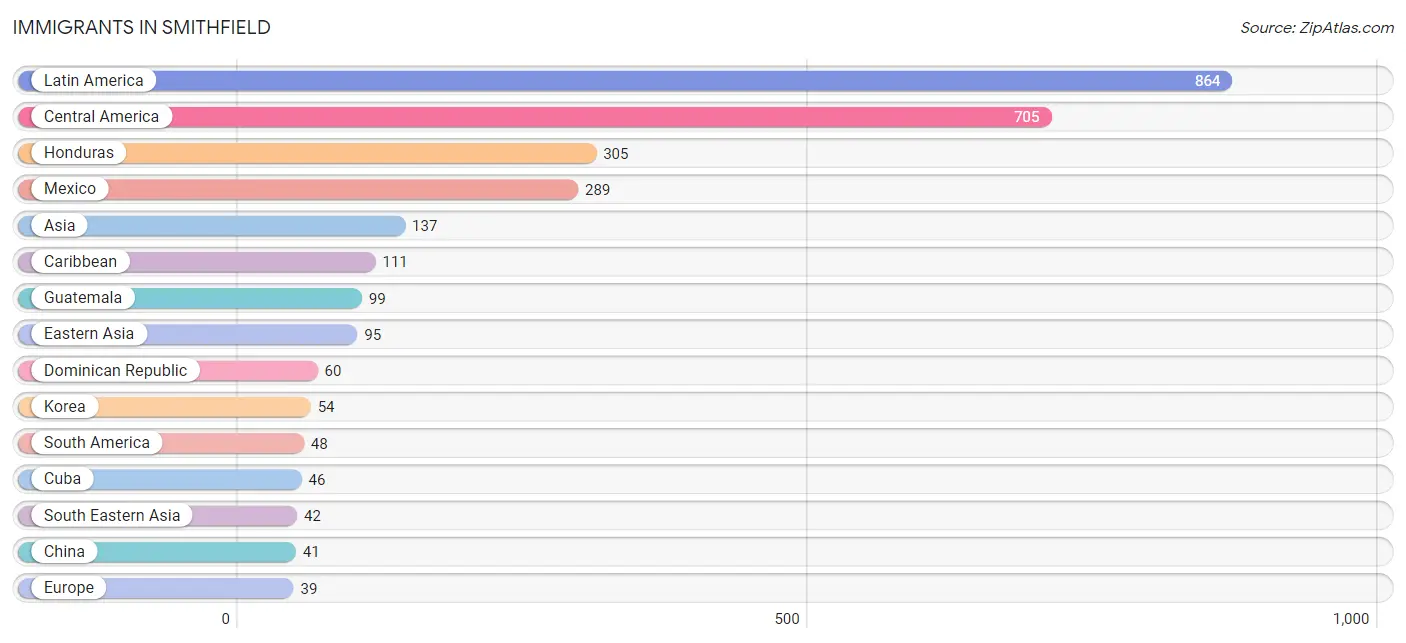
The most numerous immigrant groups reported in Smithfield came from Latin America (864 | 7.5%), Central America (705 | 6.1%), Honduras (305 | 2.6%), Mexico (289 | 2.5%), and Asia (137 | 1.2%), together accounting for 20.0% of all Smithfield residents.
| Immigration Origin | # Population | % Population |
| Asia | 137 | 1.2% |
| Barbados | 5 | 0.0% |
| Belgium | 10 | 0.1% |
| Caribbean | 111 | 1.0% |
| Central America | 705 | 6.1% |
| China | 41 | 0.4% |
| Colombia | 26 | 0.2% |
| Cuba | 46 | 0.4% |
| Dominican Republic | 60 | 0.5% |
| Eastern Asia | 95 | 0.8% |
| El Salvador | 12 | 0.1% |
| Europe | 39 | 0.3% |
| Germany | 15 | 0.1% |
| Guatemala | 99 | 0.9% |
| Honduras | 305 | 2.6% |
| Korea | 54 | 0.5% |
| Latin America | 864 | 7.5% |
| Mexico | 289 | 2.5% |
| Northern Europe | 14 | 0.1% |
| Philippines | 37 | 0.3% |
| South America | 48 | 0.4% |
| South Eastern Asia | 42 | 0.4% |
| Uruguay | 22 | 0.2% |
| Vietnam | 5 | 0.0% |
| Western Europe | 25 | 0.2% | View All 25 Rows |
Sex and Age in Smithfield
Sex and Age in Smithfield
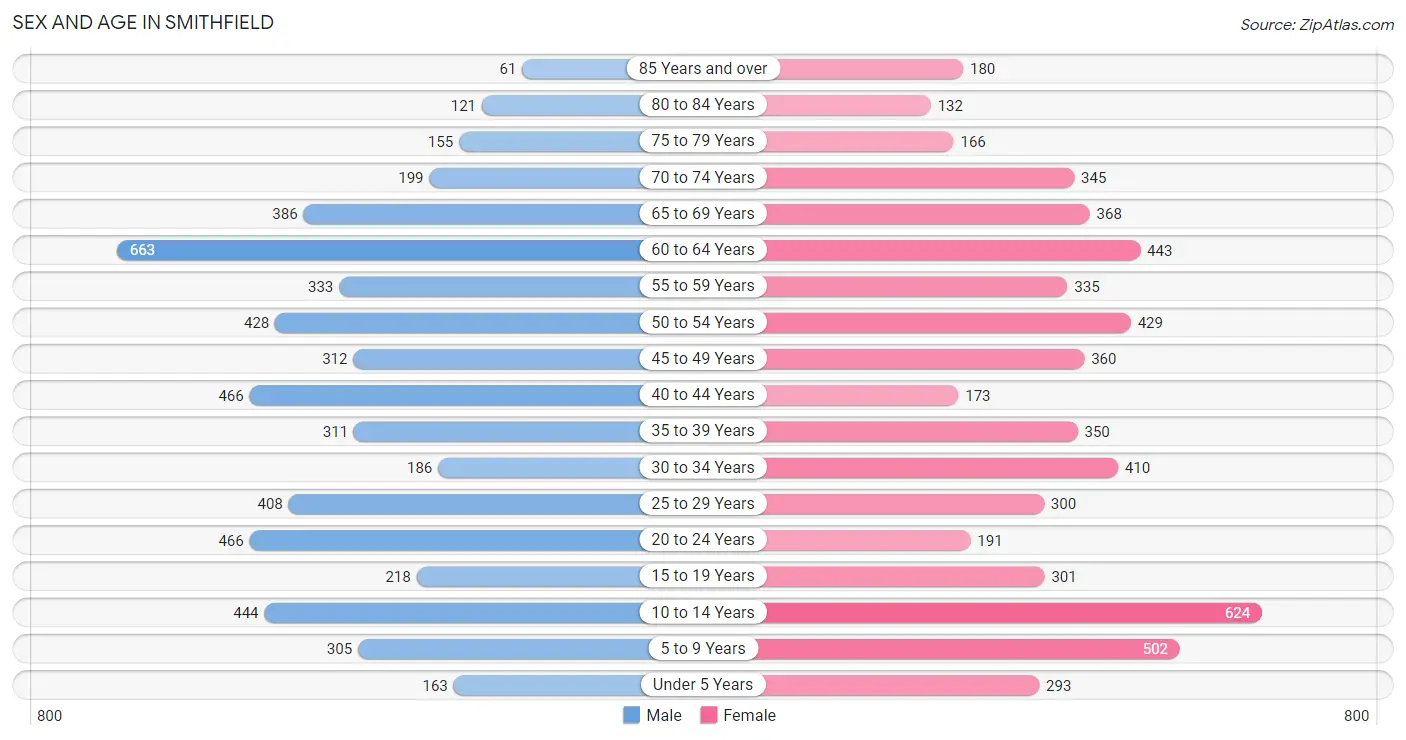
The most populous age groups in Smithfield are 60 to 64 Years (663 | 11.8%) for men and 10 to 14 Years (624 | 10.6%) for women.
| Age Bracket | Male | Female |
| Under 5 Years | 163 (2.9%) | 293 (5.0%) |
| 5 to 9 Years | 305 (5.4%) | 502 (8.5%) |
| 10 to 14 Years | 444 (7.9%) | 624 (10.6%) |
| 15 to 19 Years | 218 (3.9%) | 301 (5.1%) |
| 20 to 24 Years | 466 (8.3%) | 191 (3.2%) |
| 25 to 29 Years | 408 (7.2%) | 300 (5.1%) |
| 30 to 34 Years | 186 (3.3%) | 410 (7.0%) |
| 35 to 39 Years | 311 (5.5%) | 350 (5.9%) |
| 40 to 44 Years | 466 (8.3%) | 173 (2.9%) |
| 45 to 49 Years | 312 (5.6%) | 360 (6.1%) |
| 50 to 54 Years | 428 (7.6%) | 429 (7.3%) |
| 55 to 59 Years | 333 (5.9%) | 335 (5.7%) |
| 60 to 64 Years | 663 (11.8%) | 443 (7.5%) |
| 65 to 69 Years | 386 (6.9%) | 368 (6.2%) |
| 70 to 74 Years | 199 (3.5%) | 345 (5.9%) |
| 75 to 79 Years | 155 (2.8%) | 166 (2.8%) |
| 80 to 84 Years | 121 (2.1%) | 132 (2.2%) |
| 85 Years and over | 61 (1.1%) | 180 (3.0%) |
| Total | 5,625 (100.0%) | 5,902 (100.0%) |
Families and Households in Smithfield
Median Family Size in Smithfield
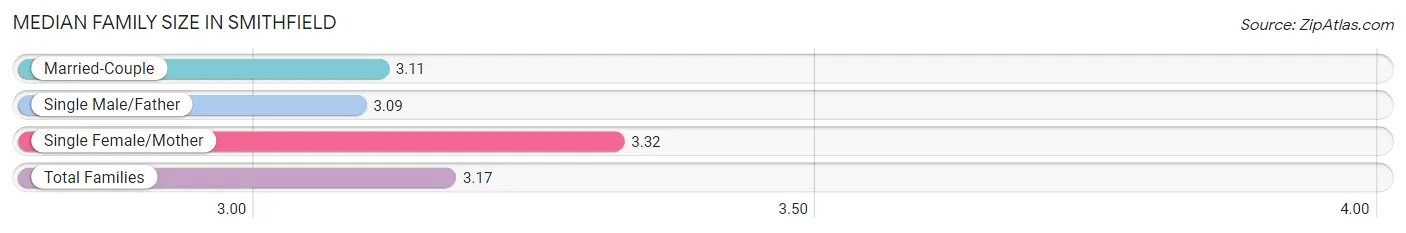
The median family size in Smithfield is 3.17 persons per family, with single female/mother families (695 | 28.1%) accounting for the largest median family size of 3.32 persons per family. On the other hand, single male/father families (228 | 9.2%) represent the smallest median family size with 3.09 persons per family.
| Family Type | # Families | Family Size |
| Married-Couple | 1,547 (62.6%) | 3.11 |
| Single Male/Father | 228 (9.2%) | 3.09 |
| Single Female/Mother | 695 (28.1%) | 3.32 |
| Total Families | 2,470 (100.0%) | 3.17 |
Median Household Size in Smithfield
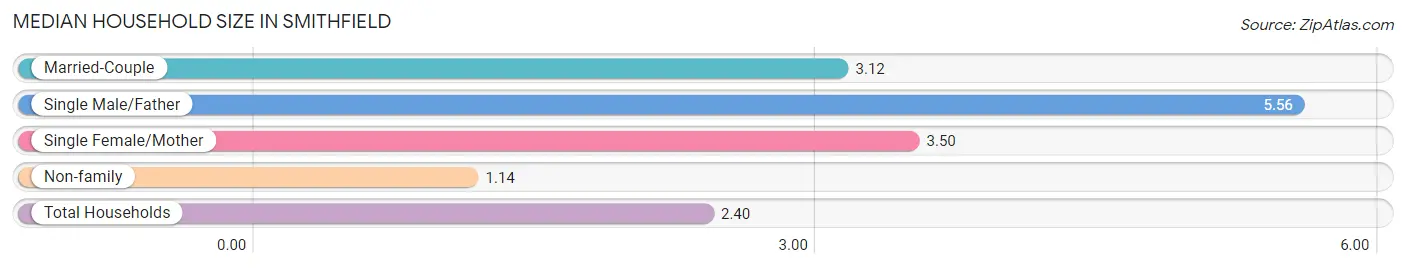
The median household size in Smithfield is 2.40 persons per household, with single male/father households (228 | 5.0%) accounting for the largest median household size of 5.56 persons per household. non-family households (2,054 | 45.4%) represent the smallest median household size with 1.14 persons per household.
| Household Type | # Households | Household Size |
| Married-Couple | 1,547 (34.2%) | 3.12 |
| Single Male/Father | 228 (5.0%) | 5.56 |
| Single Female/Mother | 695 (15.4%) | 3.50 |
| Non-family | 2,054 (45.4%) | 1.14 |
| Total Households | 4,524 (100.0%) | 2.40 |
Household Size by Marriage Status in Smithfield
Out of a total of 4,524 households in Smithfield, 2,470 (54.6%) are family households, while 2,054 (45.4%) are nonfamily households. The most numerous type of family households are 2-person households, comprising 1,140, and the most common type of nonfamily households are 1-person households, comprising 1,844.
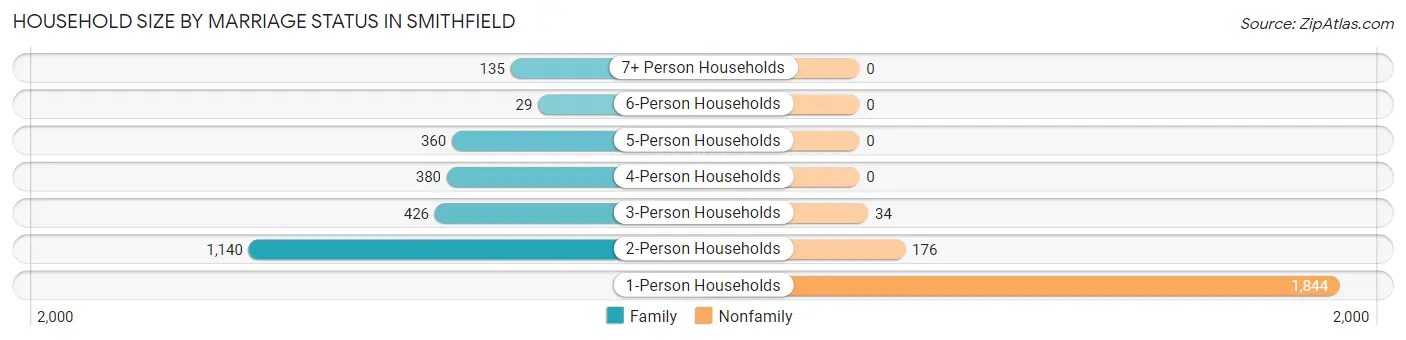
| Household Size | Family Households | Nonfamily Households |
| 1-Person Households | - | 1,844 (40.8%) |
| 2-Person Households | 1,140 (25.2%) | 176 (3.9%) |
| 3-Person Households | 426 (9.4%) | 34 (0.7%) |
| 4-Person Households | 380 (8.4%) | 0 (0.0%) |
| 5-Person Households | 360 (8.0%) | 0 (0.0%) |
| 6-Person Households | 29 (0.6%) | 0 (0.0%) |
| 7+ Person Households | 135 (3.0%) | 0 (0.0%) |
| Total | 2,470 (54.6%) | 2,054 (45.4%) |
Female Fertility in Smithfield
Fertility by Age in Smithfield
Average fertility rate in Smithfield is 9.0 births per 1,000 women. Women in the age bracket of 20 to 34 years have the highest fertility rate with 21.0 births per 1,000 women. Women in the age bracket of 20 to 34 years acount for 100.0% of all women with births.
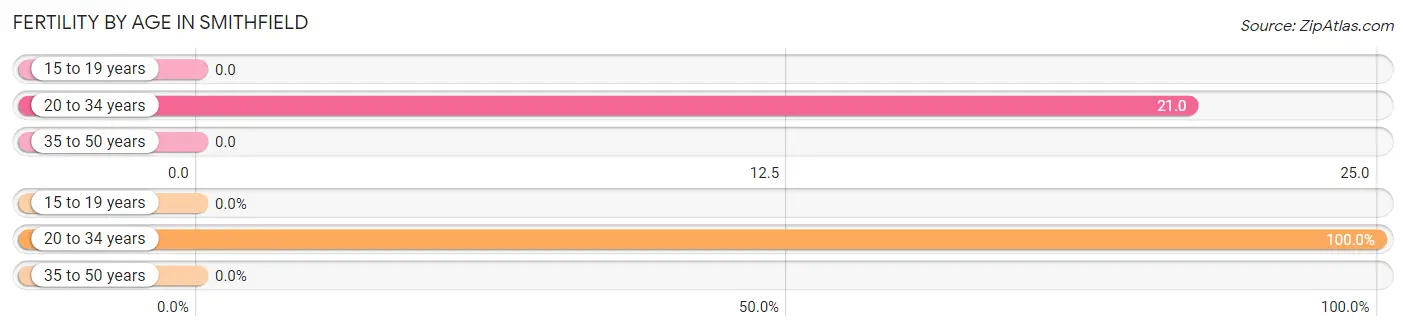
| Age Bracket | Women with Births | Births / 1,000 Women |
| 15 to 19 years | 0 (0.0%) | 0.0 |
| 20 to 34 years | 19 (100.0%) | 21.0 |
| 35 to 50 years | 0 (0.0%) | 0.0 |
| Total | 19 (100.0%) | 9.0 |
Fertility by Age by Marriage Status in Smithfield
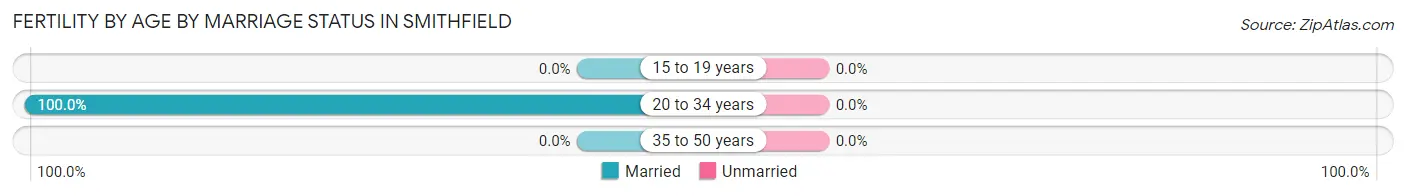
| Age Bracket | Married | Unmarried |
| 15 to 19 years | 0 (0.0%) | 0 (0.0%) |
| 20 to 34 years | 19 (100.0%) | 0 (0.0%) |
| 35 to 50 years | 0 (0.0%) | 0 (0.0%) |
| Total | 19 (100.0%) | 0 (0.0%) |
Fertility by Education in Smithfield
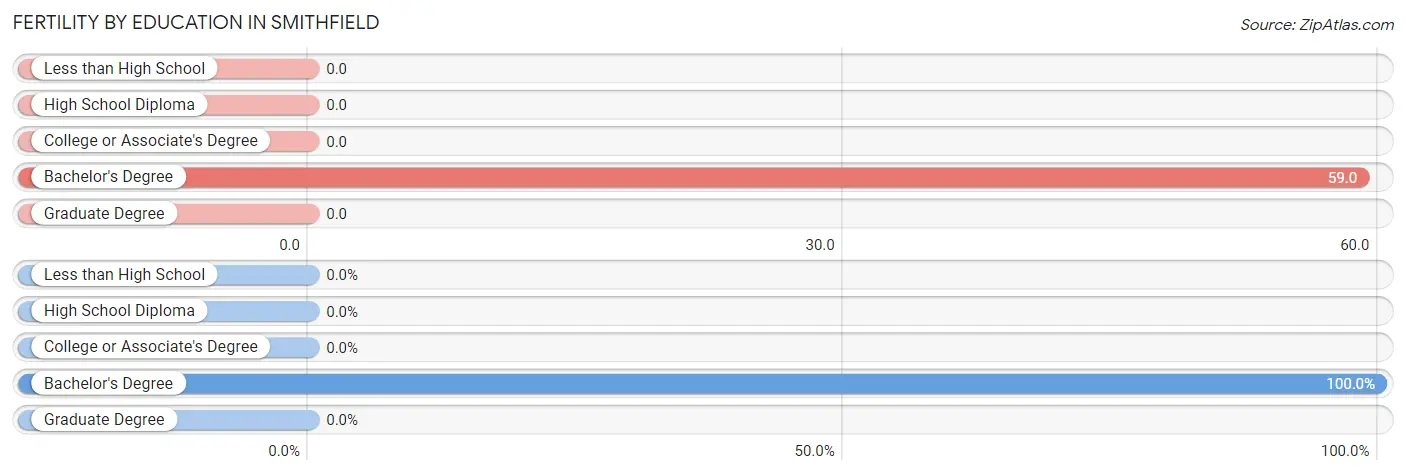
| Educational Attainment | Women with Births | Births / 1,000 Women |
| Less than High School | 0 (0.0%) | 0.0 |
| High School Diploma | 0 (0.0%) | 0.0 |
| College or Associate's Degree | 0 (0.0%) | 0.0 |
| Bachelor's Degree | 19 (100.0%) | 59.0 |
| Graduate Degree | 0 (0.0%) | 0.0 |
| Total | 19 (100.0%) | 9.0 |
Fertility by Education by Marriage Status in Smithfield
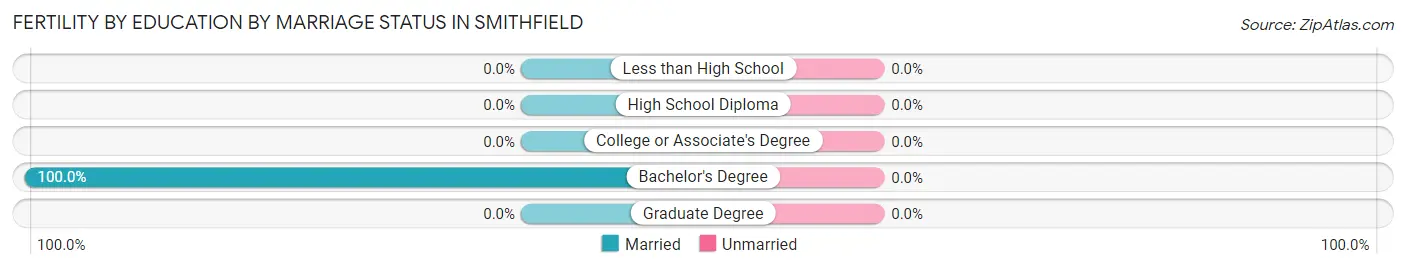
| Educational Attainment | Married | Unmarried |
| Less than High School | 0 (0.0%) | 0 (0.0%) |
| High School Diploma | 0 (0.0%) | 0 (0.0%) |
| College or Associate's Degree | 0 (0.0%) | 0 (0.0%) |
| Bachelor's Degree | 19 (100.0%) | 0 (0.0%) |
| Graduate Degree | 0 (0.0%) | 0 (0.0%) |
| Total | 19 (100.0%) | 0 (0.0%) |
Employment Characteristics in Smithfield
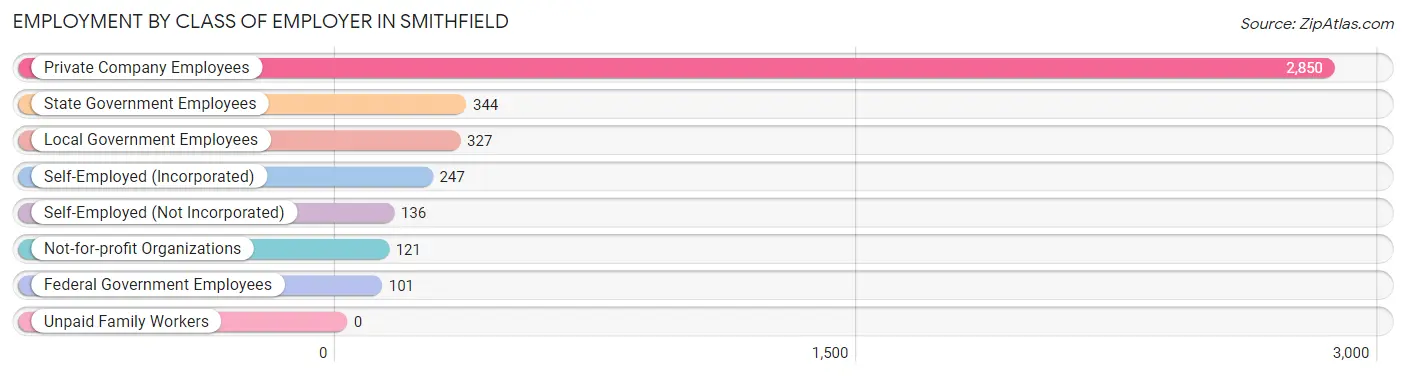
Employment by Class of Employer in Smithfield
Among the 4,126 employed individuals in Smithfield, private company employees (2,850 | 69.1%), state government employees (344 | 8.3%), and local government employees (327 | 7.9%) make up the most common classes of employment.
| Employer Class | # Employees | % Employees |
| Private Company Employees | 2,850 | 69.1% |
| Self-Employed (Incorporated) | 247 | 6.0% |
| Self-Employed (Not Incorporated) | 136 | 3.3% |
| Not-for-profit Organizations | 121 | 2.9% |
| Local Government Employees | 327 | 7.9% |
| State Government Employees | 344 | 8.3% |
| Federal Government Employees | 101 | 2.5% |
| Unpaid Family Workers | 0 | 0.0% |
| Total | 4,126 | 100.0% |
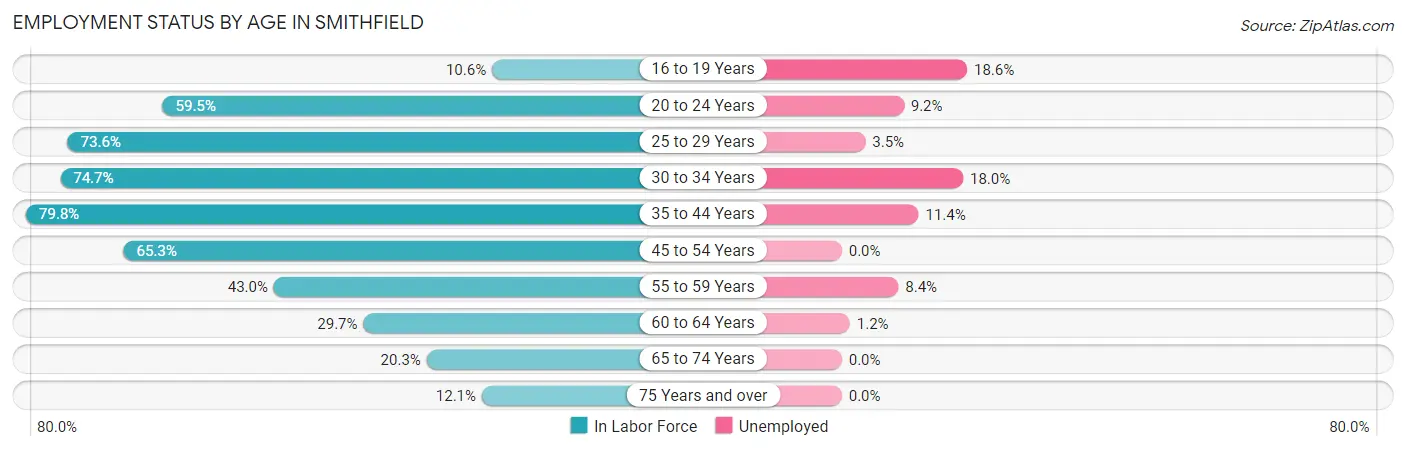
Employment Status by Age in Smithfield
According to the labor force statistics for Smithfield, out of the total population over 16 years of age (9,082), 48.6% or 4,414 individuals are in the labor force, with 6.5% or 287 of them unemployed. The age group with the highest labor force participation rate is 35 to 44 years, with 79.8% or 1,037 individuals in the labor force. Within the labor force, the 16 to 19 years age range has the highest percentage of unemployed individuals, with 18.6% or 8 of them being unemployed.
| Age Bracket | In Labor Force | Unemployed |
| 16 to 19 Years | 43 (10.6%) | 8 (18.6%) |
| 20 to 24 Years | 391 (59.5%) | 36 (9.2%) |
| 25 to 29 Years | 521 (73.6%) | 18 (3.5%) |
| 30 to 34 Years | 445 (74.7%) | 80 (18.0%) |
| 35 to 44 Years | 1,037 (79.8%) | 118 (11.4%) |
| 45 to 54 Years | 998 (65.3%) | 0 (0.0%) |
| 55 to 59 Years | 287 (43.0%) | 24 (8.4%) |
| 60 to 64 Years | 328 (29.7%) | 4 (1.2%) |
| 65 to 74 Years | 263 (20.3%) | 0 (0.0%) |
| 75 Years and over | 99 (12.1%) | 0 (0.0%) |
| Total | 4,414 (48.6%) | 287 (6.5%) |
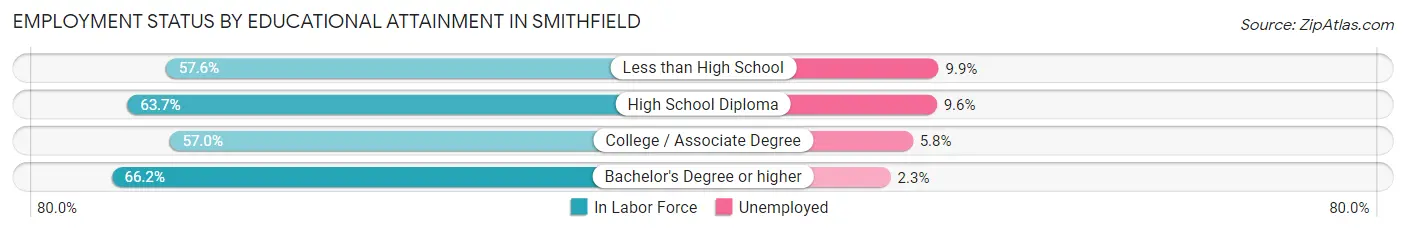
Employment Status by Educational Attainment in Smithfield
According to labor force statistics for Smithfield, 61.2% of individuals (3,615) out of the total population between 25 and 64 years of age (5,907) are in the labor force, with 6.7% or 242 of them being unemployed. The group with the highest labor force participation rate are those with the educational attainment of bachelor's degree or higher, with 66.2% or 969 individuals in the labor force. Within the labor force, individuals with less than high school education have the highest percentage of unemployment, with 9.9% or 68 of them being unemployed.
| Educational Attainment | In Labor Force | Unemployed |
| Less than High School | 684 (57.6%) | 118 (9.9%) |
| High School Diploma | 1,038 (63.7%) | 156 (9.6%) |
| College / Associate Degree | 927 (57.0%) | 94 (5.8%) |
| Bachelor's Degree or higher | 969 (66.2%) | 34 (2.3%) |
| Total | 3,615 (61.2%) | 396 (6.7%) |
Employment Occupations by Sex in Smithfield
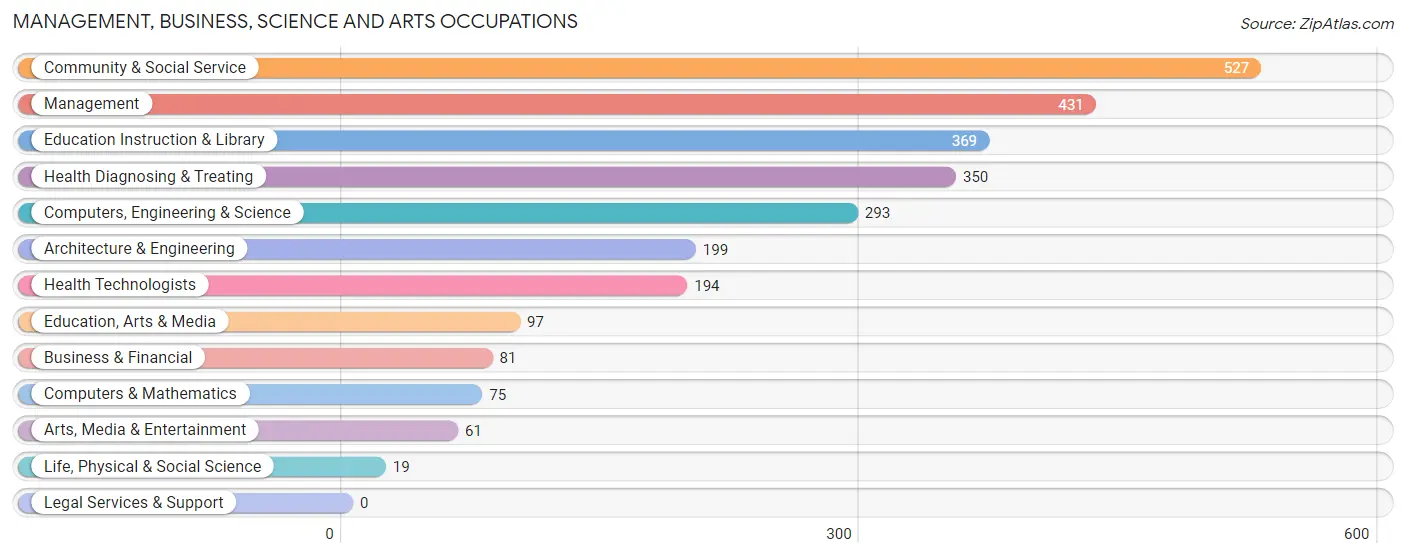
Management, Business, Science and Arts Occupations
The most common Management, Business, Science and Arts occupations in Smithfield are Community & Social Service (527 | 12.8%), Management (431 | 10.5%), Education Instruction & Library (369 | 9.0%), Health Diagnosing & Treating (350 | 8.5%), and Computers, Engineering & Science (293 | 7.1%).
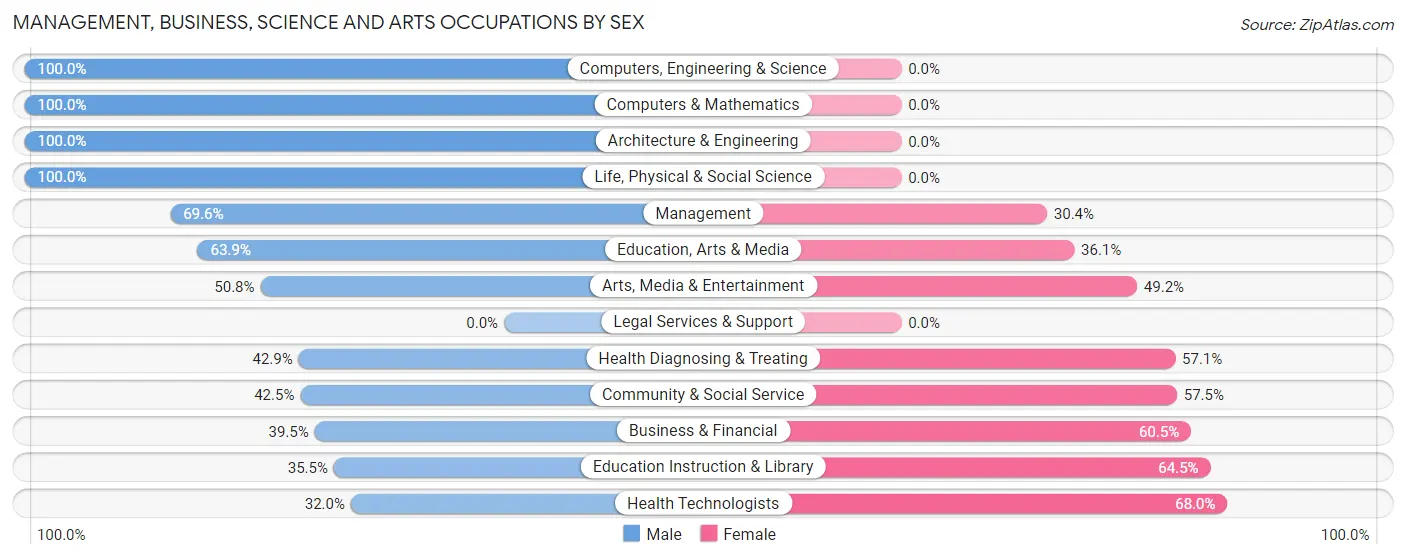
Management, Business, Science and Arts Occupations by Sex
Within the Management, Business, Science and Arts occupations in Smithfield, the most male-oriented occupations are Computers, Engineering & Science (100.0%), Computers & Mathematics (100.0%), and Architecture & Engineering (100.0%), while the most female-oriented occupations are Health Technologists (68.0%), Education Instruction & Library (64.5%), and Business & Financial (60.5%).
| Occupation | Male | Female |
| Management | 300 (69.6%) | 131 (30.4%) |
| Business & Financial | 32 (39.5%) | 49 (60.5%) |
| Computers, Engineering & Science | 293 (100.0%) | 0 (0.0%) |
| Computers & Mathematics | 75 (100.0%) | 0 (0.0%) |
| Architecture & Engineering | 199 (100.0%) | 0 (0.0%) |
| Life, Physical & Social Science | 19 (100.0%) | 0 (0.0%) |
| Community & Social Service | 224 (42.5%) | 303 (57.5%) |
| Education, Arts & Media | 62 (63.9%) | 35 (36.1%) |
| Legal Services & Support | 0 (0.0%) | 0 (0.0%) |
| Education Instruction & Library | 131 (35.5%) | 238 (64.5%) |
| Arts, Media & Entertainment | 31 (50.8%) | 30 (49.2%) |
| Health Diagnosing & Treating | 150 (42.9%) | 200 (57.1%) |
| Health Technologists | 62 (32.0%) | 132 (68.0%) |
| Total (Category) | 999 (59.4%) | 683 (40.6%) |
| Total (Overall) | 2,389 (58.0%) | 1,728 (42.0%) |
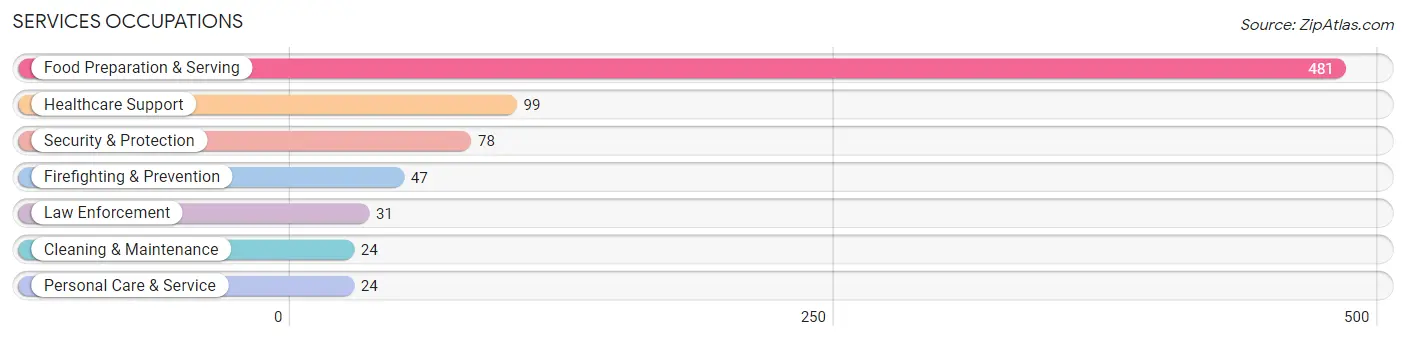
Services Occupations
The most common Services occupations in Smithfield are Food Preparation & Serving (481 | 11.7%), Healthcare Support (99 | 2.4%), Security & Protection (78 | 1.9%), Firefighting & Prevention (47 | 1.1%), and Law Enforcement (31 | 0.7%).
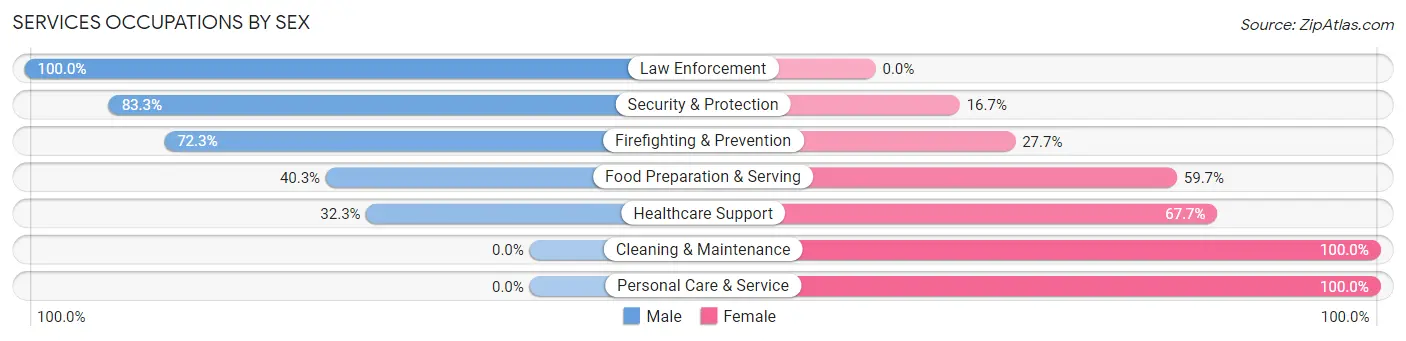
Services Occupations by Sex
Within the Services occupations in Smithfield, the most male-oriented occupations are Law Enforcement (100.0%), Security & Protection (83.3%), and Firefighting & Prevention (72.3%), while the most female-oriented occupations are Cleaning & Maintenance (100.0%), Personal Care & Service (100.0%), and Healthcare Support (67.7%).
| Occupation | Male | Female |
| Healthcare Support | 32 (32.3%) | 67 (67.7%) |
| Security & Protection | 65 (83.3%) | 13 (16.7%) |
| Firefighting & Prevention | 34 (72.3%) | 13 (27.7%) |
| Law Enforcement | 31 (100.0%) | 0 (0.0%) |
| Food Preparation & Serving | 194 (40.3%) | 287 (59.7%) |
| Cleaning & Maintenance | 0 (0.0%) | 24 (100.0%) |
| Personal Care & Service | 0 (0.0%) | 24 (100.0%) |
| Total (Category) | 291 (41.2%) | 415 (58.8%) |
| Total (Overall) | 2,389 (58.0%) | 1,728 (42.0%) |
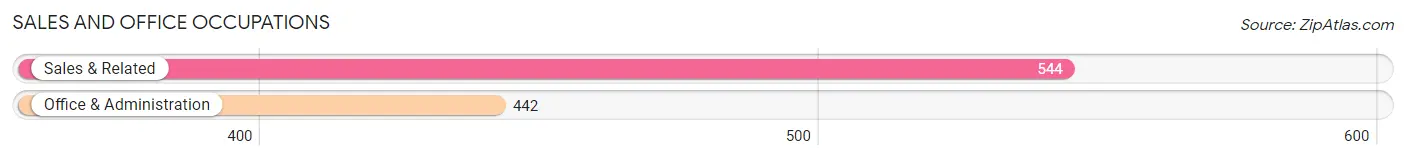
Sales and Office Occupations
The most common Sales and Office occupations in Smithfield are Sales & Related (544 | 13.2%), and Office & Administration (442 | 10.7%).
Sales and Office Occupations by Sex
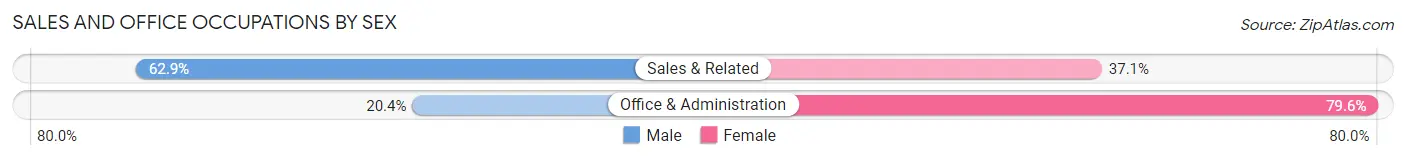
| Occupation | Male | Female |
| Sales & Related | 342 (62.9%) | 202 (37.1%) |
| Office & Administration | 90 (20.4%) | 352 (79.6%) |
| Total (Category) | 432 (43.8%) | 554 (56.2%) |
| Total (Overall) | 2,389 (58.0%) | 1,728 (42.0%) |
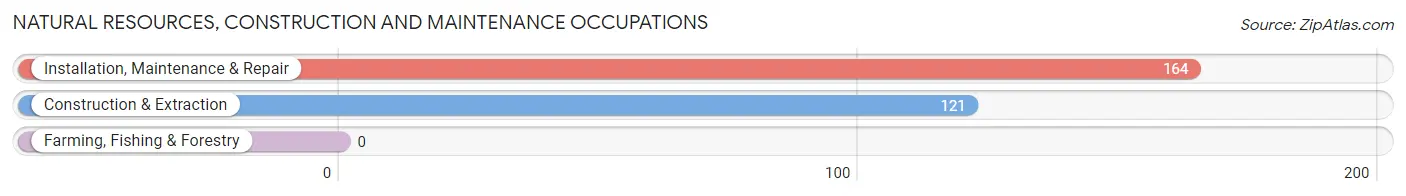
Natural Resources, Construction and Maintenance Occupations
The most common Natural Resources, Construction and Maintenance occupations in Smithfield are Installation, Maintenance & Repair (164 | 4.0%), and Construction & Extraction (121 | 2.9%).
Natural Resources, Construction and Maintenance Occupations by Sex
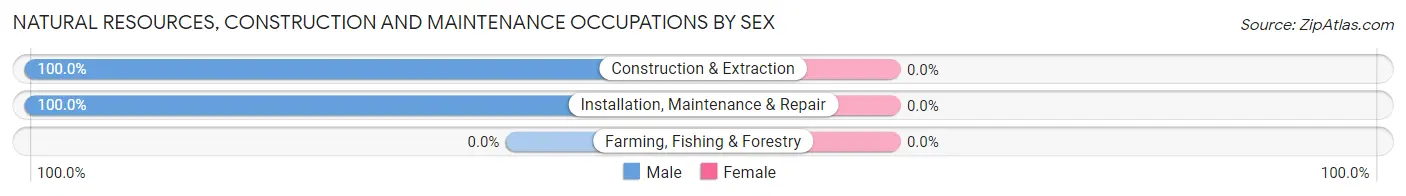
| Occupation | Male | Female |
| Farming, Fishing & Forestry | 0 (0.0%) | 0 (0.0%) |
| Construction & Extraction | 121 (100.0%) | 0 (0.0%) |
| Installation, Maintenance & Repair | 164 (100.0%) | 0 (0.0%) |
| Total (Category) | 285 (100.0%) | 0 (0.0%) |
| Total (Overall) | 2,389 (58.0%) | 1,728 (42.0%) |
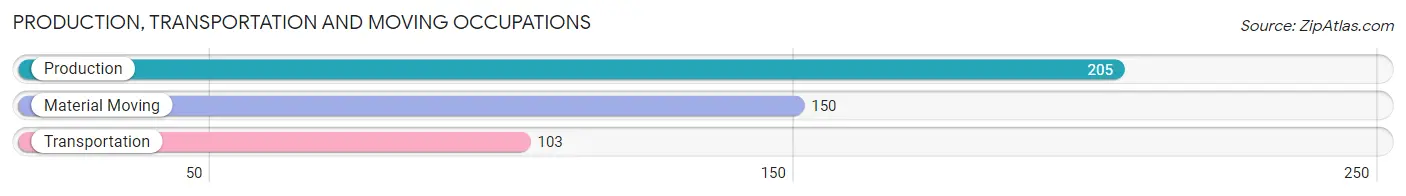
Production, Transportation and Moving Occupations
The most common Production, Transportation and Moving occupations in Smithfield are Production (205 | 5.0%), Material Moving (150 | 3.6%), and Transportation (103 | 2.5%).
Production, Transportation and Moving Occupations by Sex
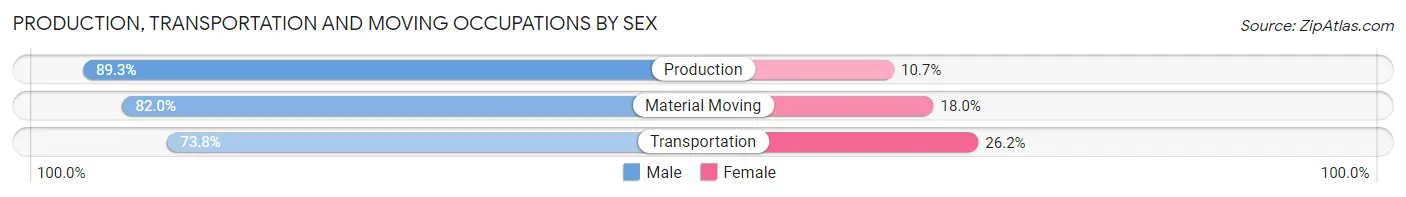
| Occupation | Male | Female |
| Production | 183 (89.3%) | 22 (10.7%) |
| Transportation | 76 (73.8%) | 27 (26.2%) |
| Material Moving | 123 (82.0%) | 27 (18.0%) |
| Total (Category) | 382 (83.4%) | 76 (16.6%) |
| Total (Overall) | 2,389 (58.0%) | 1,728 (42.0%) |
Employment Industries by Sex in Smithfield
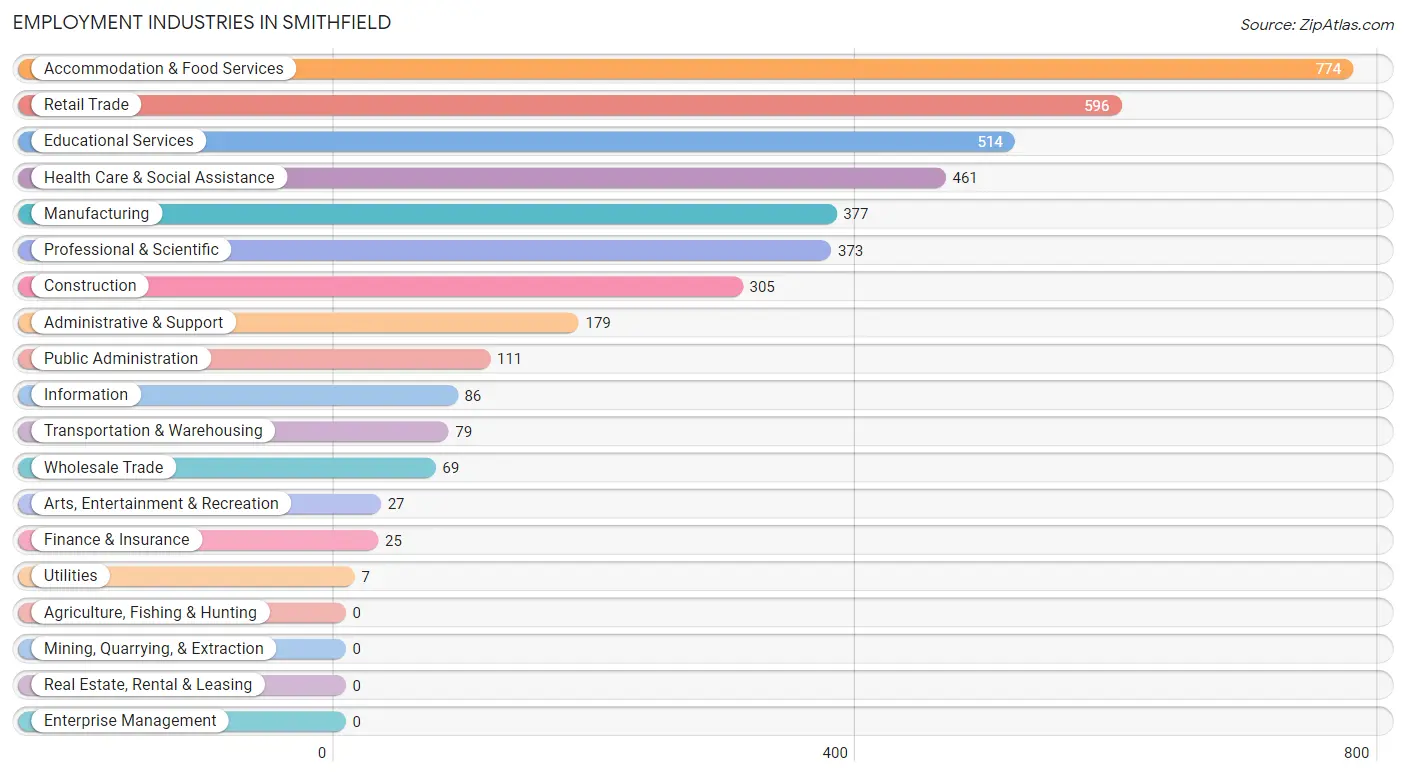
Employment Industries in Smithfield
The major employment industries in Smithfield include Accommodation & Food Services (774 | 18.8%), Retail Trade (596 | 14.5%), Educational Services (514 | 12.5%), Health Care & Social Assistance (461 | 11.2%), and Manufacturing (377 | 9.2%).
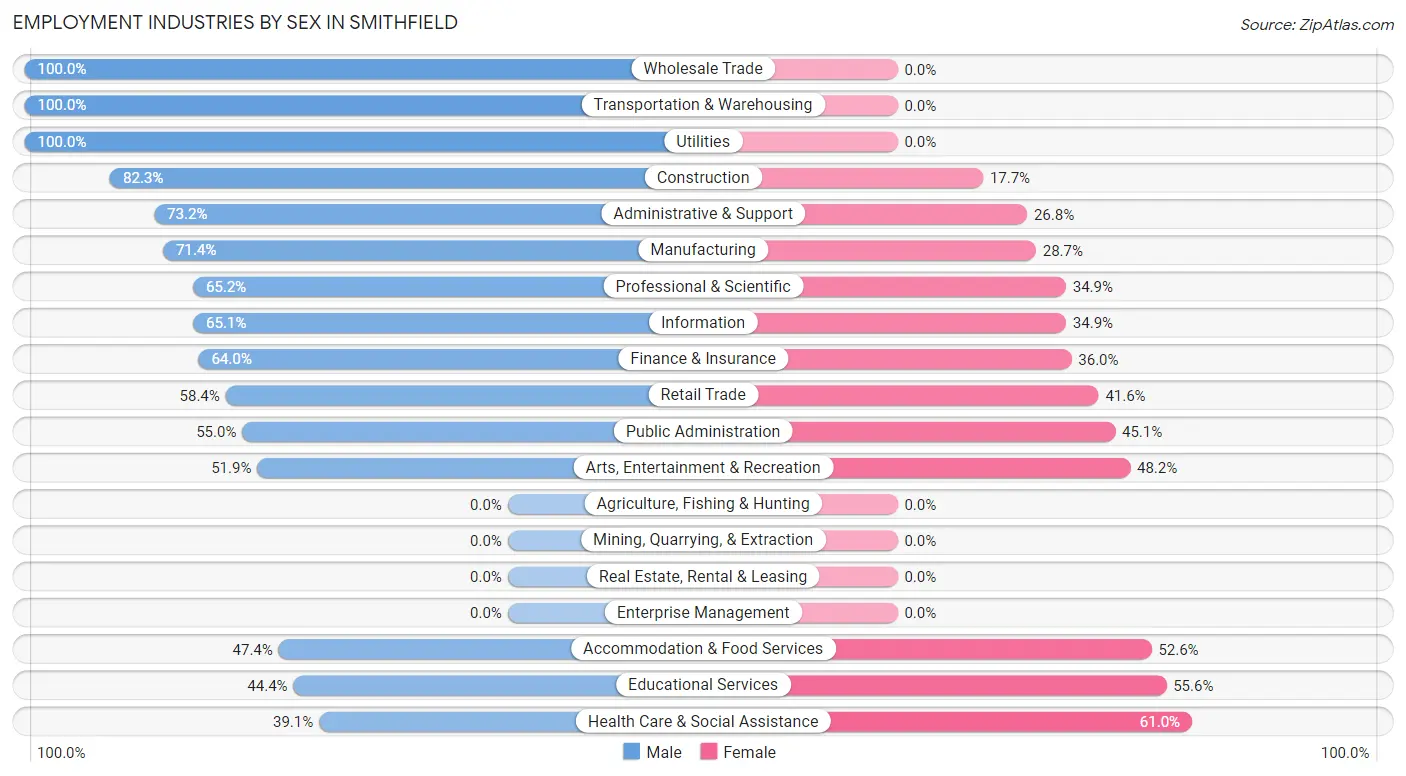
Employment Industries by Sex in Smithfield
The Smithfield industries that see more men than women are Wholesale Trade (100.0%), Transportation & Warehousing (100.0%), and Utilities (100.0%), whereas the industries that tend to have a higher number of women are Health Care & Social Assistance (61.0%), Educational Services (55.6%), and Accommodation & Food Services (52.6%).
| Industry | Male | Female |
| Agriculture, Fishing & Hunting | 0 (0.0%) | 0 (0.0%) |
| Mining, Quarrying, & Extraction | 0 (0.0%) | 0 (0.0%) |
| Construction | 251 (82.3%) | 54 (17.7%) |
| Manufacturing | 269 (71.4%) | 108 (28.6%) |
| Wholesale Trade | 69 (100.0%) | 0 (0.0%) |
| Retail Trade | 348 (58.4%) | 248 (41.6%) |
| Transportation & Warehousing | 79 (100.0%) | 0 (0.0%) |
| Utilities | 7 (100.0%) | 0 (0.0%) |
| Information | 56 (65.1%) | 30 (34.9%) |
| Finance & Insurance | 16 (64.0%) | 9 (36.0%) |
| Real Estate, Rental & Leasing | 0 (0.0%) | 0 (0.0%) |
| Professional & Scientific | 243 (65.1%) | 130 (34.8%) |
| Enterprise Management | 0 (0.0%) | 0 (0.0%) |
| Administrative & Support | 131 (73.2%) | 48 (26.8%) |
| Educational Services | 228 (44.4%) | 286 (55.6%) |
| Health Care & Social Assistance | 180 (39.1%) | 281 (61.0%) |
| Arts, Entertainment & Recreation | 14 (51.8%) | 13 (48.1%) |
| Accommodation & Food Services | 367 (47.4%) | 407 (52.6%) |
| Public Administration | 61 (54.9%) | 50 (45.1%) |
| Total | 2,389 (58.0%) | 1,728 (42.0%) |
Education in Smithfield
School Enrollment in Smithfield
The most common levels of schooling among the 2,780 students in Smithfield are middle school (758 | 27.3%), elementary school (740 | 26.6%), and high school (618 | 22.2%).
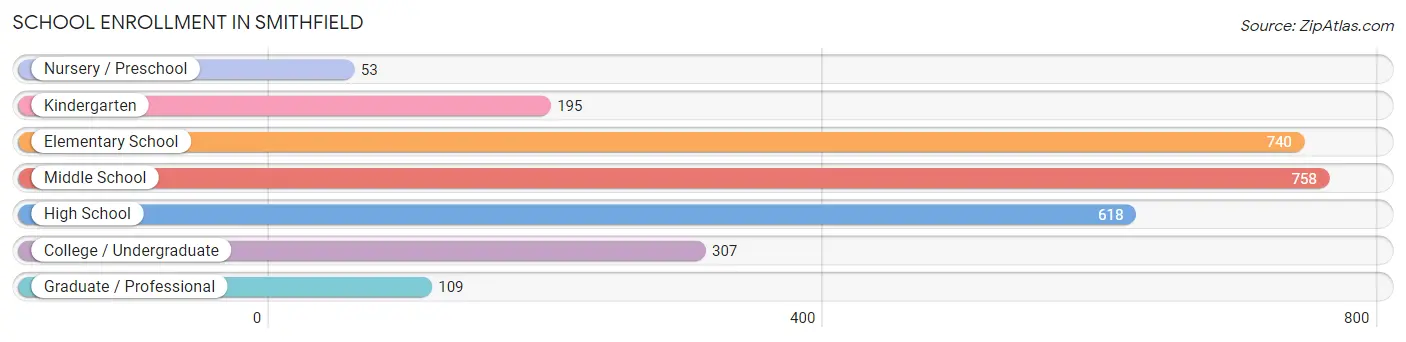
| School Level | # Students | % Students |
| Nursery / Preschool | 53 | 1.9% |
| Kindergarten | 195 | 7.0% |
| Elementary School | 740 | 26.6% |
| Middle School | 758 | 27.3% |
| High School | 618 | 22.2% |
| College / Undergraduate | 307 | 11.0% |
| Graduate / Professional | 109 | 3.9% |
| Total | 2,780 | 100.0% |
School Enrollment by Age by Funding Source in Smithfield
Out of a total of 2,780 students who are enrolled in schools in Smithfield, 153 (5.5%) attend a private institution, while the remaining 2,627 (94.5%) are enrolled in public schools. The age group of 3 to 4 year olds has the highest likelihood of being enrolled in private schools, with 39 (73.6% in the age bracket) enrolled. Conversely, the age group of 5 to 9 year old has the lowest likelihood of being enrolled in a private school, with 768 (100.0% in the age bracket) attending a public institution.
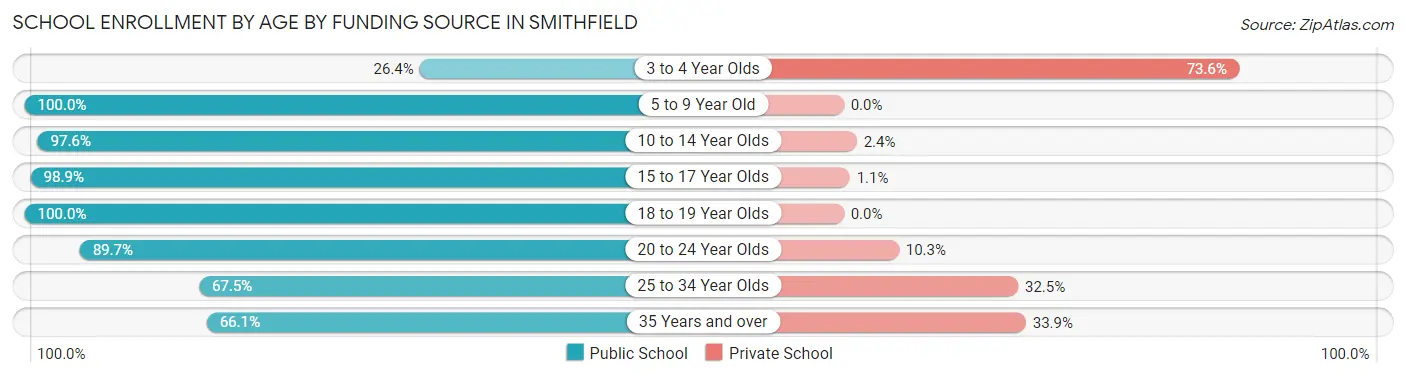
| Age Bracket | Public School | Private School |
| 3 to 4 Year Olds | 14 (26.4%) | 39 (73.6%) |
| 5 to 9 Year Old | 768 (100.0%) | 0 (0.0%) |
| 10 to 14 Year Olds | 1,042 (97.6%) | 26 (2.4%) |
| 15 to 17 Year Olds | 438 (98.9%) | 5 (1.1%) |
| 18 to 19 Year Olds | 12 (100.0%) | 0 (0.0%) |
| 20 to 24 Year Olds | 236 (89.7%) | 27 (10.3%) |
| 25 to 34 Year Olds | 79 (67.5%) | 38 (32.5%) |
| 35 Years and over | 37 (66.1%) | 19 (33.9%) |
| Total | 2,627 (94.5%) | 153 (5.5%) |
Educational Attainment by Field of Study in Smithfield
Social sciences (438 | 19.8%), business (321 | 14.5%), education (270 | 12.2%), psychology (197 | 8.9%), and arts & humanities (195 | 8.8%) are the most common fields of study among 2,211 individuals in Smithfield who have obtained a bachelor's degree or higher.
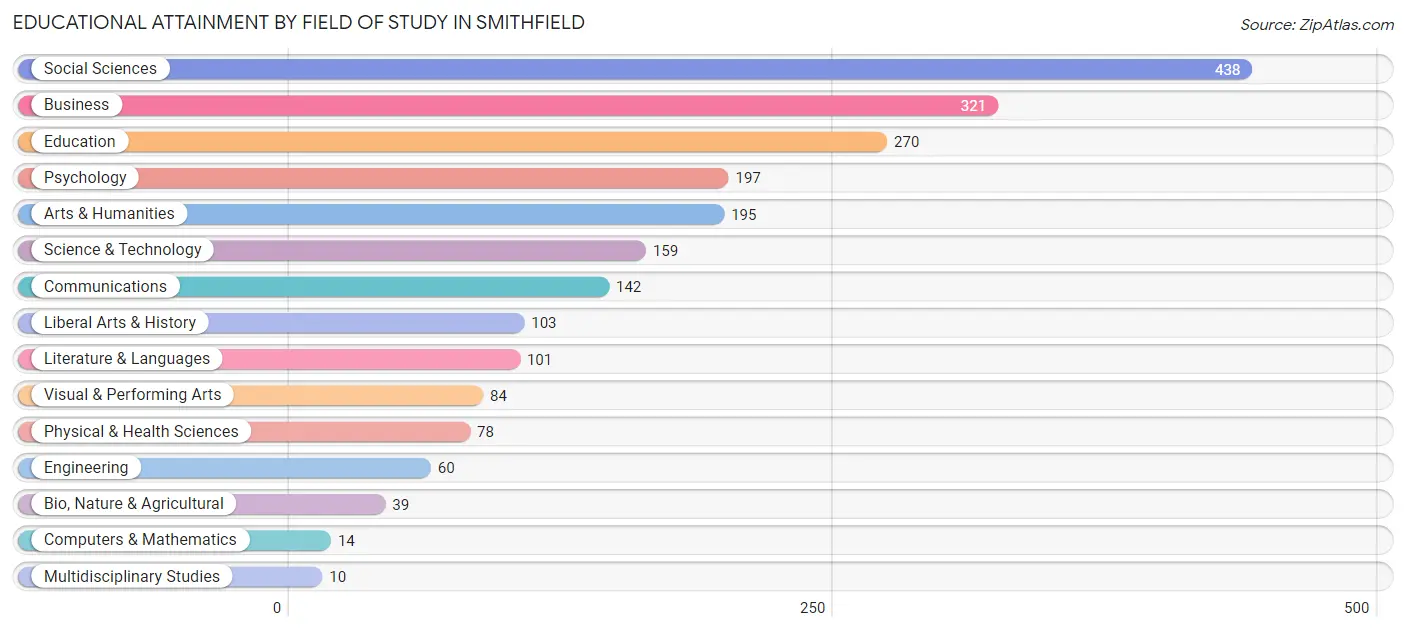
| Field of Study | # Graduates | % Graduates |
| Computers & Mathematics | 14 | 0.6% |
| Bio, Nature & Agricultural | 39 | 1.8% |
| Physical & Health Sciences | 78 | 3.5% |
| Psychology | 197 | 8.9% |
| Social Sciences | 438 | 19.8% |
| Engineering | 60 | 2.7% |
| Multidisciplinary Studies | 10 | 0.4% |
| Science & Technology | 159 | 7.2% |
| Business | 321 | 14.5% |
| Education | 270 | 12.2% |
| Literature & Languages | 101 | 4.6% |
| Liberal Arts & History | 103 | 4.7% |
| Visual & Performing Arts | 84 | 3.8% |
| Communications | 142 | 6.4% |
| Arts & Humanities | 195 | 8.8% |
| Total | 2,211 | 100.0% |
Transportation & Commute in Smithfield
Vehicle Availability by Sex in Smithfield
The most prevalent vehicle ownership categories in Smithfield are males with 2 vehicles (966, accounting for 40.4%) and females with 2 vehicles (657, making up 55.9%).
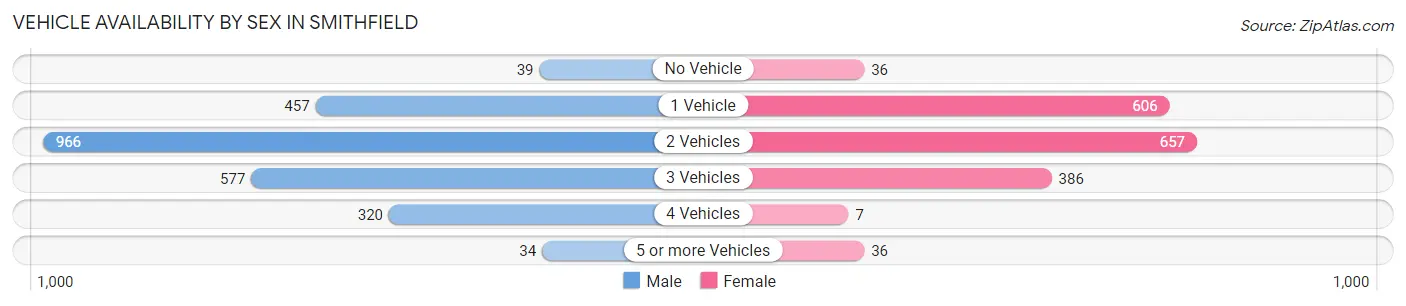
| Vehicles Available | Male | Female |
| No Vehicle | 39 (1.6%) | 36 (2.1%) |
| 1 Vehicle | 457 (19.1%) | 606 (35.1%) |
| 2 Vehicles | 966 (40.4%) | 657 (38.0%) |
| 3 Vehicles | 577 (24.1%) | 386 (22.3%) |
| 4 Vehicles | 320 (13.4%) | 7 (0.4%) |
| 5 or more Vehicles | 34 (1.4%) | 36 (2.1%) |
| Total | 2,393 (100.0%) | 1,728 (100.0%) |
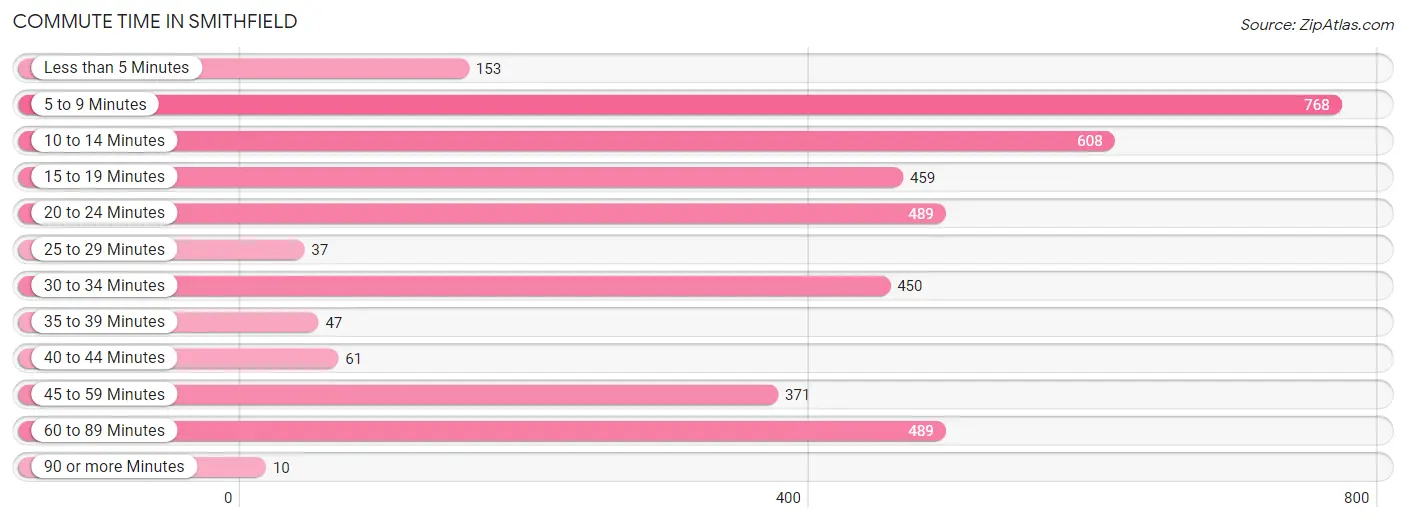
Commute Time in Smithfield
The most frequently occuring commute durations in Smithfield are 5 to 9 minutes (768 commuters, 19.5%), 10 to 14 minutes (608 commuters, 15.4%), and 20 to 24 minutes (489 commuters, 12.4%).
| Commute Time | # Commuters | % Commuters |
| Less than 5 Minutes | 153 | 3.9% |
| 5 to 9 Minutes | 768 | 19.5% |
| 10 to 14 Minutes | 608 | 15.4% |
| 15 to 19 Minutes | 459 | 11.6% |
| 20 to 24 Minutes | 489 | 12.4% |
| 25 to 29 Minutes | 37 | 0.9% |
| 30 to 34 Minutes | 450 | 11.4% |
| 35 to 39 Minutes | 47 | 1.2% |
| 40 to 44 Minutes | 61 | 1.5% |
| 45 to 59 Minutes | 371 | 9.4% |
| 60 to 89 Minutes | 489 | 12.4% |
| 90 or more Minutes | 10 | 0.3% |
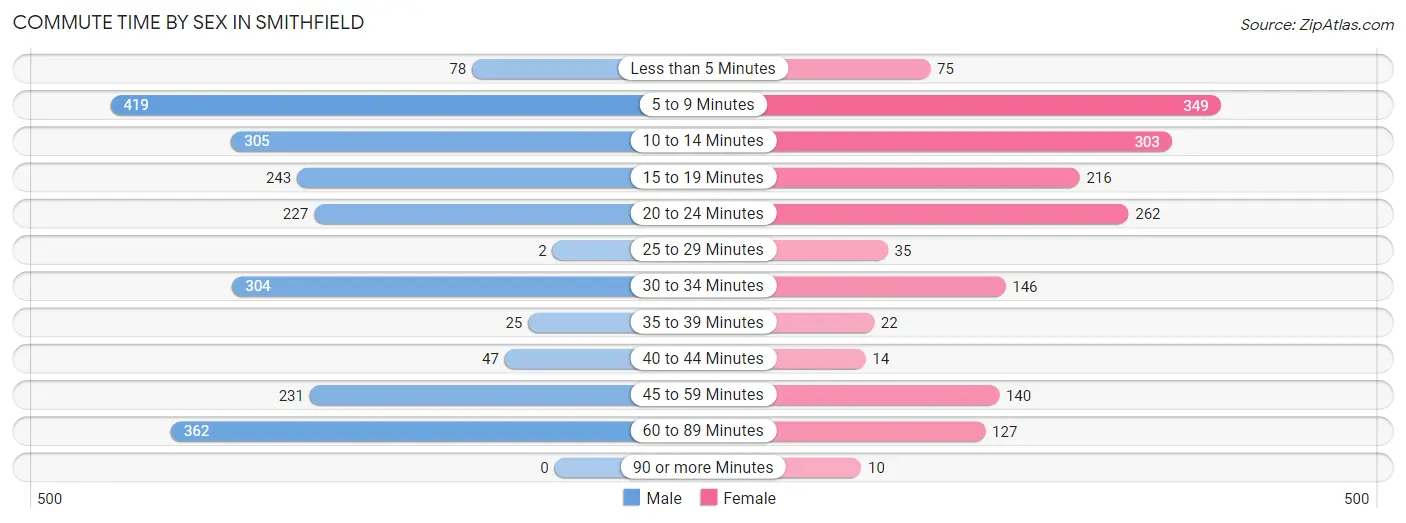
Commute Time by Sex in Smithfield
The most common commute times in Smithfield are 5 to 9 minutes (419 commuters, 18.7%) for males and 5 to 9 minutes (349 commuters, 20.5%) for females.
| Commute Time | Male | Female |
| Less than 5 Minutes | 78 (3.5%) | 75 (4.4%) |
| 5 to 9 Minutes | 419 (18.7%) | 349 (20.5%) |
| 10 to 14 Minutes | 305 (13.6%) | 303 (17.8%) |
| 15 to 19 Minutes | 243 (10.8%) | 216 (12.7%) |
| 20 to 24 Minutes | 227 (10.1%) | 262 (15.4%) |
| 25 to 29 Minutes | 2 (0.1%) | 35 (2.1%) |
| 30 to 34 Minutes | 304 (13.6%) | 146 (8.6%) |
| 35 to 39 Minutes | 25 (1.1%) | 22 (1.3%) |
| 40 to 44 Minutes | 47 (2.1%) | 14 (0.8%) |
| 45 to 59 Minutes | 231 (10.3%) | 140 (8.2%) |
| 60 to 89 Minutes | 362 (16.1%) | 127 (7.5%) |
| 90 or more Minutes | 0 (0.0%) | 10 (0.6%) |
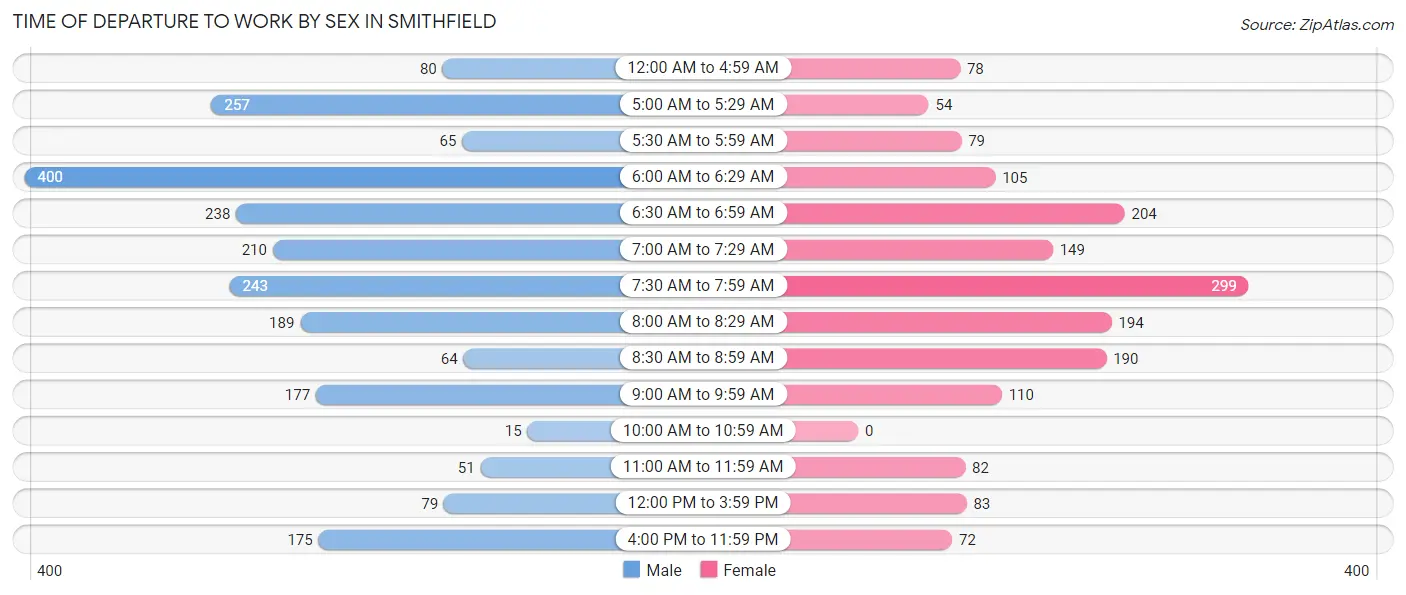
Time of Departure to Work by Sex in Smithfield
The most frequent times of departure to work in Smithfield are 6:00 AM to 6:29 AM (400, 17.8%) for males and 7:30 AM to 7:59 AM (299, 17.6%) for females.
| Time of Departure | Male | Female |
| 12:00 AM to 4:59 AM | 80 (3.6%) | 78 (4.6%) |
| 5:00 AM to 5:29 AM | 257 (11.5%) | 54 (3.2%) |
| 5:30 AM to 5:59 AM | 65 (2.9%) | 79 (4.6%) |
| 6:00 AM to 6:29 AM | 400 (17.8%) | 105 (6.2%) |
| 6:30 AM to 6:59 AM | 238 (10.6%) | 204 (12.0%) |
| 7:00 AM to 7:29 AM | 210 (9.4%) | 149 (8.8%) |
| 7:30 AM to 7:59 AM | 243 (10.8%) | 299 (17.6%) |
| 8:00 AM to 8:29 AM | 189 (8.4%) | 194 (11.4%) |
| 8:30 AM to 8:59 AM | 64 (2.9%) | 190 (11.2%) |
| 9:00 AM to 9:59 AM | 177 (7.9%) | 110 (6.5%) |
| 10:00 AM to 10:59 AM | 15 (0.7%) | 0 (0.0%) |
| 11:00 AM to 11:59 AM | 51 (2.3%) | 82 (4.8%) |
| 12:00 PM to 3:59 PM | 79 (3.5%) | 83 (4.9%) |
| 4:00 PM to 11:59 PM | 175 (7.8%) | 72 (4.2%) |
| Total | 2,243 (100.0%) | 1,699 (100.0%) |
Housing Occupancy in Smithfield
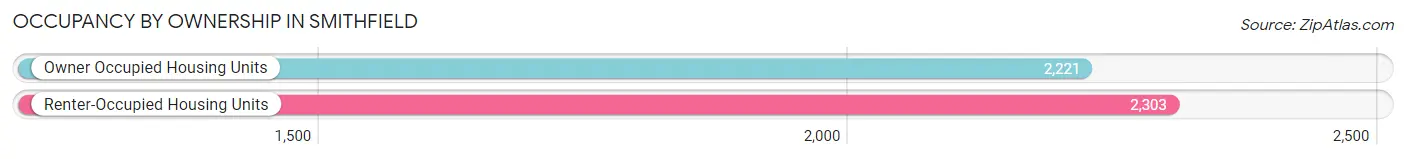
Occupancy by Ownership in Smithfield
Of the total 4,524 dwellings in Smithfield, owner-occupied units account for 2,221 (49.1%), while renter-occupied units make up 2,303 (50.9%).
| Occupancy | # Housing Units | % Housing Units |
| Owner Occupied Housing Units | 2,221 | 49.1% |
| Renter-Occupied Housing Units | 2,303 | 50.9% |
| Total Occupied Housing Units | 4,524 | 100.0% |
Occupancy by Household Size in Smithfield
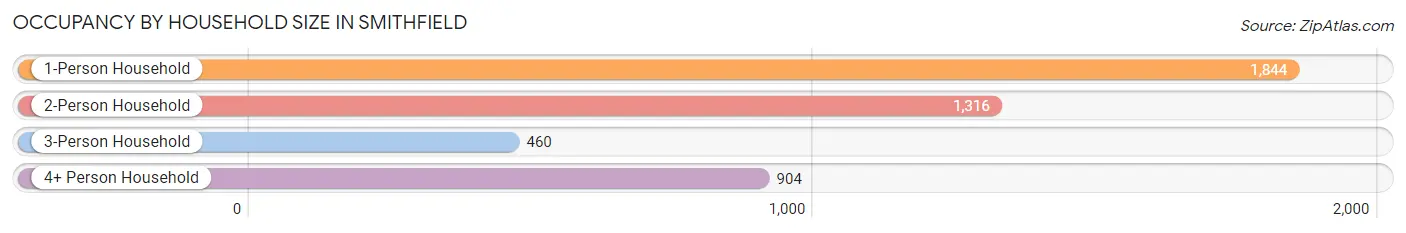
| Household Size | # Housing Units | % Housing Units |
| 1-Person Household | 1,844 | 40.8% |
| 2-Person Household | 1,316 | 29.1% |
| 3-Person Household | 460 | 10.2% |
| 4+ Person Household | 904 | 20.0% |
| Total Housing Units | 4,524 | 100.0% |
Occupancy by Ownership by Household Size in Smithfield
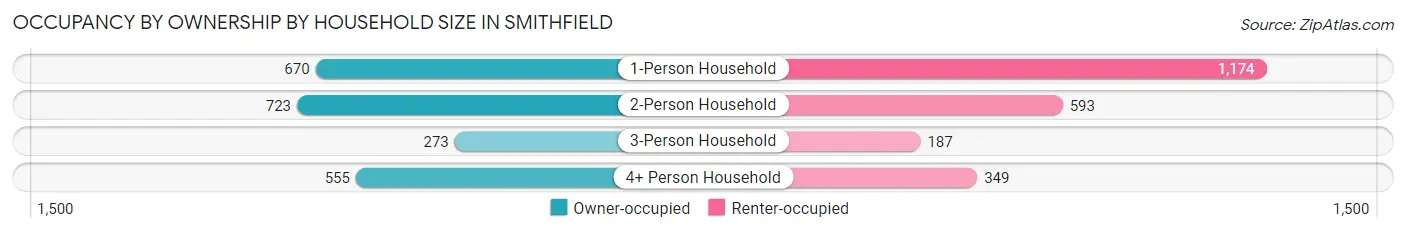
| Household Size | Owner-occupied | Renter-occupied |
| 1-Person Household | 670 (36.3%) | 1,174 (63.7%) |
| 2-Person Household | 723 (54.9%) | 593 (45.1%) |
| 3-Person Household | 273 (59.4%) | 187 (40.6%) |
| 4+ Person Household | 555 (61.4%) | 349 (38.6%) |
| Total Housing Units | 2,221 (49.1%) | 2,303 (50.9%) |
Occupancy by Educational Attainment in Smithfield
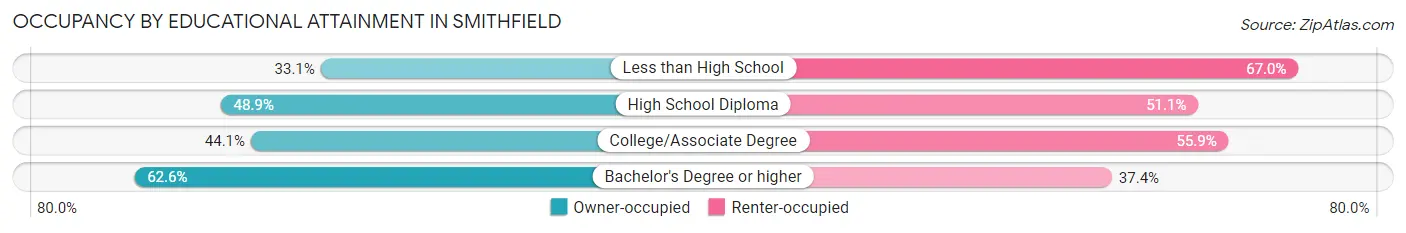
| Household Size | Owner-occupied | Renter-occupied |
| Less than High School | 268 (33.1%) | 543 (66.9%) |
| High School Diploma | 565 (48.9%) | 590 (51.1%) |
| College/Associate Degree | 509 (44.1%) | 645 (55.9%) |
| Bachelor's Degree or higher | 879 (62.6%) | 525 (37.4%) |
Occupancy by Age of Householder in Smithfield
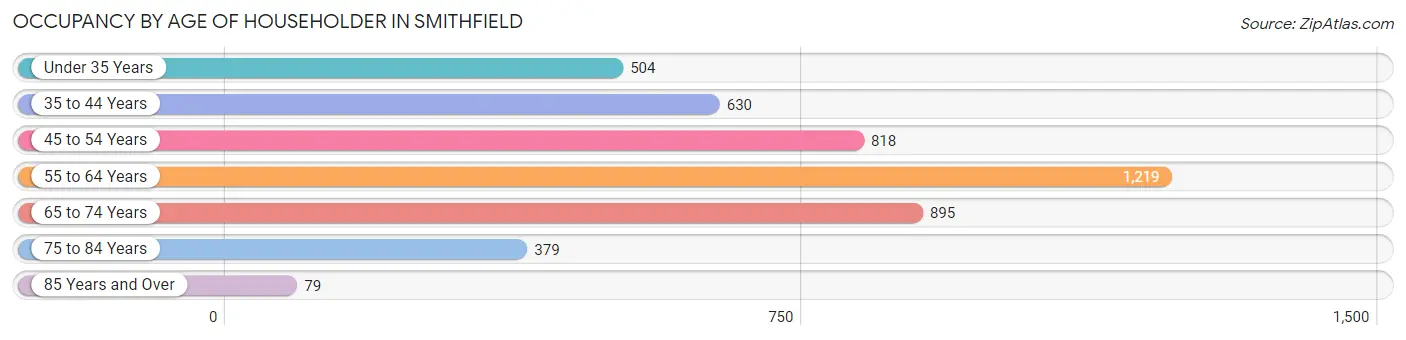
| Age Bracket | # Households | % Households |
| Under 35 Years | 504 | 11.1% |
| 35 to 44 Years | 630 | 13.9% |
| 45 to 54 Years | 818 | 18.1% |
| 55 to 64 Years | 1,219 | 27.0% |
| 65 to 74 Years | 895 | 19.8% |
| 75 to 84 Years | 379 | 8.4% |
| 85 Years and Over | 79 | 1.8% |
| Total | 4,524 | 100.0% |
Housing Finances in Smithfield
Median Income by Occupancy in Smithfield
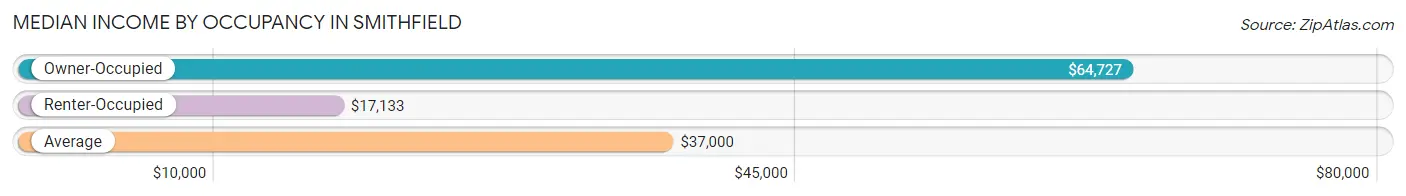
| Occupancy Type | # Households | Median Income |
| Owner-Occupied | 2,221 (49.1%) | $64,727 |
| Renter-Occupied | 2,303 (50.9%) | $17,133 |
| Average | 4,524 (100.0%) | $37,000 |
Occupancy by Householder Income Bracket in Smithfield
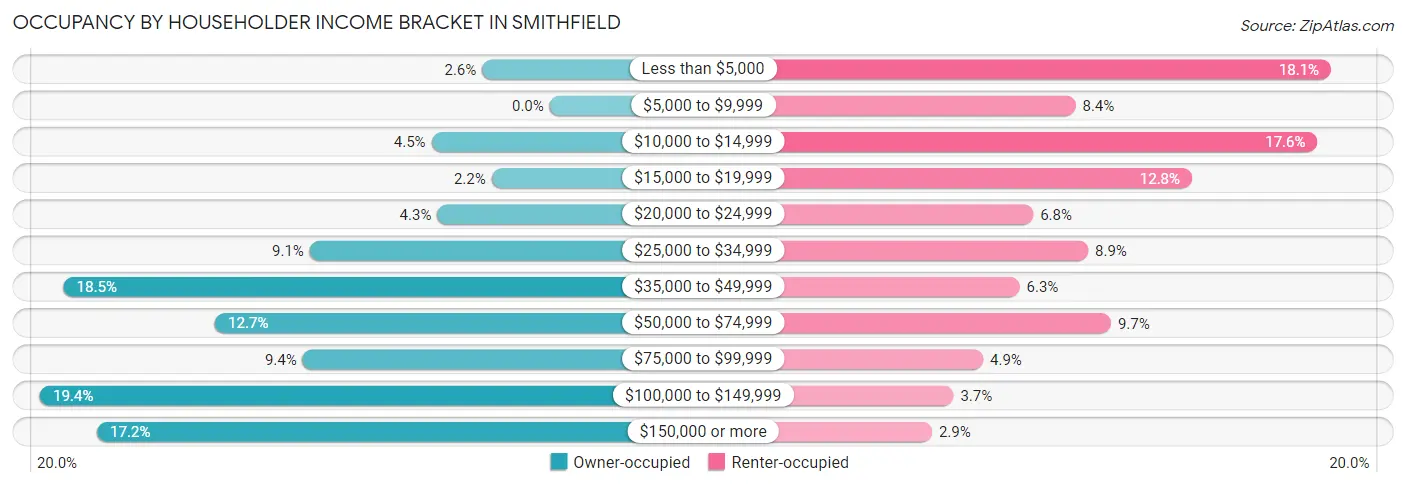
| Income Bracket | Owner-occupied | Renter-occupied |
| Less than $5,000 | 57 (2.6%) | 417 (18.1%) |
| $5,000 to $9,999 | 0 (0.0%) | 193 (8.4%) |
| $10,000 to $14,999 | 100 (4.5%) | 405 (17.6%) |
| $15,000 to $19,999 | 49 (2.2%) | 295 (12.8%) |
| $20,000 to $24,999 | 95 (4.3%) | 156 (6.8%) |
| $25,000 to $34,999 | 203 (9.1%) | 204 (8.9%) |
| $35,000 to $49,999 | 411 (18.5%) | 144 (6.2%) |
| $50,000 to $74,999 | 283 (12.7%) | 224 (9.7%) |
| $75,000 to $99,999 | 209 (9.4%) | 112 (4.9%) |
| $100,000 to $149,999 | 431 (19.4%) | 86 (3.7%) |
| $150,000 or more | 383 (17.2%) | 67 (2.9%) |
| Total | 2,221 (100.0%) | 2,303 (100.0%) |
Monthly Housing Cost Tiers in Smithfield
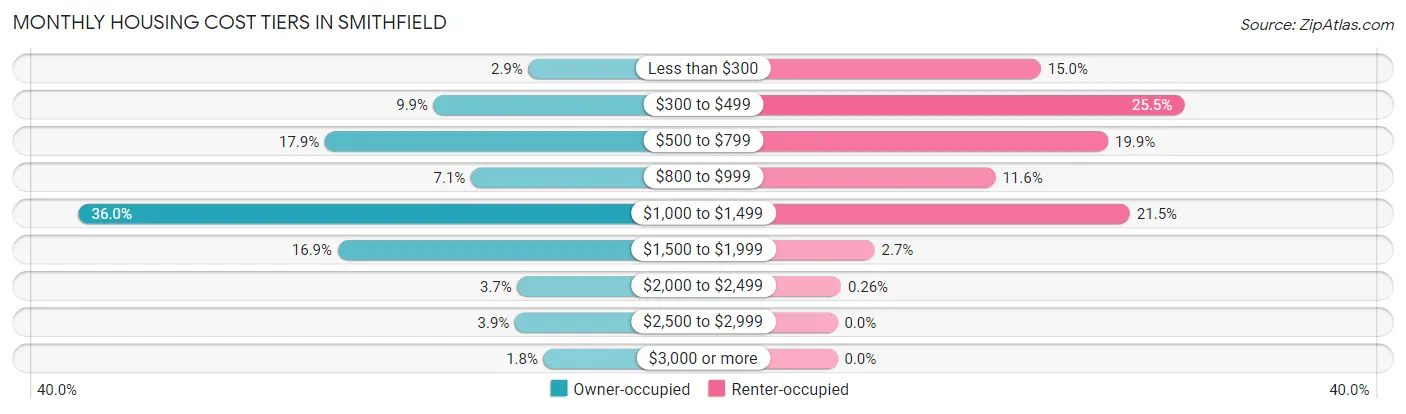
| Monthly Cost | Owner-occupied | Renter-occupied |
| Less than $300 | 64 (2.9%) | 345 (15.0%) |
| $300 to $499 | 219 (9.9%) | 588 (25.5%) |
| $500 to $799 | 397 (17.9%) | 459 (19.9%) |
| $800 to $999 | 158 (7.1%) | 268 (11.6%) |
| $1,000 to $1,499 | 800 (36.0%) | 496 (21.5%) |
| $1,500 to $1,999 | 376 (16.9%) | 63 (2.7%) |
| $2,000 to $2,499 | 82 (3.7%) | 6 (0.3%) |
| $2,500 to $2,999 | 86 (3.9%) | 0 (0.0%) |
| $3,000 or more | 39 (1.8%) | 0 (0.0%) |
| Total | 2,221 (100.0%) | 2,303 (100.0%) |
Physical Housing Characteristics in Smithfield
Housing Structures in Smithfield
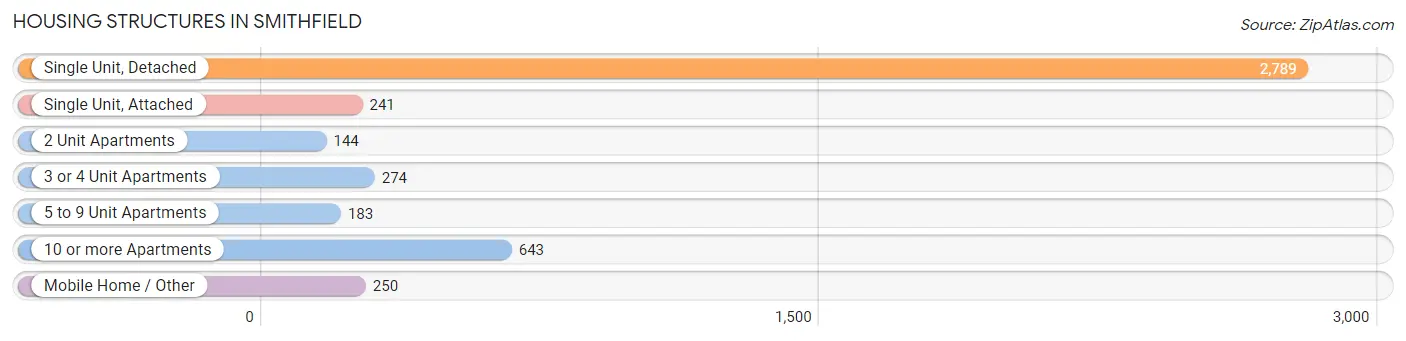
| Structure Type | # Housing Units | % Housing Units |
| Single Unit, Detached | 2,789 | 61.7% |
| Single Unit, Attached | 241 | 5.3% |
| 2 Unit Apartments | 144 | 3.2% |
| 3 or 4 Unit Apartments | 274 | 6.1% |
| 5 to 9 Unit Apartments | 183 | 4.1% |
| 10 or more Apartments | 643 | 14.2% |
| Mobile Home / Other | 250 | 5.5% |
| Total | 4,524 | 100.0% |
Housing Structures by Occupancy in Smithfield
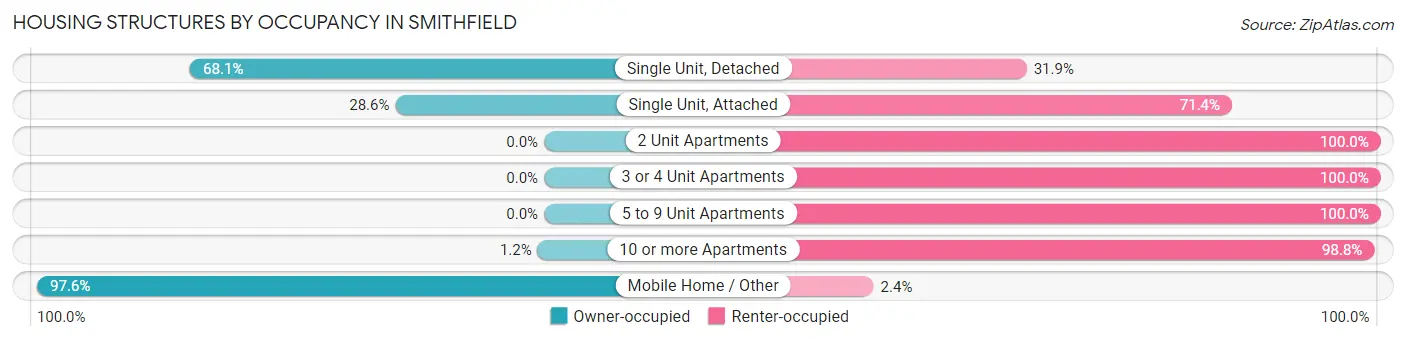
| Structure Type | Owner-occupied | Renter-occupied |
| Single Unit, Detached | 1,900 (68.1%) | 889 (31.9%) |
| Single Unit, Attached | 69 (28.6%) | 172 (71.4%) |
| 2 Unit Apartments | 0 (0.0%) | 144 (100.0%) |
| 3 or 4 Unit Apartments | 0 (0.0%) | 274 (100.0%) |
| 5 to 9 Unit Apartments | 0 (0.0%) | 183 (100.0%) |
| 10 or more Apartments | 8 (1.2%) | 635 (98.8%) |
| Mobile Home / Other | 244 (97.6%) | 6 (2.4%) |
| Total | 2,221 (49.1%) | 2,303 (50.9%) |
Housing Structures by Number of Rooms in Smithfield
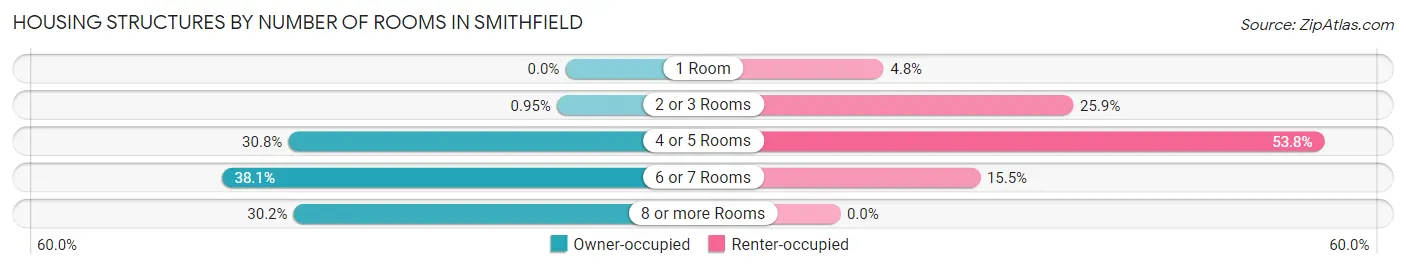
| Number of Rooms | Owner-occupied | Renter-occupied |
| 1 Room | 0 (0.0%) | 111 (4.8%) |
| 2 or 3 Rooms | 21 (0.9%) | 596 (25.9%) |
| 4 or 5 Rooms | 683 (30.7%) | 1,238 (53.8%) |
| 6 or 7 Rooms | 847 (38.1%) | 358 (15.5%) |
| 8 or more Rooms | 670 (30.2%) | 0 (0.0%) |
| Total | 2,221 (100.0%) | 2,303 (100.0%) |
Housing Structure by Heating Type in Smithfield
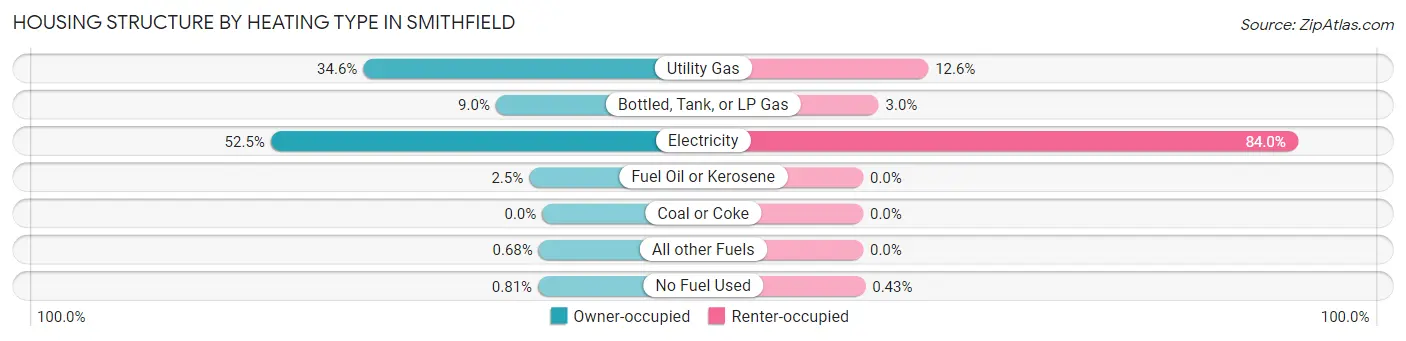
| Heating Type | Owner-occupied | Renter-occupied |
| Utility Gas | 768 (34.6%) | 290 (12.6%) |
| Bottled, Tank, or LP Gas | 199 (9.0%) | 69 (3.0%) |
| Electricity | 1,165 (52.4%) | 1,934 (84.0%) |
| Fuel Oil or Kerosene | 56 (2.5%) | 0 (0.0%) |
| Coal or Coke | 0 (0.0%) | 0 (0.0%) |
| All other Fuels | 15 (0.7%) | 0 (0.0%) |
| No Fuel Used | 18 (0.8%) | 10 (0.4%) |
| Total | 2,221 (100.0%) | 2,303 (100.0%) |
Household Vehicle Usage in Smithfield
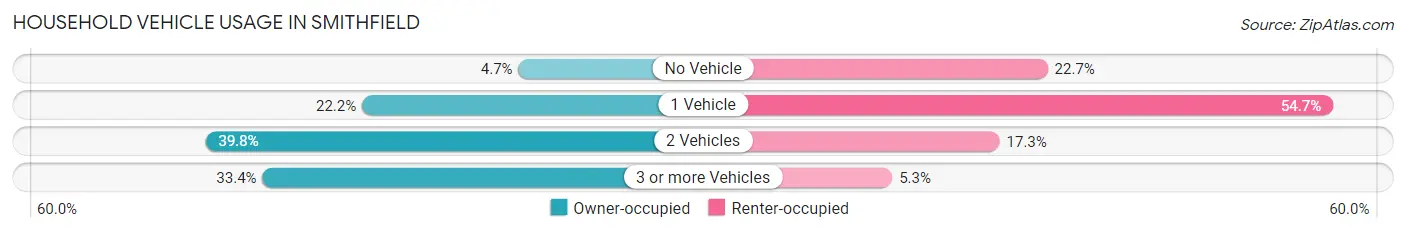
| Vehicles per Household | Owner-occupied | Renter-occupied |
| No Vehicle | 104 (4.7%) | 523 (22.7%) |
| 1 Vehicle | 493 (22.2%) | 1,259 (54.7%) |
| 2 Vehicles | 883 (39.8%) | 399 (17.3%) |
| 3 or more Vehicles | 741 (33.4%) | 122 (5.3%) |
| Total | 2,221 (100.0%) | 2,303 (100.0%) |
Real Estate & Mortgages in Smithfield
Real Estate and Mortgage Overview in Smithfield
| Characteristic | Without Mortgage | With Mortgage |
| Housing Units | 716 | 1,505 |
| Median Property Value | $186,100 | $195,300 |
| Median Household Income | $62,982 | $249 |
| Monthly Housing Costs | $568 | $39 |
| Real Estate Taxes | $1,490 | $7 |
Property Value by Mortgage Status in Smithfield
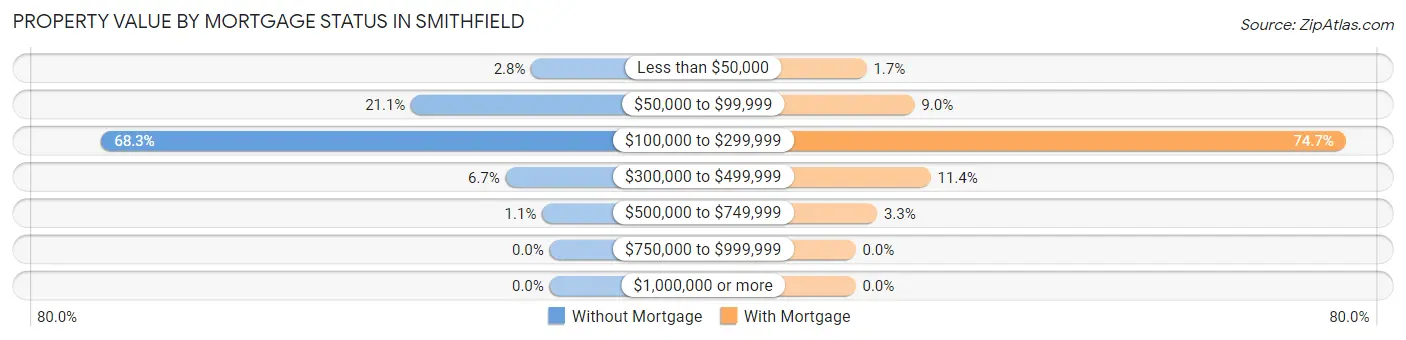
| Property Value | Without Mortgage | With Mortgage |
| Less than $50,000 | 20 (2.8%) | 25 (1.7%) |
| $50,000 to $99,999 | 151 (21.1%) | 135 (9.0%) |
| $100,000 to $299,999 | 489 (68.3%) | 1,124 (74.7%) |
| $300,000 to $499,999 | 48 (6.7%) | 172 (11.4%) |
| $500,000 to $749,999 | 8 (1.1%) | 49 (3.3%) |
| $750,000 to $999,999 | 0 (0.0%) | 0 (0.0%) |
| $1,000,000 or more | 0 (0.0%) | 0 (0.0%) |
| Total | 716 (100.0%) | 1,505 (100.0%) |
Household Income by Mortgage Status in Smithfield
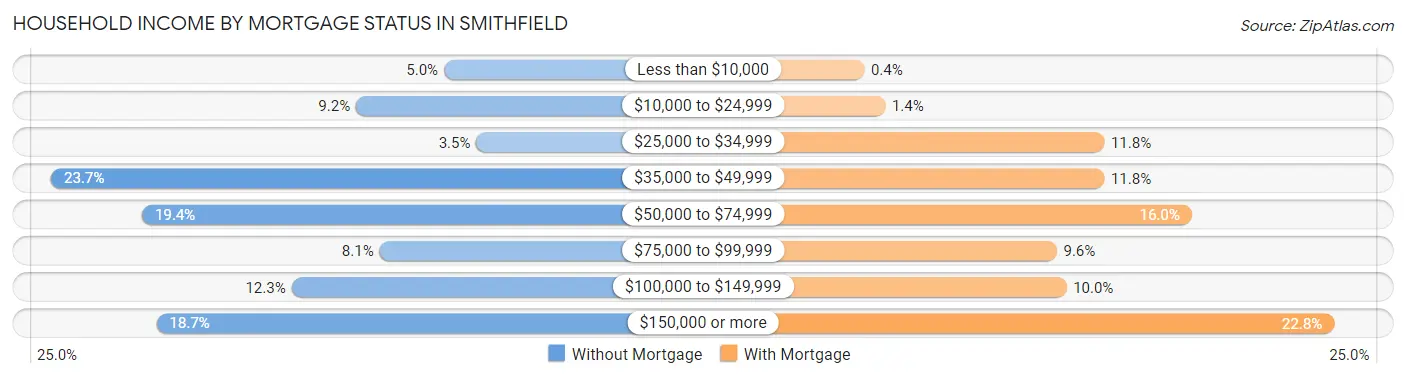
| Household Income | Without Mortgage | With Mortgage |
| Less than $10,000 | 36 (5.0%) | 6 (0.4%) |
| $10,000 to $24,999 | 66 (9.2%) | 21 (1.4%) |
| $25,000 to $34,999 | 25 (3.5%) | 178 (11.8%) |
| $35,000 to $49,999 | 170 (23.7%) | 178 (11.8%) |
| $50,000 to $74,999 | 139 (19.4%) | 241 (16.0%) |
| $75,000 to $99,999 | 58 (8.1%) | 144 (9.6%) |
| $100,000 to $149,999 | 88 (12.3%) | 151 (10.0%) |
| $150,000 or more | 134 (18.7%) | 343 (22.8%) |
| Total | 716 (100.0%) | 1,505 (100.0%) |
Property Value to Household Income Ratio in Smithfield
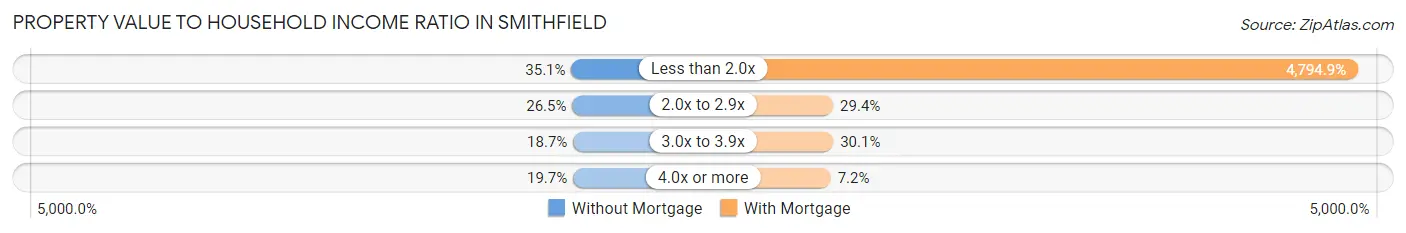
| Value-to-Income Ratio | Without Mortgage | With Mortgage |
| Less than 2.0x | 251 (35.1%) | 72,163 (4,794.9%) |
| 2.0x to 2.9x | 190 (26.5%) | 442 (29.4%) |
| 3.0x to 3.9x | 134 (18.7%) | 453 (30.1%) |
| 4.0x or more | 141 (19.7%) | 109 (7.2%) |
| Total | 716 (100.0%) | 1,505 (100.0%) |
Real Estate Taxes by Mortgage Status in Smithfield
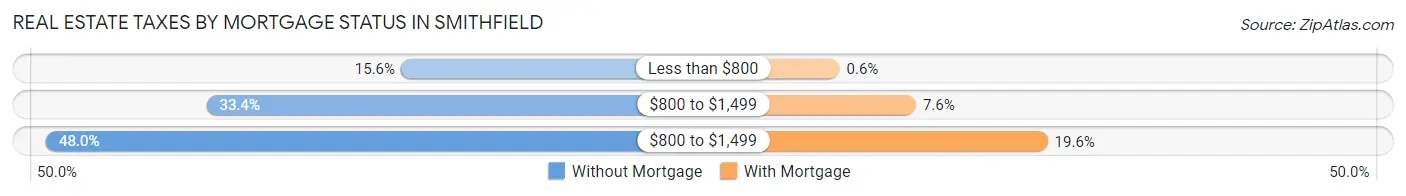
| Property Taxes | Without Mortgage | With Mortgage |
| Less than $800 | 112 (15.6%) | 9 (0.6%) |
| $800 to $1,499 | 239 (33.4%) | 114 (7.6%) |
| $800 to $1,499 | 344 (48.0%) | 295 (19.6%) |
| Total | 716 (100.0%) | 1,505 (100.0%) |
Health & Disability in Smithfield
Health Insurance Coverage by Age in Smithfield
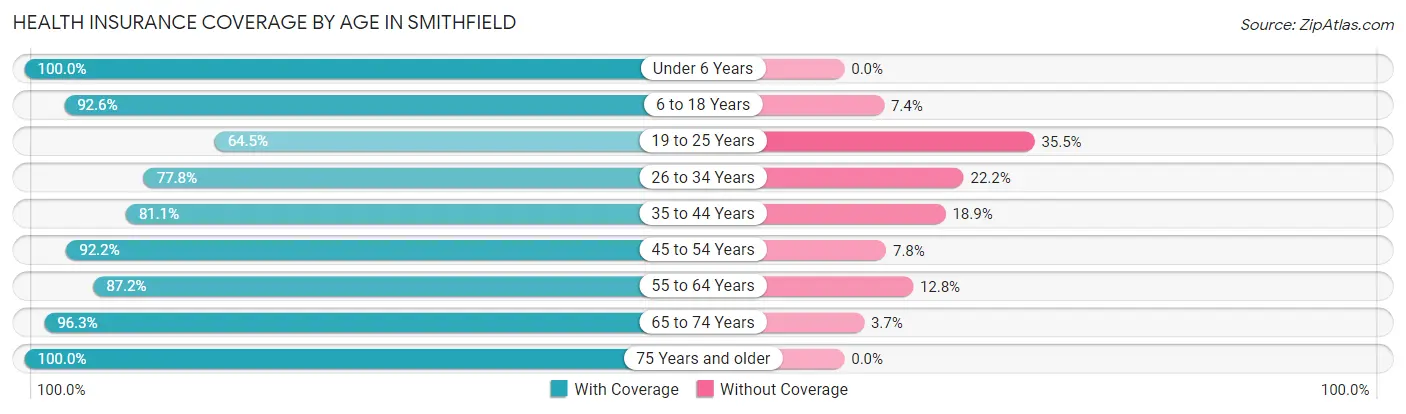
| Age Bracket | With Coverage | Without Coverage |
| Under 6 Years | 573 (100.0%) | 0 (0.0%) |
| 6 to 18 Years | 2,040 (92.6%) | 163 (7.4%) |
| 19 to 25 Years | 495 (64.5%) | 272 (35.5%) |
| 26 to 34 Years | 888 (77.8%) | 254 (22.2%) |
| 35 to 44 Years | 989 (81.1%) | 230 (18.9%) |
| 45 to 54 Years | 1,364 (92.2%) | 115 (7.8%) |
| 55 to 64 Years | 1,519 (87.2%) | 223 (12.8%) |
| 65 to 74 Years | 1,156 (96.3%) | 44 (3.7%) |
| 75 Years and older | 626 (100.0%) | 0 (0.0%) |
| Total | 9,650 (88.1%) | 1,301 (11.9%) |
Health Insurance Coverage by Citizenship Status in Smithfield
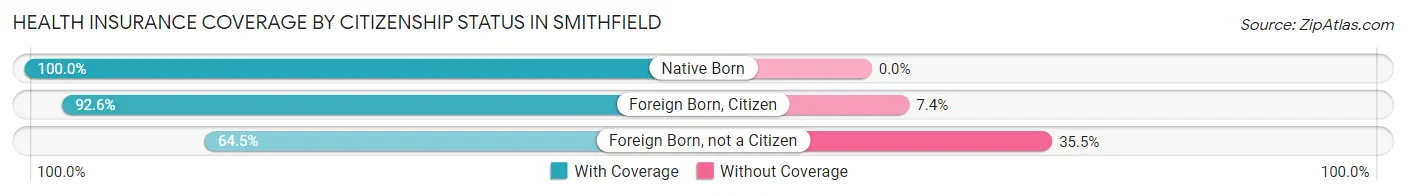
| Citizenship Status | With Coverage | Without Coverage |
| Native Born | 573 (100.0%) | 0 (0.0%) |
| Foreign Born, Citizen | 2,040 (92.6%) | 163 (7.4%) |
| Foreign Born, not a Citizen | 495 (64.5%) | 272 (35.5%) |
Health Insurance Coverage by Household Income in Smithfield
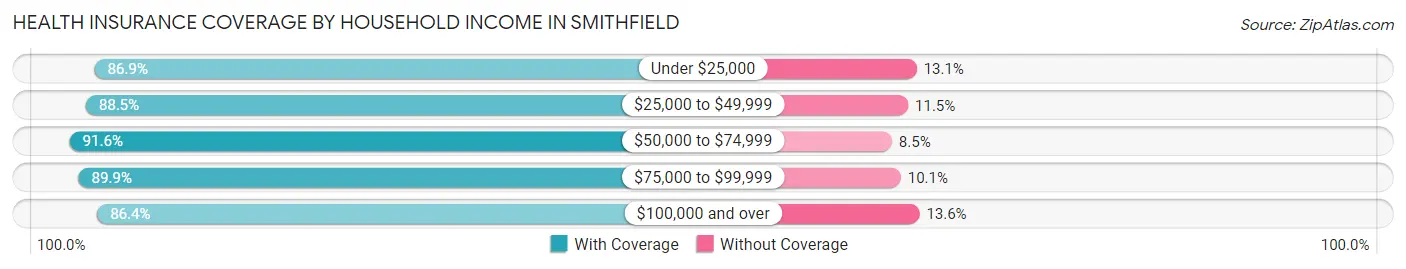
| Household Income | With Coverage | Without Coverage |
| Under $25,000 | 2,309 (86.9%) | 348 (13.1%) |
| $25,000 to $49,999 | 2,618 (88.5%) | 340 (11.5%) |
| $50,000 to $74,999 | 1,181 (91.5%) | 109 (8.5%) |
| $75,000 to $99,999 | 924 (89.9%) | 104 (10.1%) |
| $100,000 and over | 2,533 (86.4%) | 399 (13.6%) |
Public vs Private Health Insurance Coverage by Age in Smithfield
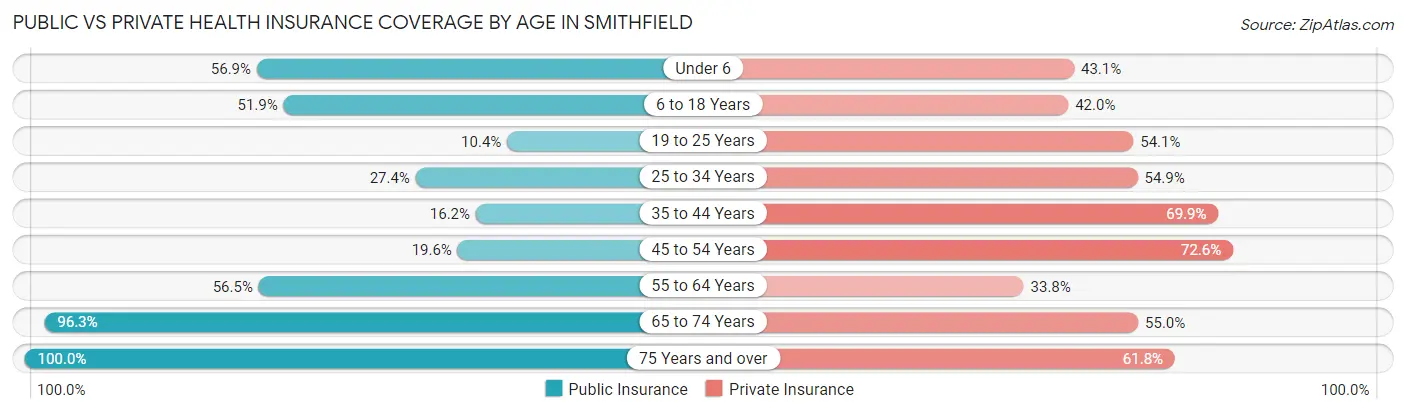
| Age Bracket | Public Insurance | Private Insurance |
| Under 6 | 326 (56.9%) | 247 (43.1%) |
| 6 to 18 Years | 1,144 (51.9%) | 926 (42.0%) |
| 19 to 25 Years | 80 (10.4%) | 415 (54.1%) |
| 25 to 34 Years | 313 (27.4%) | 627 (54.9%) |
| 35 to 44 Years | 198 (16.2%) | 852 (69.9%) |
| 45 to 54 Years | 290 (19.6%) | 1,074 (72.6%) |
| 55 to 64 Years | 985 (56.5%) | 588 (33.8%) |
| 65 to 74 Years | 1,156 (96.3%) | 660 (55.0%) |
| 75 Years and over | 626 (100.0%) | 387 (61.8%) |
| Total | 5,118 (46.7%) | 5,776 (52.7%) |
Disability Status by Sex by Age in Smithfield
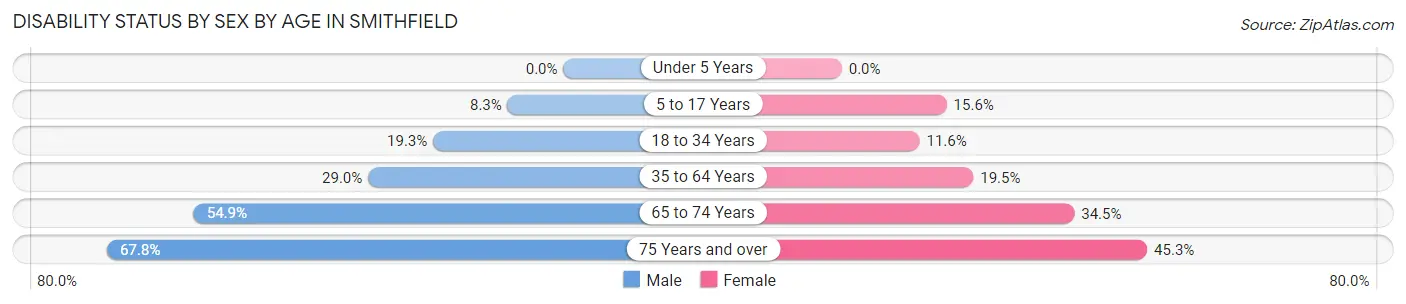
| Age Bracket | Male | Female |
| Under 5 Years | 0 (0.0%) | 0 (0.0%) |
| 5 to 17 Years | 75 (8.3%) | 219 (15.6%) |
| 18 to 34 Years | 198 (19.3%) | 103 (11.6%) |
| 35 to 64 Years | 683 (29.0%) | 407 (19.5%) |
| 65 to 74 Years | 293 (54.9%) | 230 (34.5%) |
| 75 Years and over | 206 (67.8%) | 146 (45.3%) |
Disability Class by Sex by Age in Smithfield
Disability Class: Hearing Difficulty
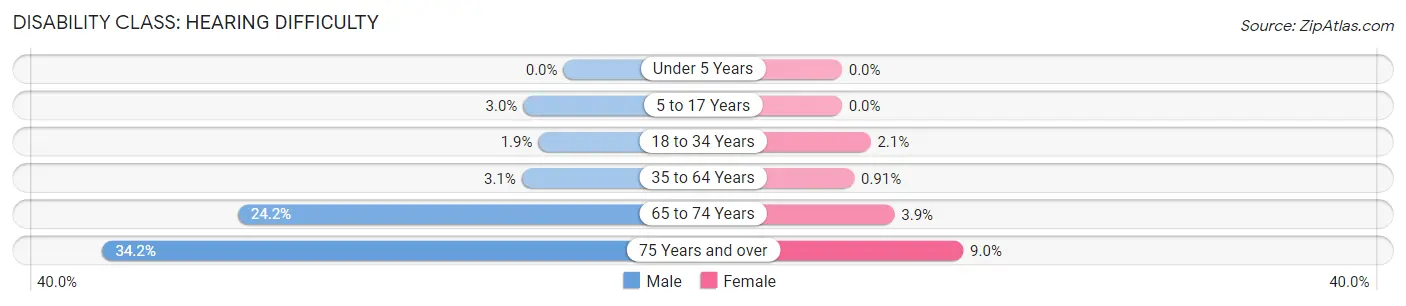
| Age Bracket | Male | Female |
| Under 5 Years | 0 (0.0%) | 0 (0.0%) |
| 5 to 17 Years | 27 (3.0%) | 0 (0.0%) |
| 18 to 34 Years | 19 (1.9%) | 19 (2.1%) |
| 35 to 64 Years | 73 (3.1%) | 19 (0.9%) |
| 65 to 74 Years | 129 (24.2%) | 26 (3.9%) |
| 75 Years and over | 104 (34.2%) | 29 (9.0%) |
Disability Class: Vision Difficulty
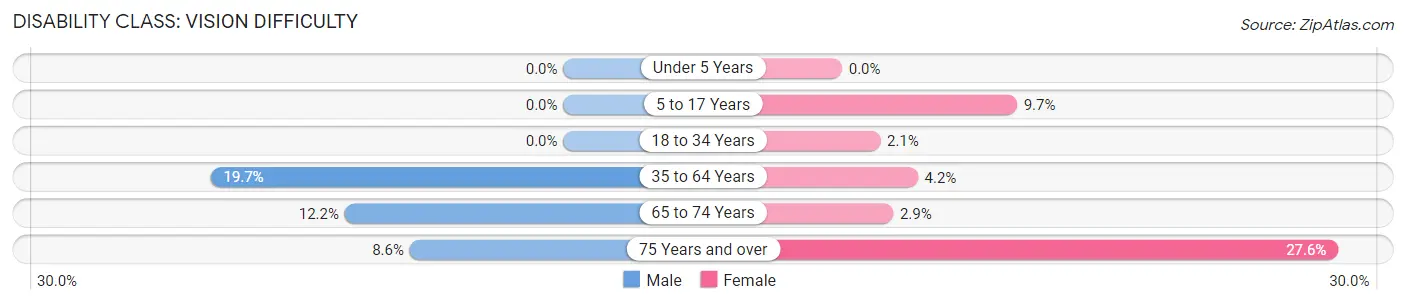
| Age Bracket | Male | Female |
| Under 5 Years | 0 (0.0%) | 0 (0.0%) |
| 5 to 17 Years | 0 (0.0%) | 137 (9.7%) |
| 18 to 34 Years | 0 (0.0%) | 19 (2.1%) |
| 35 to 64 Years | 463 (19.7%) | 88 (4.2%) |
| 65 to 74 Years | 65 (12.2%) | 19 (2.9%) |
| 75 Years and over | 26 (8.6%) | 89 (27.6%) |
Disability Class: Cognitive Difficulty
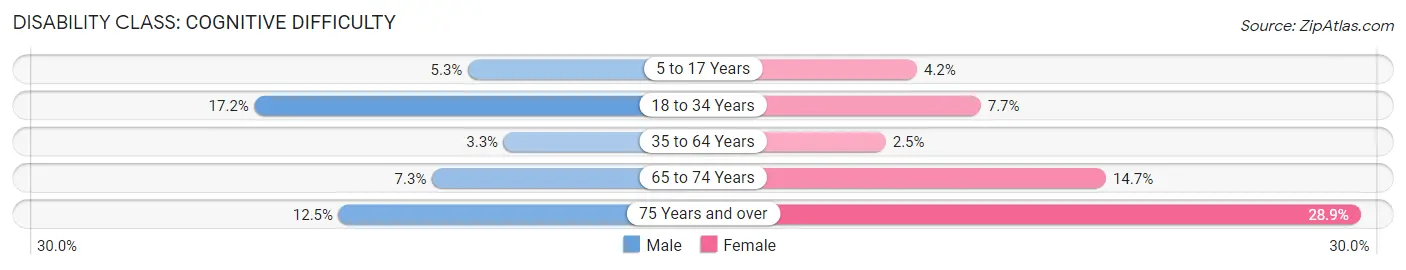
| Age Bracket | Male | Female |
| 5 to 17 Years | 48 (5.3%) | 59 (4.2%) |
| 18 to 34 Years | 176 (17.2%) | 69 (7.7%) |
| 35 to 64 Years | 78 (3.3%) | 51 (2.5%) |
| 65 to 74 Years | 39 (7.3%) | 98 (14.7%) |
| 75 Years and over | 38 (12.5%) | 93 (28.9%) |
Disability Class: Ambulatory Difficulty
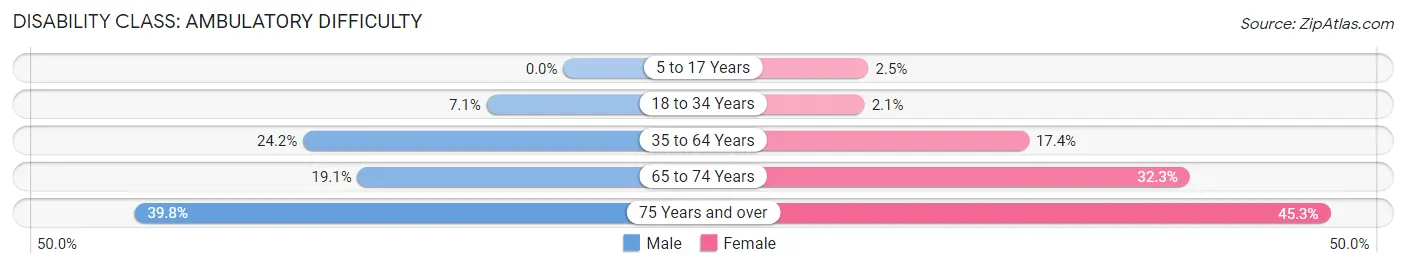
| Age Bracket | Male | Female |
| 5 to 17 Years | 0 (0.0%) | 35 (2.5%) |
| 18 to 34 Years | 73 (7.1%) | 19 (2.1%) |
| 35 to 64 Years | 569 (24.1%) | 362 (17.4%) |
| 65 to 74 Years | 102 (19.1%) | 215 (32.3%) |
| 75 Years and over | 121 (39.8%) | 146 (45.3%) |
Disability Class: Self-Care Difficulty
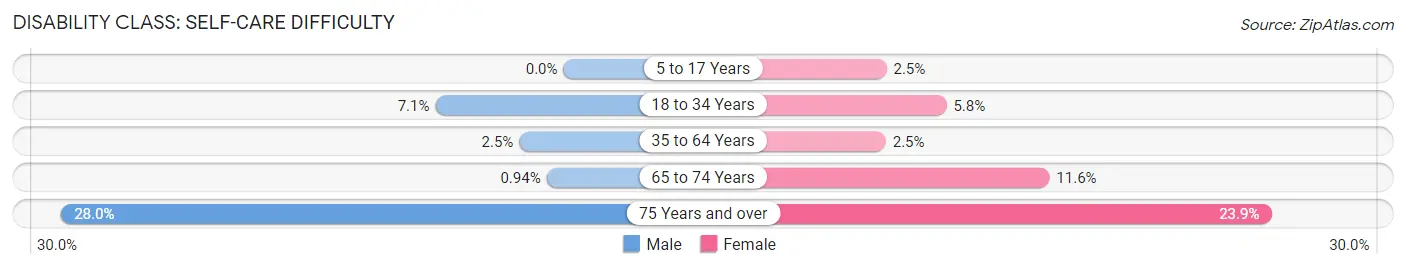
| Age Bracket | Male | Female |
| 5 to 17 Years | 0 (0.0%) | 35 (2.5%) |
| 18 to 34 Years | 73 (7.1%) | 52 (5.8%) |
| 35 to 64 Years | 58 (2.5%) | 51 (2.5%) |
| 65 to 74 Years | 5 (0.9%) | 77 (11.6%) |
| 75 Years and over | 85 (28.0%) | 77 (23.9%) |
Technology Access in Smithfield
Computing Device Access in Smithfield
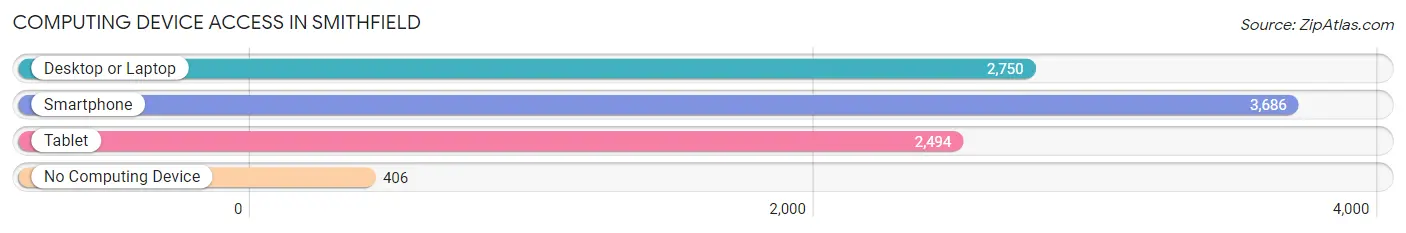
| Device Type | # Households | % Households |
| Desktop or Laptop | 2,750 | 60.8% |
| Smartphone | 3,686 | 81.5% |
| Tablet | 2,494 | 55.1% |
| No Computing Device | 406 | 9.0% |
| Total | 4,524 | 100.0% |
Internet Access in Smithfield
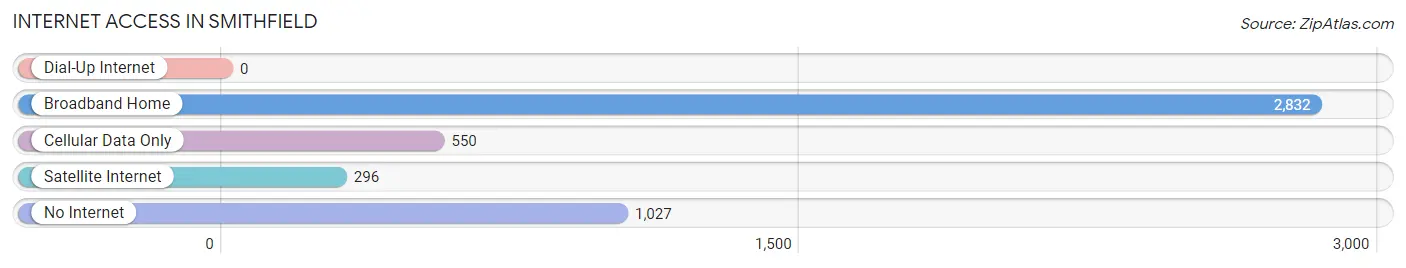
| Internet Type | # Households | % Households |
| Dial-Up Internet | 0 | 0.0% |
| Broadband Home | 2,832 | 62.6% |
| Cellular Data Only | 550 | 12.2% |
| Satellite Internet | 296 | 6.5% |
| No Internet | 1,027 | 22.7% |
| Total | 4,524 | 100.0% |
Smithfield Summary
Smithfield is a town located in Johnston County, North Carolina, United States. It is the county seat of Johnston County and is located in the heart of the state’s agricultural region. The town was founded in 1777 and has a population of approximately 11,000 people.
History
Smithfield was founded in 1777 by a group of settlers from the nearby town of Smithfield, Virginia. The town was named after the original Smithfield, Virginia, which was named after the Smith family who had settled there in the early 1700s. The town was originally a trading post and was the first county seat of Johnston County.
In the early 1800s, Smithfield became a major center for the production of tobacco, cotton, and other agricultural products. The town was also home to several mills, including a cotton mill, a grist mill, and a sawmill.
In the late 1800s, Smithfield became a major railroad hub, with the Wilmington and Weldon Railroad running through the town. This allowed for the transportation of goods and people to and from the town.
In the early 1900s, Smithfield became a major center for the production of furniture and other wood products. The town was also home to several factories, including a cotton mill, a furniture factory, and a shoe factory.
Geography
Smithfield is located in the heart of Johnston County, North Carolina. The town is situated on the Neuse River, which flows through the town and provides a source of water for the town’s residents. The town is located approximately 30 miles southeast of Raleigh, the state capital.
The town is located in a predominantly rural area, with the majority of the land being used for agricultural purposes. The town is also home to several parks, including the Smithfield Community Park, which features a playground, picnic areas, and a walking trail.
Economy
Smithfield’s economy is largely based on agriculture and manufacturing. The town is home to several large agricultural operations, including hog farms, poultry farms, and vegetable farms. The town is also home to several manufacturing companies, including furniture manufacturers, textile manufacturers, and food processing companies.
The town is also home to several retail stores, restaurants, and other businesses. The town is also home to several medical facilities, including a hospital and several clinics.
Demographics
As of the 2010 census, Smithfield had a population of 11,000 people. The town is predominantly white, with approximately 75% of the population being white. The town is also home to a small African American population, with approximately 15% of the population being African American. The town is also home to a small Hispanic population, with approximately 5% of the population being Hispanic.
The town has a median household income of approximately $45,000, which is slightly lower than the state average. The town also has a poverty rate of approximately 15%, which is slightly higher than the state average.
Conclusion
Smithfield is a small town located in Johnston County, North Carolina. The town was founded in 1777 and has a population of approximately 11,000 people. The town’s economy is largely based on agriculture and manufacturing, and the town is home to several retail stores, restaurants, and other businesses. The town is predominantly white, with approximately 75% of the population being white. The town has a median household income of approximately $45,000 and a poverty rate of approximately 15%.
Common Questions
What is Per Capita Income in Smithfield?
Per Capita income in Smithfield is $26,778.
What is the Median Family Income in Smithfield?
Median Family Income in Smithfield is $62,697.
What is the Median Household income in Smithfield?
Median Household Income in Smithfield is $37,000.
What is Income or Wage Gap in Smithfield?
Income or Wage Gap in Smithfield is 31.2%.
Women in Smithfield earn 68.8 cents for every dollar earned by a man.
What is Inequality or Gini Index in Smithfield?
Inequality or Gini Index in Smithfield is 0.57.
What is the Total Population of Smithfield?
Total Population of Smithfield is 11,527.
What is the Total Male Population of Smithfield?
Total Male Population of Smithfield is 5,625.
What is the Total Female Population of Smithfield?
Total Female Population of Smithfield is 5,902.
What is the Ratio of Males per 100 Females in Smithfield?
There are 95.31 Males per 100 Females in Smithfield.
What is the Ratio of Females per 100 Males in Smithfield?
There are 104.92 Females per 100 Males in Smithfield.
What is the Median Population Age in Smithfield?
Median Population Age in Smithfield is 41.9 Years.
What is the Average Family Size in Smithfield
Average Family Size in Smithfield is 3.2 People.
What is the Average Household Size in Smithfield
Average Household Size in Smithfield is 2.4 People.
How Large is the Labor Force in Smithfield?
There are 4,414 People in the Labor Forcein in Smithfield.
What is the Percentage of People in the Labor Force in Smithfield?
48.6% of People are in the Labor Force in Smithfield.
What is the Unemployment Rate in Smithfield?
Unemployment Rate in Smithfield is 6.5%.